

Abstract
PURPOSE
To determine the effect of experimental glaucoma in macaque monkeys on oscillatory potentials (OPs) in the slow-sequence multifocal electroretinogram (mfERG).
METHODS
Photopic slow-sequence mfERGs were recorded from anesthetized adult macaque monkeys and normal human subjects. The stimulus consisted of 103 equal-sized hexagons within 17° of the fovea. The m-sequence was slowed, with 14 blank frames, ~200 ms, interleaved between flashes for monkeys and 7 blank frames, ~100 ms, for humans, to produce waveforms similar to the photopic full-field flash ERG. Recordings were made under control conditions (24 monkey eyes, 7 human) and after laser-induced experimental glaucoma in monkeys (n = 8). A Fourier fast transform [FFT] was used to determine the frequency ranges of the major OPs. OP amplitudes were quantified by using root mean square (RMS) for two-frequency bands in five horizontal and four vertical locations. Visual field defects were assessed using behavioral static perimetry. Full-field photopic flash ERGs also were recorded.
RESULTS
OPs in two distinct frequency bands were discriminated in the monkey mfERG: fast OPs, with a peak frequency of 143 ± 20 Hz, and slow OPs, with a peak at 77 ± 8 Hz. There were similar findings in humans and with the flash ERG in monkeys. The fast OP RMS in monkey control eyes was significantly larger in temporal than nasal retina (P < 0.01) and in superior versus inferior retina (P < 0.05) as reported previously. The slow OP RMS was largest in the foveal region. Experimental glaucoma reduced fast OP RMS in all locations studied, even when visual field defects were moderate (MD = −5 to −10 dB; P < 0.05), whereas the slow OP RMS was reduced significantly primarily in the foveal region when field defects were severe (MD < −10 dB; P < 0.05). The fast OP RMS showed a moderate correlation with local visual field sensitivity and with local ganglion cell density (calculated from visual field sensitivity). For the slow OPs the correlation was much poorer. Consistent with previous studies, the photopic negative response (PhNR) amplitude was significantly reduced when the visual sensitivity was minimally affected.
CONCLUSIONS
OPs in the ERG of primates fall in two frequency bands: fast OPs with a peak frequency around 143 Hz and slow OPs, with a peak frequency around 77 Hz. The fast OPs, which rely more on the integrity of retinal ganglion cells and their axons than do the slow OPs, have potential utility for monitoring the progression of glaucoma and the effects of treatment.
Primary open-angle glaucoma (POAG) is one of the leading causes of blindness worldwide.1 The death of retinal ganglion cells in POAG is reflected by increased cupping of the optic disc, loss of nerve fiber layer and functional visual field defects.2 Perimetry has been considered to be the gold standard in the diagnosis of glaucoma. However, a disadvantage of standard perimetry is that the first visual field defects appear only after a significant proportion (~25%–40%) of ganglion cells and nerve fibers have died.3-5 Therefore, more sensitive tests that can detect early retinal ganglion cell changes in glaucoma would be useful.
One technique that objectively measures retinal function is the electroretinogram (ERG). The ERG is a useful tool for noninvasive assessment of function in normal and diseased retinas. In recent years, several studies in patients with glaucoma and in primate models of glaucoma have shown that the photopic ERG has components that are sensitive to glaucomatous optic neuropathy. These components include the negative potential at 95 ms of the transient pattern (p)ERG, known as the N956-8; the photopic negative response (PhNR) of the photopic full-field flash ERG9-12; and the oscillatory potentials (OPs) recorded in response to high-intensity flashes13,14 (Rangaswamy NV et al. IOVS 2002;43:E-Abstract 2170; Rangaswamy NV et al. IOVS 2003;44:E-Abstract 2702).
Although these components of the ERG are sensitive to glaucomatous damage, they reflect activity of the whole or large regions of the retina, and do not provide information about regional ganglion cell defects. In contrast, the results of perimetry indicate the regional nature of damage to the ganglion cells and their axons. A test that measures responses from different retinal locations might be more sensitive to early changes in the retinal ganglion cell responses that occur locally and would be lost in averaging of ERG responses over the entire retina.
The multifocal ERG (mfERG) technique developed by Sutter has made it possible to obtain a topographic representation of the retinal function15,16 in analogy to the topographical representation of the light sensitivity by perimetry. Commonly, the mfERG is recorded at a frame rate of 75 Hz where every frame of the m-sequence changes every 13.3 ms. The mfERG obtained using this paradigm is called the fast-sequence mfERG. The fast-sequence mfERG response is mainly composed of an on- and off-bipolar cell contribution with a small contribution from the inner retina.17 The inner retinal contributions are oscillatory in nature and are in the form of nasotemporal asymmetries in the waveform. The response was determined by recording the fast-sequence mfERG in monkeys, before and after pharmacologic inner retinal blockade and/or experimental glaucoma.18-20
OPs are better described and more prominent in the full-field flash ERG, than in the fast-sequence mfERG. The mfERG waveforms can be made similar to those of the full-field flash ERG by slowing the presentation. This can be done by interleaving blank frames between m-sequence presentations,21 to produce what has been named the slow-sequence mfERG. In a recent study involving the slow-sequence mfERG in monkeys,22 we described OPs that had nasotemporal asymmetries (i.e., larger amplitudes in temporal macula than nasal macula), similar to those described when using discrete focal stimuli,23,24 and when using slow-sequence mfERGs (three frames interleaved) in humans.25,26 These OPs were reduced or eliminated by pharmacologic blockade of inner retinal neuronal activity (i.e., amacrine and ganglion cells), consistent with previous studies in monkeys that showed the dependence of the OPs on the integrity of the inner retina.27 However, the exact cellular origin (amacrine versus ganglion cell) of the OPs is still not known.
OPs in human ERGs have long been reported to have an inner retinal origin, and several studies have reported a reduction in the OPs recorded in the full-field ERG in diseases that affect the inner retina, such as diabetes and glaucoma.13,14,28-30 Recent studies using the slow-sequence mfERG to study patients with diabetic retinopathy, glaucoma, and laser-induced retinal nerve fiber layer defects have also confirmed that the oscillatory components of the slow-sequence mfERG are reduced by these inner retinal diseases.31-34
Because OPs are reduced in inner retinal diseases or by pharmacologic blockade of the inner retina, and they are easy to see and to quantify in the slow-sequence mfERG, we decided to study, in a primate model, the effect of experimental glaucoma on these OPs. This enabled us to separate the contribution likely to be generated by the ganglion versus amacrine cells, and to look for local changes in ganglion cell contributions. The results of the present study show that experimental glaucoma reduced both the amplitude of high frequency Ops, which had a peak frequency of approximately 145 Hz, and the nasotemporal asymmetries in the response. In contrast, a slower set of OPs, with peak frequency approximately half that of the high-frequency OPs was less affected by experimental glaucoma.
METHODS
Animal Preparation
Recordings were obtained from eight eyes of eight adult monkeys (Macaca mulatta) with laser-induced experimental glaucoma and 24 control eyes (this included the left eye of six animals with unilateral glaucoma and the left eye before induction of experimental glaucoma in two animals with bilateral experimental glaucoma). All these animals were subjects in other studies as well. Animals were anesthetized with intramuscular injection of ketamine (20–25 mg/kg per hour) and xylazine (0.8–0.9 mg/kg per hour) and were treated subcutaneously with atropine sulfate (0.04 mg/kg). Body temperature was maintained between 36.5°C and 38°C with a water-circulation heating pad during the early experiments (Heska Corp., Fort Collins, CO) and with a thermostatically controlled blanket in later experiments (TC1000 temperature controller; CWE, Ardmore, PA). Heart rate and blood oxygen were monitored with a pulse oximeter (model 44021; Heska Corp.). Pupils were fully dilated to approximately 8.5 mm in diameter with topical tropicamide (1%) and phenylephrine (2.5%). Eyes were refracted and fitted with appropriate contact lenses for the viewing distance.
A modified monocular direct ophthalmoscope (American Optical Co., Buffalo, NY) was used to center the projection of the fovea on the midpoint of the stimulus pattern (Fig. 1A). Although eye movements were negligible with this anesthetic regimen,35 the position of the fovea was frequently checked and recentered when necessary. All experimental procedures adhered to the ARVO Statement for the Use of Animals in Ophthalmic and Vision Research and were approved by the Institutional Animal Care Committee of the University of Houston.
Figure 1.
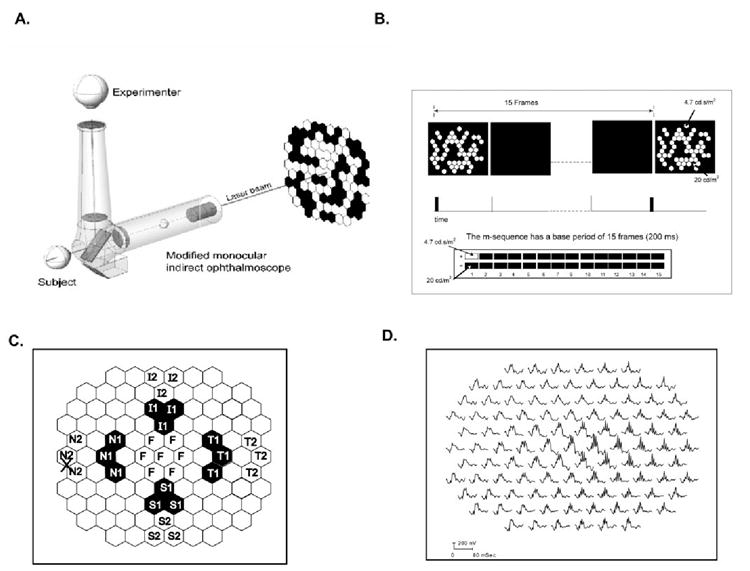
(A) The ophthalmoscopic technique used to center the fovea of the monkeys at the midpoint of the stimulus array (103 equal-sized hexagons). A monocular direct ophthalmoscope fitted with a laser was centered on the subject’s fovea and its position projected onto the stimulus monitor. (B) The slow-sequence paradigm used in the study had a base period of 15 frames, where every m-sequence was separated by at least 200 ms with 14 blank frames between. The stimulus energy for the white flashes was 4.7 cd-s/m2 and for the black was 20 cd/m2. (C) Multifocal stimulus display highlighting the retinal areas (chevrons) analyzed in this study (N1, N2: nasal; F, foveal; T1, T2, temporal; S1, S2, superior; and I1, I2: inferior retina).The labels represent the respective retinal locations. (D) Multifocal trace array from the left eye of a control monkey showing all 103 mfERG responses. The nasotemporal asymmetry in OPs can be seen clearly in this trace array.
Recording
ERG recordings were obtained differentially between DTL electrodes36 placed across the cornea of both eyes under contact lenses, the ground electrode was a thin needle in the scalp. For mfERG studies, recordings were amplified and filtered (1–300 Hz) by an amplifier (model 5A22N; Tektronix, Beaverton, OR), and were digitized, averaged, and amplified by hardware and software (VERIS) from EDI (Electro-Diagnostic Imaging). For flash ERGs, either the same amplifier or similar amplification (Espion; Diagnosys, Inc., Littleton, MA) was used. Recording sessions lasted 3 to 4 hours, after which the animals recovered.
Visual Stimulation
Multifocal Stimulation
The stimulus display consisted of 103 equal-sized hexagons, each approximately 3.3° wide, in a field of approximately 35 ° × 33°. The optic nerve head is approximately 16.5° from the fovea in monkeys and 17° in humans. Recordings were made with the room lights on. Hexagons appeared at the same luminance as surround (20 cd/m2) or briefly as a bright flash (4.7 cd-s/m2; Fig. 1B). Photopic luminance (cd/m2) of the stimulus was calibrated using a spot photometer (model LS-100; Minolta Camera Co., Ltd., Osaka, Japan). The elements of the sequence were 13.3 ms in duration (corresponding to the frame rate of 75 Hz). However, the actual duration of the incremental light producing a white hexagon was under 2 ms. In the slow sequence, as illustrated in Figure 1B, the frames in which the hexagons appeared (m-frame) were separated by 14 blank frames (time between flashes being at least 200 ms) for which the entire screen was typically at the background luminance of 20 cd/m2. On every m-frame a given hexagon had a 50% chance of remaining at the background luminance or flashing very briefly with an energy of 4.7 cd-s/m2. In prior experiments, we found that OP amplitudes were maximized when the delay between flashes was 200 ms or longer.22
Full-Field Stimulation
During each experimental session, we also recorded the full-field flash ERG to elicit the PhNR, which has been reported to be sensitive to early glaucomatous changes.9-12 The Ganzfeld stimulus was produced by the rear illumination of a section of a white concave diffuser (35 mm in diameter) in earlier experiments or by the colorburst stimulator provided with the amplifier (Espion; Diagnosys, Inc.) in the later experiments and was placed very close to one eye. The monkey’s nontested eye was covered. Stimuli were red Ganzfeld flashes (λmax for Espion = 660 nm and for the VERIS stimulator = 630 nm) produced by an array of light-emitting diodes (LEDs) of brief (< 5 ms) duration on a blue background (λmax for Espion = 460 nm and for the VERIS stimulator = 450 nm). Stimuli were presented in ordered sequences, increasing in intensity and with sufficient interstimulus intervals to avoid adaptive effects. Photopic and scotopic luminances were calibrated with a photometer (model IL1700; International Light, Newburyport, MA) with CIE (Commission Internationale de l’Éclairage) photopic and scotopic correction filters. Scotopic trolands for the background and troland-seconds for the brief flashes were calculated for and 8.5-mm diameter pupil, without correction for the Stiles-Crawford effect.
In addition, photopic full-field flash ERGs were obtained with bright xenon flashes on a rod-saturating blue background from seven control monkeys. The stimulus energy of the xenon flashes was 3.2 or 12.9 cd-s/m2. The full-field ERGs obtained with these stimuli were compared with the slow-sequence mfERGs.
Experimental Glaucoma
The intraocular pressure (IOP) in one eye (usually the right eye) of six monkeys and both eyes of two monkeys was elevated by one to four blue-green argon laser treatments of the trabecular meshwork in anesthetized animals, as described previously.37 Briefly, treatment spots (50-μm spot size, 1.0-W power, and 0.5-second duration) were placed to produce continuous tissue blanching in the trabecular meshwork, by using a slit lamp delivery system (model PC; HGM, Salt Lake City, UT). IOPs were measured before ERG recording with a hand-held applanation tonometer (model HA-1; Kowa Co., Ltd., Tokyo, Japan). Average IOPs after final laser treatments in the six subjects with unilateral glaucoma in the control and experimental eyes, respectively, were: subject OHT-29 (14, 33 mm Hg), OHT-30 (11, 24 mm Hg), OHT-31 (13, 60 mm Hg), OHT-34 (7.7, 24.7 mm Hg), OHT-40 (7.7, 27.3 mm Hg), and OHT-42 (8.7, 14.7 mm Hg) In animals with bilateral glaucoma, the IOPs in the right and left eyes, respectively, were: subject OHT-37 (43, 46.3 mm Hg) and OHT-39 (41.3, 40 mm Hg). Only the ERGs from the right eye of all animals were considered.
Perimetry
As part of other studies as well, static perimetry was performed frequently on all animals with a perimeter (Humphrey Visual Field Analyzer model 630; Carl Zeiss Meditec, Dublin, CA.) running the central 24-2 Full-Threshold program (Goldmann size III target, 0.43° in diameter), modified to accommodate animal behavior. The perimetric testing methods for monkeys have been described previously.38
Human Subjects
Multifocal ERGs were also obtained from seven control human subjects (who were also studied in Rangaswamy et al.22) with the same stimulus as that used in monkeys (4.7 cd-s/m2 and background luminance of 20 cd/m2) but with a different paradigm (7 frames) where the m-sequence were separated by 7 (7F) rather than 14 (14F) blank frames (i.e., by approximately 100 ms). The interflash interval was reduced in the humans, to double the trials recorded in a fixed time and thus to improve the signal-to-noise ratio in the human subjects without lengthening the recording time. The ERGs were recorded differentially between the two eyes with DTL electrodes, and the ground electrode was an EEG skin electrode that was placed on the forehead. All procedures were approved by the University of Houston Committee for Protection of Human Subjects and adhered to the Declaration of Helsinki. Informed consent was obtained from all subjects after the procedures were completely explained.
Analysis
Multifocal ERG
Figure 2 shows frequency spectra over the whole record of the slow-sequence mfERG obtained by summing all 103 responses (Fig. 2, left) for a control monkey eye with 14F paradigm and of a full-field flash ERG (right) for another control eye. The insets in the left plot are for average summed mfERG from monkeys with the 14F paradigm (top inset) and for the average summed mfERG from humans with the 7F paradigm (bottom inset). As described more fully in the results, the frequency spectra in all plots consist of three zones, or frequency bands. A low-frequency band roughly between 0 and 50 Hz and two higher-frequency bands, one peaking around 77 Hz, the other around 143 Hz. The lowest-frequency band corresponds to the initial negative and positive waves of the slow-sequence mfERG, analogous to the a- and b-waves of the full-field flash ERG. The other two bands (see Table 1 and the Results section) could be discriminated in all subjects. In a recent study Zhou et al. using a wave analysis method called “matching pursuit” to analyze the frequency, duration, energy and position of the major OPs for data from these same animals, described two dominant frequency bands for the OPs in the slow-sequence mfERG and called them slow and fast OPs (Zhou W et al. IOVS 2005;46:ARVO E-Abstract 3436). In this study we have adopted this nomenclature, but have based our analysis solely on the frequency ranges, rather than other properties of the responses.
Figure 2.
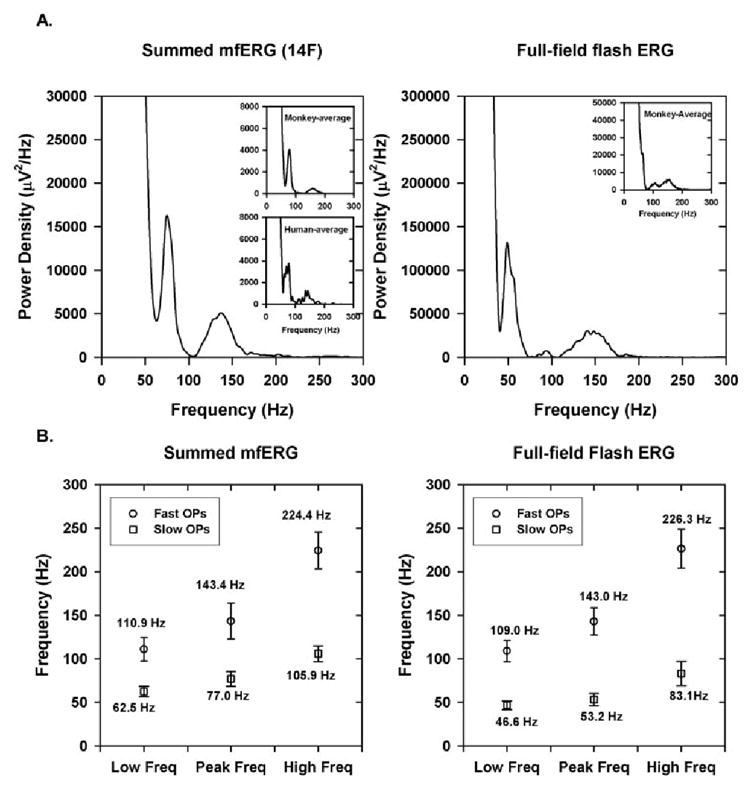
(A) Frequency spectrum of the mfERG from a control monkey eye for summed slow-sequence mfERGs with the 14F paradigm (left) and from another control monkey eye for a full-field flash ERG (right). Insets, left: the frequency spectrum for the average of 20 control monkey eyes for 14F (top inset) and frequency spectrum for the average of 7 human control subjects with 7F (bottom inset). Inset, right: frequency spectrum for the full-field flash ERG for the average of seven monkey eyes. (B) Mean of the minimum, maximum, and peak of the frequency spectrum for the slow and fast OPs for summed 14F (left) and full-field flash ERG (right). Error bars, ± 1 SD.
Table 1.
Frequency Limits
| Minimum Frequency | Maximum Frequency | Peak Frequency | |
|---|---|---|---|
| Fast OPs | |||
| Slow-sequence (14F) | 110.9 ± 3.1 | 224.4 ± 4.7 | 143.4 ± 4.6 |
| Slow-sequence (human: 7F) | 113.4 ± 16.9 | 193.4 ± 18.4 | 136.5 ± 17.9 |
| Full-field ERG | |||
| 3.2 cd-s/m2 | 117.9 ± 8.0 | 223.8 ± 10.4 | 148.1 ± 5.0 |
| 12.9 cd-s/m2 | 109.1 ± 5.0 | 226.3 ± 9.1 | 143.0 ± 6.3 |
| Slow OPs | |||
| Slow-sequence (14F) | 62.5 ± 1.3 | 105.9 ± 2.0 | 76.9 ± 1.9 |
| Slow-sequence (human: 7F) | 60.7 ± 6.1 | 98.4 ± 9.6 | 73.4 ± 6.3 |
| Full-field ERG | |||
| 3.2 cd-s/m2 | 49.1 ± 1.7 | 108.5 ± 6.9 | 61.9 ± 3.9 |
| 12.9 cd-s/m2 | 46.6 ± 2.0 | 83.1 ± 5.6 | 53.2 ± 3.0 |
Data are expressed as mean Hz ± SD.
The fast and slow OP amplitudes were quantified in this study by calculating the root mean square (RMS) of the extracted OPs between the limits of 62 and 105 Hz for the slow OP and between 110 and 224 Hz for the fast OPs. These limits were the mean of the minimum and maximum limits of the two frequency bands for the 20 control monkeys. The OPs were extracted from five retinal locations in the horizontal and four in the vertical meridians as shown in Figure 1C, and these regions, composed of three hexagons, were called “chevrons.” We used seven hexagons for the foveal region because the signal-to-noise ratio would be compromised if we only analyzed records for the central hexagon alone.
We chose a time interval between 10 and 60 ms to correspond to the signal window and between 100 and 150 ms to represent the noise window. We decided to use the same time window for both the fast and the slow OPs, even though the slow OPs were present in the records for longer durations than 60 ms (see extracted slow OPs in Figs. 3, 5), because we wanted to study the OPs that were present during the time that the major waves (a and b) of the ERG were present. Because both signal and noise occurred in the signal window, after calculating the root mean square (RMS) of the fast and slow sets of OPs in both windows, we removed the noise from the signal OP window, using the calculations of Hood et al.,39 and, in all the plots, the OP RMS of the signal without the noise is plotted. The noise values were small—on average, approximately 0.84 ± 0.31 nV/deg2 for the fast and 1.3 ± 0.61 nV/deg2 for the slow OPs. We observed that the relations between the OP RMS and the visual field sensitivity or ganglion cell density were not very different, whether the RMS was calculated for the signal alone or as signal with noise (data not shown).
Figure 3.
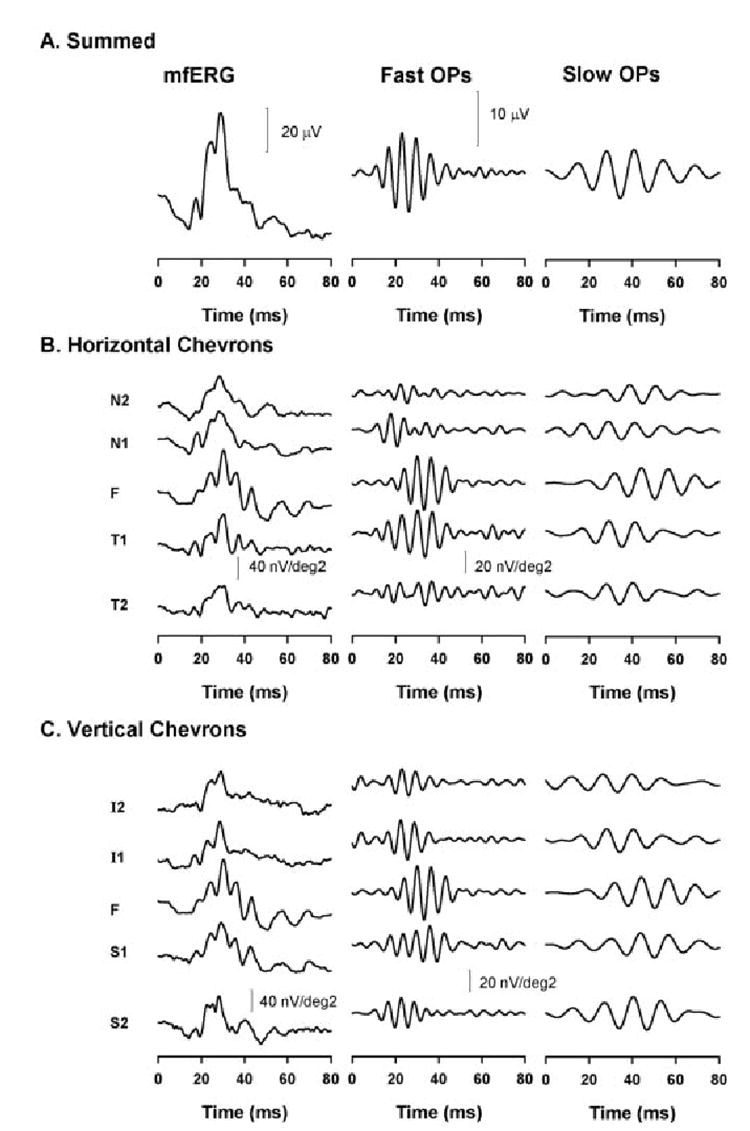
Slow-sequence mfERG in a control eye. MfERG (left), fast (middle), and slow OPs (right) for the summed mfERG (A), horizontal chevrons (B), and vertical chevrons (C).
Figure 5.
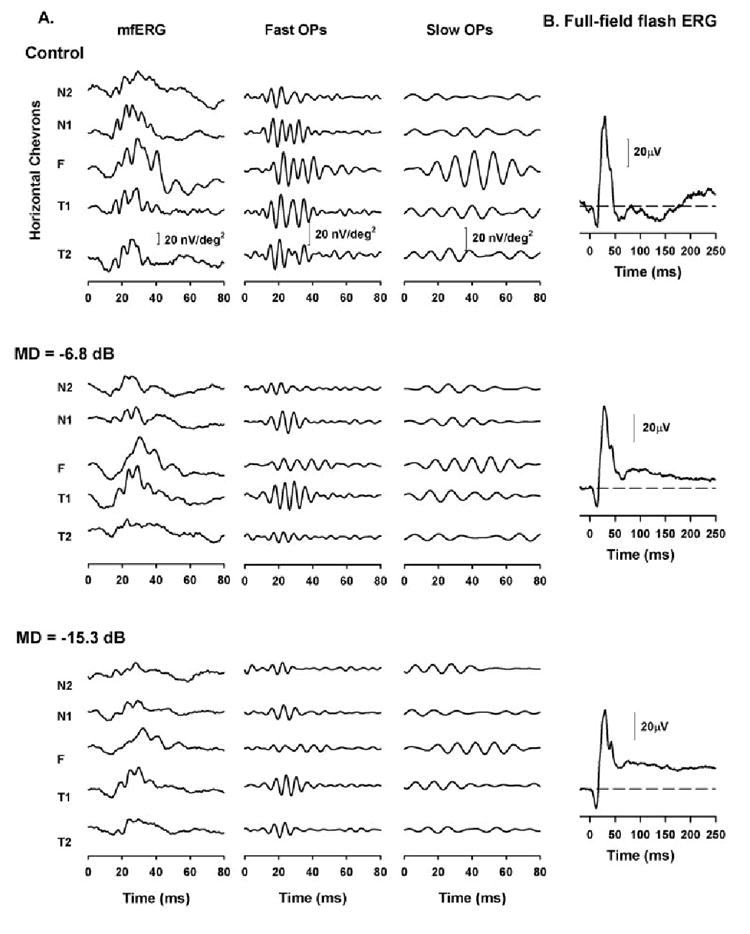
(A) Effect of experimental glaucoma on the slow-sequence mfERG on a representative animal (OHT-39). Left column: slow-sequence mfERG obtained for the five horizontal retinal locations; middle column: extracted fast OPs; right column: the extracted slow OPs for the five locations. Top: slow-sequence mfERGs, OPs, and OP RMS obtained from the right eye of this animal before induction of experimental glaucoma. Middle: same eye, 15 months after laser-induced experimental glaucoma with an MD of −6.8 dB; bottom: same eye, 16 months after laser-induced experimental glaucoma with an MD of −15.3 dB. (B) Full-field ERG for a 1.6 log td-s stimulus to elicit PhNRs recorded during the same experimental session in which the mfERGs were recorded.
A- and b-Wave Amplitude and Implicit Time
In addition to the OP measurements, we examined the effect of experimental glaucoma on the a- and b-waves (the first negative and positive wave of the mfERG). The amplitudes were determined at their respective implicit times, and these values were obtained for all locations shown in Figure 1C and compared between control eyes and glaucomatous eyes with moderate (MD between −5 and −10 dB) and severe (MD worse than −10 dB) glaucoma.
Visual Field Data Analysis
The extent of glaucomatous damage was determined from the sensitivities obtained from perimetric testing of the monkeys. Visual field defects in an affected eye are normally expressed as a difference in sensitivity between the affected eye and an age-matched normal from a normative database. MD is used to report the difference in sensitivity over the entire field, total deviation (TD) is used for localized differences in sensitivity.
To determine the sensitivity loss in locations where the OPs were analyzed in this study (Fig. 1C), we calculated the difference between the glaucomatous eye and the control eye in the given locations (TD). TD was calculated as follows: the sensitivities (in decibels) were first divided by 10 to convert them to log values and then the antilog was taken. The antilogs were averaged over the locations corresponding to each chevron and in the foveal region. Then, to convert the location average back to dB the TDs for the control and glaucomatous eyes were obtained by logging the averaged sensitivity values, multiplying the values by 10 to convert to decibels and then taking difference between the glaucomatous and the control eyes. Alternatively, the TDs were expressed as a proportion of control (linear units) by taking a ratio of the averaged sensitivity between the glaucomatous and control eyes. In the resultant sensitivity scale, 1 corresponds to the glaucomatous eye being as sensitive as the control eye, whereas 0 represents the glaucomatous eye as 0% as sensitive as the control eye, which corresponds to end-stage glaucoma.
Ganglion Cell Density Calculation
One of the purposes of this study was to investigate the retinal ganglion cell contribution to the OPs of the slow-sequence mfERG. Ideally, we would want to show a relation between the OP amplitude and ganglion cell density in different retinal locations, but for our limited data set, this comparison would probably be very noisy. Harwerth et al.40 have provided a model for calculating the ganglion cell density in any given visual field location using the visual field sensitivities in monkeys. This model is based on actual correlations between ganglion cell loss determined from histologic analysis and visual field sensitivity values at different retinal locations in numerous monkeys with experimental glaucoma, including five from the present study. We calculated the ganglion cell density as both decibels and proportion of control with the same calculations as explained for the TD.
Statistical Analysis
We used Student’s paired t-test to determine whether the differences in OP amplitude between different retinal locations were significant and to determine the effect of moderate and severe glaucoma on the OP amplitude in various locations. For the plots (Figs. 7-9) relating OP amplitude and TD (or sensitivity calculated based on TD) or derived ganglion cell density, linear regression lines were fitted, to illustrate trends in the data and to yield slopes and correlation coefficients. Although the plots contain repeated measures from some animals, as marked by the symbols, the measurements were not made at the same point in the progression of field loss for each animal and therefore repeated-measure ANOVA statistics were not appropriate, nor were strong statements about the significance of parameters obtained from the linear regression. To be more accurate, we calculated another type of regression called the local regression. Local regression is an approach used for fitting curves to noisy data by multivariate smoothing procedures in which a linear or quadratic function of the predictor variable is fit to data in a moving window.42 The local regression analyses, optimized by using quadratic functions, yielded values for variance (r 2) that were almost identical with those found using the linear regression shown in the plots and therefore are not reported in the results.
Figure 7.
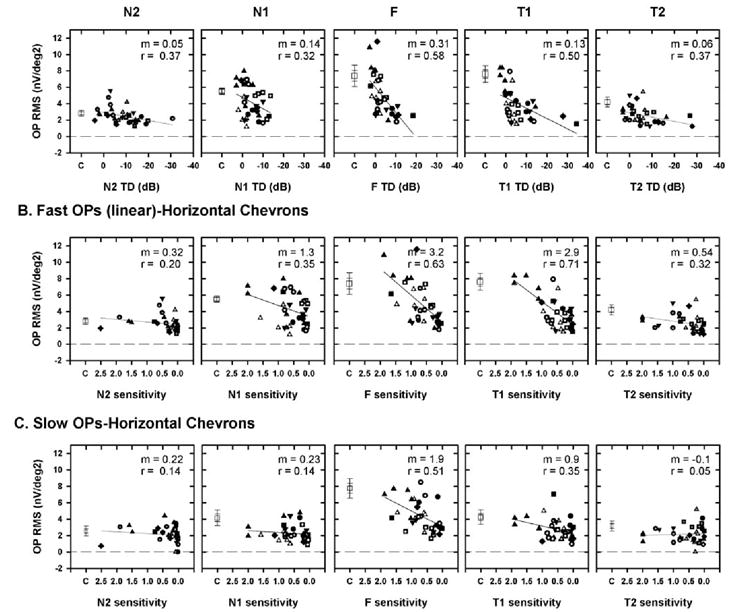
(A) Plot of the fast OP RMS of the signal as a function of visual field defect for the five horizontal chevrons, with the TD expressed in decibels (A) or as linear (proportion of the sensitivity of the control) sensitivity (B). (C) Plot of slow OP RMS signal as a function of visual field sensitivity expressed as a proportion of the control sensitivity. Symbols represent data from different animals. (◻) The mean of the OP RMS of the signal for the control eyes. Dashed line: a line through RMS = 0 to indicate that noise was removed. The slope (m) and correlation coefficient (r) for the OP RMS signal as a function of TD are shown at the top right of each plot. In contrast to the sensitivity on the abscissa, at the RMS on the ordinate was expressed as a calculated value and not as a proportion. Expressing the OP RMS as a proportion compressed the values, making changes in the OP RMS that occurred for small visual field defects difficult to determine (data not shown). Error bars: ±1 and 2 SEM
Figure 9.
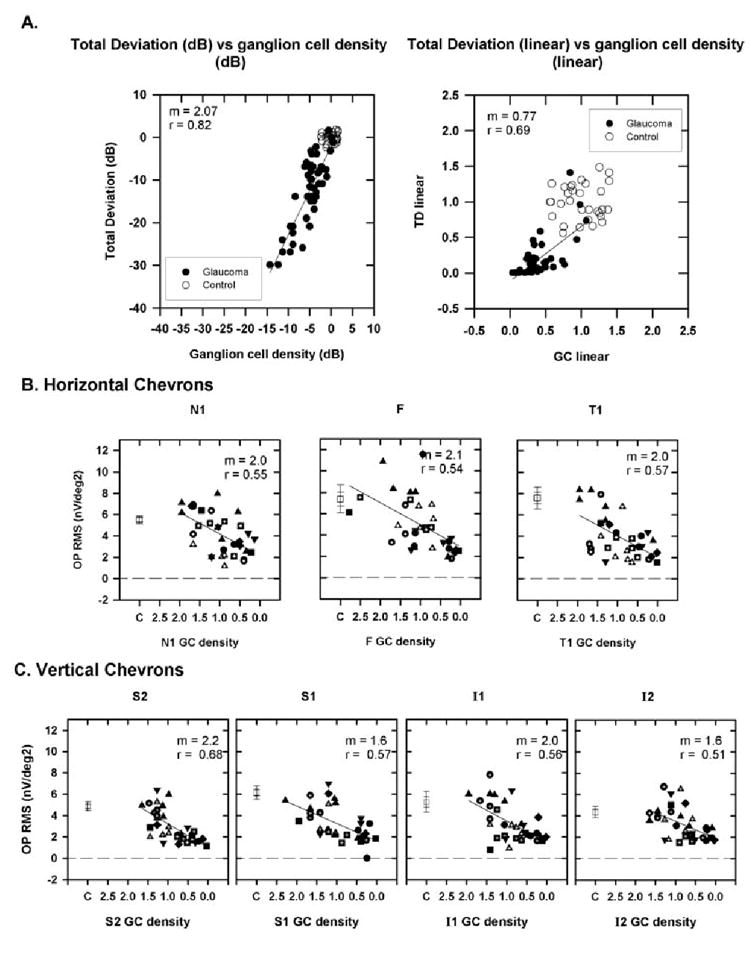
(A) Plot of TD as a function of ganglion cell (GC) density for a location with coordinates (x, y = 15°, 15°) is shown as an example calculated using equations 1 to 3 from Harwerth and Quigley41 for the monkeys used in the current study. Left: both TD and GC density are expressed in decibels; right: both are expressed as a proportion of control. Data are from (○) control and (●) glaucomatous eyes. (B) The fast OP RMS signal as a function of ganglion cell density calculated for the locations corresponding to the chevrons for N1, F, and T1. Data for N2 and T2 are not shown because changes in the fast OPs were small (see Fig. 7, Table 2). (C) The fast OP RMS signal as a function of ganglion cell density for vertical chevrons (S2, S1, I1, and I2). Symbols: as described in Figure 7. The slope (m) and correlation co-efficient (r) for the OP RMS signal as a function of GC density are shown at the top right of each plot. Error bars, ±1 and ±2 SEM.
RESULTS
OP Frequency Bands in the Control Slow-Sequence mfERGs
Figure 2 shows the frequency spectra obtained for the summed mfERG with the 14F paradigm in a control monkey eye (Fig. 2, left) and for a photopic full-field flash ERG for another control monkey eye (Fig. 2, right). As described in the Methods section, all normal eyes exhibited three frequency bands, with two higher-frequency bands representing the OPs, and these bands were also exhibited in response to the full-field flash ERG and the summed slow-sequence mfERG in human subjects. The top inset in Figure 2A (left) shows the frequency spectrum of the average summed mfERG for all control macaque eyes with the 14F paradigm. It is clear that the frequency spectrum of the individual monkey eye is very similar to the frequency spectrum of the average and also to that obtained from human subjects with 7F (bottom inset in the left plot). The inset in the right plot shows the frequency spectra for the average of full-field flash ERGs obtained for seven control monkeys, and it is very similar to the individual frequency spectrum.
Figure 2B shows the minimum and maximum limits and peak frequency of the fast and slow OPs for the summed 14F and for the full-field flash ERG. The mean ± 1 SEM of the minimum and maximum limits of the fast and slow OPs for the slow-sequence mfERG and the full-field flash ERG are listed in Table 1. It can be seen that there were essentially no differences in the frequency limits between the monkey and human slow-sequence mfERG for both slow and fast OPs. The frequency limits of the slow OPs of the full-field ERG were slightly lower than those of the slow-sequence mfERG, but there was no difference in the frequency limits of the fast OPs between the slow-sequence mfERG and the full-field ERG. There was also no difference in the frequency ranges between the two stimulus strengths for the full-field flash ERGs that were recorded. The energy of one of the full-field flash stimuli was slightly below the 4.7 cd-s/m2 used for the mfERGs, and the energy of the other was almost three times greater than the multifocal flash.
OPs in Control Eyes
Before examining the effects of experimental glaucoma on the OPs, we will describe the regional distribution of the fast and slow OPs in control eyes and examine whether the slow OPs in control eyes exhibit the nasotemporal asymmetry observed previously in the humans responding to a focal stimulus23,24 and for monkey slow-sequence mfERGs extracted between 90 and 300 Hz.24 In the present study, we also examined the OPs in the superior and inferior retina in control eyes and later in eyes with experimental glaucoma.
The mfERG and extracted OPs (fast and slow) are shown for a representative control eye for the summed mfERG (Fig. 3A), for horizontal (Fig. 3B) and for vertical (Fig. 3C) chevrons. (The responses corresponding to the foveal region [F] are the same for both the horizontal and vertical chevrons in Figs. 3B, 3C). As reported in previous studies, the fast OPs (middle) exhibit nasotemporal asymmetry when the temporal retinal OPs (both T1 and T2) are significantly larger than the OPs in the nasal retina (P < 0.01 for N1 vs. T1 and for N2 vs. T2; t-test). The nasotemporal variation in the OPs can also be better appreciated by examining the whole trace array obtained from a control monkey eye in Figure 1D. The slow OPs, however, did not exhibit nasotemporal asymmetry. This result is well-illustrated in Figure 4, top, where the OP RMSs for both fast and slow OPs obtained for all five horizontal chevrons from 20 control eyes are plotted in a bar graph. The slow OP RMS in the foveal region was larger than in the nasal (N) and temporal (T) retina.
Figure 4.

Mean RMS fast (left) and slow (right) OPs for horizontal (top) and vertical (bottom) chevrons. Error bars, ±1 SEM.
In the vertical chevrons, the fast OPs were significantly larger in the superior (S) than in the inferior (I) retina (P < 0.05 for both S1 vs. I1 and S2 vs. I2; t-test), as shown in the bar graph in Figure 4, bottom. A vertical asymmetry was reported previously in OPs recorded in focal ERGs by Miyake et al.23,24 This asymmetry was not present in the vertical meridian in the slow OPs. However, the fast OP RMS was significantly larger than the slow OP RMS in the T1 (P < 0.01) and T2 (P < 0.05) and S1 (P < 0.01) locations.
Effect of Experimental Glaucoma on OP RMS in a Representative Subject
Figure 5A shows the slow-sequence mfERG and the two OP bands for the five horizontal chevrons from a representative animal (OHT-39) before (Fig. 5, top) and after induction of laser-induced experimental glaucoma at two stages (Fig. 5, middle and bottom). The slow OPs in this eye were larger in the foveal region than in the nasal or temporal retina and, as described in the previous section, did not exhibit nasotemporal asymmetry.
In Figure 5 (middle), the mfERGs were obtained when the MD was −6.8 dB. The fast OPs were reduced in all locations, whereas the slow OPs were reduced only in the foveal region. With further worsening of the visual sensitivity (MD = −15.3 dB), there was further reduction in the fast OPs at all locations (except T2). To examine the effect of glaucoma on the OP RMS in the whole population studied, the glaucomatous eyes were classified into two groups, based on the MDs: moderate glaucoma (MD = −5 to −10 dB) and severe glaucoma (MD worse than 310 dB). The fast and slow OP RMSs for control versus moderate and severe glaucoma are shown in Figure 6 for the horizontal chevrons.
Figure 6.
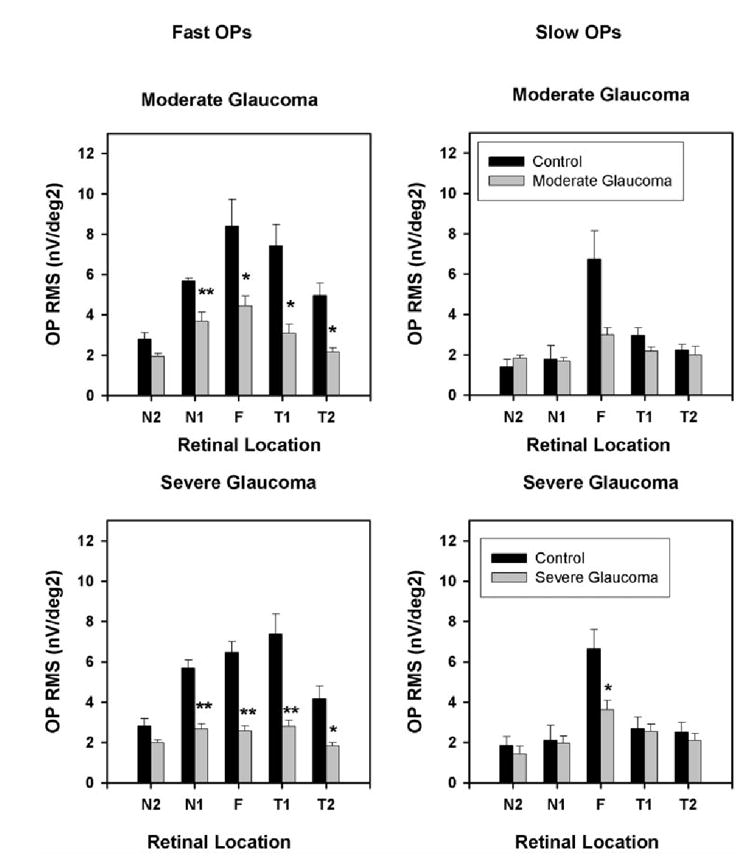
Mean fast (left) and slow (right) OP RMS corresponding to the horizontal five chevrons for control and moderate (top) and control and severe (bottom) glaucoma. The control data were from the left eye of the six monkeys with unilateral glaucoma from the same experimental session and from the left eye before induction of glaucoma in two monkeys with bilateral glaucoma. Error bars, ±1 SEM.
The fast OP RMSs were significantly reduced in both the moderate (P < 0.05, t-test) and severe glaucoma groups (P < 0.01, t-test) in all horizontal locations except in N2. In the vertical chevrons, the fast OPs were significantly reduced in all locations in both moderate and severe glaucoma eyes (P < 0.01, t-test). In contrast, the slow OP RMS was less affected. It was not reduced significantly in any horizontal location except the fovea (P < 0.05) in the severe glaucoma group and in the vertical chevrons, and it was otherwise inconsistent, being reduced significantly in S1 in the moderate glaucoma group (P < 0.05) and in I1 in the severe glaucoma group (P < 0.05, t-test; Table 2).
Table 2.
OP RMS
| Chevrons | Control | Moderate Glaucoma | Control | Severe Glaucoma |
|---|---|---|---|---|
| Horizontal chevrons | ||||
| Fast OPs | ||||
| N2 | 2.8 ± 0.3 | 2.0 ± 0.2 | 2.8 ± 0.4 | 2.0 ± 0.1 |
| N1 | 5.7 ± 0.2 | 3.7 ± 0.5** | 5.7 ± 0.4 | 2.7 ± 0.3** |
| F | 8.4 ± 1.3 | 4.4 ± 0.5* | 6.5 ± 0.5 | 2.6 ± 0.3** |
| T1 | 7.4 ± 1.1 | 3.1 ± 0.5* | 7.4 ± 1.0 | 2.8 ± 0.3** |
| T2 | 5.0 ± 0.6 | 2.2 ± 0.2* | 4.2 ± 0.6 | 1.8 ± 0.2* |
| Slow OPs | ||||
| N2 | 1.4 ± 0.4 | 1.8 ± 0.2 | 1.9 ± 0.4 | 1.4 ± 0.4 |
| N1 | 1.8 ± 0.7 | 1.7 ± 0.2 | 2.1 ± 0.8 | 2.0 ± 0.3 |
| F | 6.8 ± 1.4 | 3.0 ± 0.4 | 6.6 ± 1.0 | 3.6 ± 0.5* |
| T1 | 3.0 ± 0.4 | 2.2 ± 0.2 | 2.7 ± 0.6 | 2.5 ± 0.4 |
| T2 | 2.2 ± 0.3 | 2.0 ± 0.4 | 2.5 ± 0.5 | 2.1 ± 0.4 |
| Vertical chevrons | ||||
| Fast OPs | ||||
| I2 | 4.3 ± 0.5 | 2.3 ± 0.2* | 5.0 ± 0.3 | 2.2 ± 0.2** |
| I1 | 4.6 ± 0.6 | 2.6 ± 0.2* | 5.9 ± 1.0 | 2.1 ± 0.2** |
| S1 | 6.0 ± 0.6 | 2.2 ± 0.2** | 5.9 ± 0.9 | 2.1 ± 0.4** |
| S2 | 4.9 ± 0.5 | 2.1 ± 0.2** | 5.0 ± 0.5 | 1.8 ± 0.1** |
| Slow OPs | ||||
| I2 | 2.4 ± 0.5 | 2.0 ± 0.2 | 3.1 ± 0.5 | 3.0 ± 0.9 |
| I1 | 3.1 ± 0.6 | 2.4 ± 0.3 | 4.1 ± 0.5 | 2.5 ± 0.4* |
| S1 | 2.3 ± 0.3 | 1.5 ± 0.2* | 2.5 ± 0.3 | 2.3 ± 0.4 |
| S2 | 1.4 ± 0.6 | 2.6 ± 0.5 | 1.9 ± 1.0 | 1.9 ± 0.4 |
Data are expressed as the mean ± SE.
P < 0.05.
P < 0.01.
Figure 5B shows the full-field flash ERG obtained during the same experimental session, to track the changes in the PhNR, which is known to be reduced during early changes in glaucoma; and it can be seen, consistent with previous reports,9 that the PhNR was greatly reduced when the MD was −6.8 dB in this example.
Effect of Experimental Glaucoma on OPs in the Horizontal and Vertical Chevrons
Next, we wanted to determine whether there was a relationship between the severity of visual field defects and the OP RMS of the signal at the different retinal locations. In Figure 7, the OP RMS of the signal (open symbols, noise was removed) is plotted as a function of TD expressed as dB (Fig. 7A) and as linear proportion of control in Figure 7B for the horizontal chevrons and foveal region. Because the noise was removed, the dashed horizontal line at the RMS of zero represents the noise level.
In Figure 7A, where the visual sensitivities are expressed in decibels, it is evident that the fast OP RMS for small sensitivity losses was within the value in control eyes (denoted by the single open square with error bars). With the worsening of sensitivity, the fast-OP RMS was reduced, which was found to be true in all locations analyzed along the horizontal retina. The fast-OP RMS approached values close to zero (i.e., the noise level) at end-stage glaucoma, when the visual field sensitivity was poor.
In Figure 7B, the fast OP RMS is plotted as a function of TD expressed as a proportion of the control eye. One obvious result of expressing visual field sensitivity in linear units is the expansion of the axis corresponding to mild visual field defects and the compression of the axis for the more severe field defects. The relation between the OP RMS and localized visual field defects shows a higher correlation and steeper slope in the foveal and temporal retina than in the nasal retina. In all these plots, it can also be seen that at end-stage glaucoma, when presumably most of the retinal ganglion cells have died, the OP RMS reaches values close to zero in all retinal locations analyzed.
In Figure 7C, only the relation between slow OP RMS and the visual field sensitivity expressed as a proportion of the control eye is shown. Unlike the effect of experimental glaucoma on fast OPs, in which the RMS was reduced in all retinal locations tested, the slow OPs showed a good correlation with the visual sensitivity only in the foveal region, not in the other locations, consistent with the observations illustrated in Figure 6 and quantified in Table 2.
Figure 8 shows plots of OP RMS signal as a function of local visual field sensitivity for the vertical retinal locations for the fast (Fig. 8A) and slow (Fig. 8B) OPs. Similar to the finding for the horizontal meridian, the fast OPs showed a moderate correlation with the visual field sensitivity at all locations in the vertically defined regions, whereas the correlation of the slow OP RMS with the visual sensitivity was worse.
Figure 8.
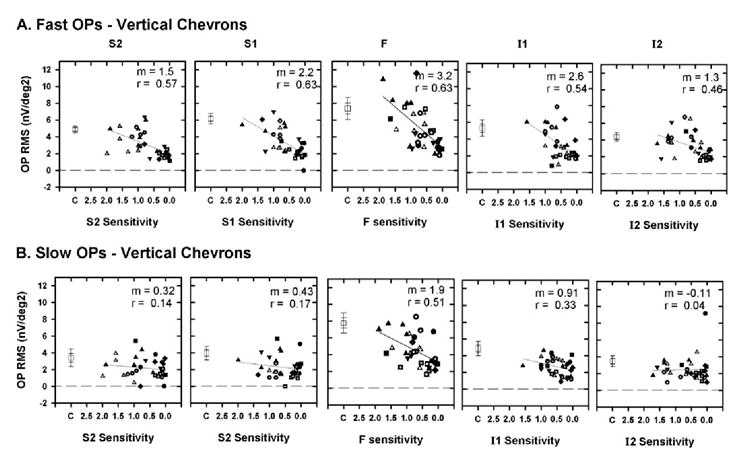
Plot of OP RMS as a function of TD expressed as a proportion of control sensitivity for the vertical chevrons for fast (A) and slow (B) OPs. The plot corresponding to the foveal region (F) and the symbols are as described in Figure 7 and represent the data from different animals. Error bars, ±1 and ±2 SEM.
OP RMS and Ganglion Cell Loss in Experimental Glaucoma
It is generally believed that the major effect of glaucoma on the retina is the death of retinal ganglion cells, as documented in similarly treated monkeys,35 whereas the remainder of the retinal cells survive (but see Ref. 43). We have shown that OPs extracted between 90 and 300 Hz are tetradotoxin (TTX)-sensitive, indicating a role for spiking retinal neurons in their generation. One of the purposes of this study was to determine whether retinal ganglion cells are involved in generating the OPs. Ideally, we wanted to show that there is a relation between the OP amplitude and the ganglion cell density in different retinal locations. In the absence of actual counts of retinal ganglion cells in postmortem histological preparations at each of the different stages of glaucoma in the eight animals in this study, we adopted another approach, in which we estimated the retinal ganglion cell density in each retinal location of interest, using the model described by Harwerth et al.40,41 Figure 9A shows, as an example, a plot of TD for our animals versus predicted ganglion cell density calculated using equations 1 to 3 from Harwerth and Quigley for the retinal coordinates x, y = 15°, 15° in decibels (Fig. 9A, left) and as a proportion of normal ganglion cell density (Fig. 9A, right). The straight line in each plot shows the linear regression between the OP RMS and local GC density in the glaucomatous eyes.
Expressing both TD and GC density as linear values compresses the most severe field defects, expands the mild field defects, and provides a better correlation between OP RMS and visual field defects than with TD expressed as decibels (data not shown). In Figures 9B and 9C, fast OP RMS is plotted as a function of the ganglion cell density expressed as a proportion of control for horizontal and vertical retinal locations, respectively. The ganglion cell density in decibels and linear units was calculated for each chevron and foveal region, using the description in the Methods section. It can be observed from these plots that, in each retinal location examined, the fast OP RMS decreases as the retinal ganglion cell density decreases, approaching zero when the ganglion cell density approaches 0% of the control. The relationship between the fast OP RMS and the ganglion cell density is, of course, similar to the relationship between fast OP RMS and visual field sensitivity shown earlier, because the ganglion cell densities in each location were calculated based on the local visual field sensitivities.
Effect of Experimental Glaucoma on a- and b-Waves of the Slow-Sequence mfERG
In this study, we also investigated whether other major components of the slow-sequence mfERG, specifically the a- and b-waves were affected by experimental glaucoma. Table 3 gives the amplitudes (measured at the implicit time) and implicit times of these components for control and moderate (MD between −5 and −10 dB) and severe (MD worse than −10 dB) glaucoma for the horizontal and vertical chevrons. Even though the amplitude of the b-wave was smaller than that obtained in the control eyes, there was no statistically significant effect of experimental glaucoma on any of these parameters in any retinal location analyzed.
Table 3.
Amplitudes and Implicit Times
| Implicit Time (ms) | Amplitude (nV) | |||||||
|---|---|---|---|---|---|---|---|---|
| Chevrons | Control | Moderate
Glaucoma |
Control | Severe
Glaucoma |
Control | Moderate
Glaucoma |
Control | Severe
Glaucoma |
| Horizontal chevrons | ||||||||
| a-Wave | ||||||||
| N2 | 13.0 ± 1.0 | 13.7 ± 0.5 | 14.1 ± 1.3 | 12.5 ± 2.5 | −13.9 ± 4.3 | −8.4 ± 2.5 | −19.1 ± 5.9 | −13.9 ± 1.5 |
| N1 | 15.6 ± 1.1 | 13.8 ± 0.4 | 15.2 ± 1.0 | 13.5 ± 1.2 | −13.9 ± 5.8 | −11.7 ± 2.1 | −17.9 ± 6.8 | −15.6 ± 2.0 |
| F | 12.0 ± 0.9 | 13.2 ± 0.4 | 12.6 ± 0.8 | 12.7 ± 0.3 | −20.1 ± 3.0 | −20.8 ± 2.3 | −24.8 ± 3.1 | −23.5 ± 2.5 |
| T1 | 13.9 ± 2.2 | 11.9 ± 0.8 | 12.2 ± 1.7 | 14.1 ± 1.5 | −15.3 ± 4.5 | −14.0 ± 2.2 | −20.6 ± 5.0 | −21.9 ± 2.2 |
| T2 | 12.3 ± 3.2 | 13.0 ± 0.6 | 12.3 ± 2.5 | 13.4 ± 1.8 | −17.8 ± 3.7 | −8.7 ± 2.1 | −18.9 ± 3.5 | −11.9 ± 2.7 |
| b-Wave | ||||||||
| N2 | 29.4 ± 1.2 | 25.0 ± 3.0 | 30.0 ± 1.0 | 25.8 ± 3.7 | 23.8 ± 7.2 | 22.6 ± 3.4 | 30.3 ± 6.9 | 23.5 ± 5.5 |
| N1 | 30.7 ± 2.6 | 31.0 ± 0.7 | 30.4 ± 2.0 | 32.5 ± 1.8 | 44.0 ± 4.8 | 32.3 ± 3.7 | 47.9 ± 4.3 | 27.3 ± 3.4 |
| F | 32.5 ± 1.1 | 33.4 ± 1.4 | 31.7 ± 0.9 | 35.5 ± 2.1 | 58.9 ± 13.0 | 49.0 ± 3.7 | 54.3 ± 7.2 | 39.7 ± 3.2 |
| T1 | 30.9 ± 0.9 | 30.2 ± 1.0 | 30.9 ± 1.3 | 32.1 ± 2.4 | 38.7 ± 4.7 | 38.1 ± 3.2 | 48.4 ± 7.6 | 32.6 ± 4.3 |
| T2 | 28.1 ± 1.7 | 28.8 ± 1.3 | 26.8 ± 1.3 | 29.9 ± 2.3 | 34.8 ± 4.2 | 32.1 ± 4.4 | 34.8 ± 5.4 | 37.3 ± 10.0 |
| Vertical chevrons | ||||||||
| a-Wave | ||||||||
| I2 | 10.8 ± 1.2 | 13.0 ± 0.6 | 11.8 ± 1.6 | 12.1 ± 1.9 | −18.2 ± 3.6 | −17.2 ± 2.1 | −25.4 ± 7.3 | −6.1 ± 4.3 |
| I1 | 11.8 ± 1.2 | 12.8 ± 0.4 | 12.3 ± 1.7 | 11.4 ± 0.7 | −9.7 ± 2.7 | −16.7 ± 2.5 | −19.7 ± 3.9 | −17.3 ± 1.8 |
| S1 | 14.1 ± 1.8 | 12.9 ± 1.9 | 14.8 ± 1.8 | 12.2 ± 0.4 | −14.4 ± 4.9 | −12.6 ± 1.8 | −16.9 ± 7.6 | −15.0 ± 2.8 |
| S2 | 14.6 ± 0.8 | 14.0 ± 0.8 | 16.1 ± 1.2 | 12.2 ± 2.9 | −8.1 ± 7.8 | −14.4 ± 2.9 | −14.3 ± 8.3 | −13.4 ± 2.2 |
| b-Wave | ||||||||
| I2 | 28.6 ± 0.9 | 29.0 ± 1.0 | 28.1 ± 0.6 | 28.1 ± 0.8 | 38.9 ± 6.7 | 28.9 ± 2.5 | 48.4 ± 6.4 | 42.5 ± 7.9 |
| I1 | 29.1 ± 0.9 | 31.3 ± 1.4 | 30.2 ± 1.4 | 32.1 ± 2.4 | 43.1 ± 3.1 | 28.9 ± 2.3 | 53.5 ± 6.3 | 30.0 ± 5.0 |
| S1 | 30.2 ± 1.2 | 31.8 ± 1.2 | 29.2 ± 0.8 | 33.0 ± 2.0 | 38.7 ± 6.7 | 27.1 ± 1.8 | 42.4 ± 5.8 | 31.0 ± 4.6 |
| S2 | 28.4 ± 0.8 | 30.0 ± 0.7 | 27.4 ± 1.0 | 30.3 ± 2.0 | 39.9 ± 8.8 | 31.5 ± 3.0 | 41.3 ± 7.2 | 38.1 ± 6.1 |
Data are expressed as the mean ± SE.
Comparison of the OPs and the PhNR in Experimental Glaucoma
This study provided an opportunity to compare three electrophysiological measures—the PhNR of the full field ERG and the fast and slow OPs of the slow-sequence mfERG—the relationship between the measure, and the degree of visual field loss in experimental glaucoma. Figure 10 shows plots of PhNR amplitude (Fig. 10, left), the summed fast OP RMSs (Fig. 10, middle), and the summed slow OP RMS (Fig. 10, right) for the same animals as a function of MD. The PhNR amplitude was reduced below that of the control values, even when the sensitivities were minimally affected, a finding consistent with previous studies.9,11,44 With further worsening of the field defects, there was only a small reduction in the PhNR amplitude. In contrast, the summed fast OP RMS was less affected when sensitivity was hardly altered and correlated better with MD than PhNR amplitude as the losses became progressively worse. The correlation between the slow OP RMS and the MD was poor and shows that the slow OP RMS is not a good indicator, either of early glaucomatous damage, which is better illustrated by the PhNR amplitude, or of progression, which is better indicated by the fast OP RMS.
Figure 10.
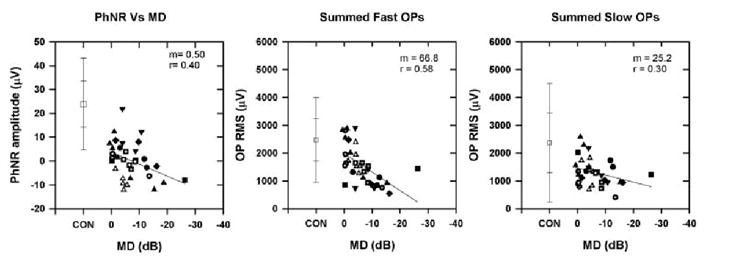
Plot of PhNR amplitude (left), summed fast OP RMS (middle), and summed slow OP RMS (right) as a function of MD recorded from the eight animals with experimental glaucoma at different stages of glaucoma. The symbols are the same as in Figure 7 and represent the different animals. The slope (m) and correlation coefficient (r) are shown at the top of the plots. Error bars, ±1 and ±2 SD.
DISCUSSION
In this study of the slow-sequence ERG in monkeys, experimental glaucoma caused a reduction of the RMS of fast OPs in the frequency range between 110 and 224 Hz (peak at 143 Hz) that was significant, even when field losses were moderate, and decreased as the losses became more severe. Effects on a slower set of OPs in the frequency range between 62 and 105 Hz (peak at 77 Hz) were smaller, with variable effects on the inferior and superior macula, and the main effect on the foveal region. Because ganglion cells die in glaucoma, these results are consistent with a retinal ganglion cell involvement in the generation of the fast OPs of the slow-sequence mfERG. Other possible origins of fast and slow OPs are discussed more fully in the next section on ganglion cell contributions.
Cellular Contributions to the OPs of the Slow-Sequence mfERG
In a previous study with the slow-sequence mfERG, we described OPs extracted for frequencies between 90 and 300 Hz (i.e., these were mainly the fast OPs). We found that their nasotemporal asymmetry was reduced by pharmacological blockade with intravitreally injected TTX.22 It is known that TTX is effective in blocking sodium-dependent spiking activity from amacrine, ganglion, and interplexiform cells,45 although it is possible that some spiking activity comes from certain bipolar cells (in monkey retina46 and in rat retina47). The results of the present study indicate a role for the retinal ganglion cells in the generation of fast OPs.
We also found that the slow OP RMS declined in the foveal region (mainly the temporal portion) in experimental glaucoma, which could suggest a ganglion cell contribution to the slow OPs as well. In our previous study22 we did not examine the effect of TTX on OPs in lower frequency ranges corresponding to the slow OPs. However, Zhou et al. examined the effect of TTX on slow OPs in a similar frequency range and did not find a significant reduction in the slow OPs with TTX (Zhou W et al. IOVS 2005;46:ARVO E-Abstract 3436). This finding raises the possibility that at least some portion of the slow OPs may have an origin from nonspiking retinal ganglion cells or from neurons that do not produce sodium-dependent spikes, although we mainly observed changes consistent with the idea in the temporal macular region.
It is interesting to note that even in the severe glaucoma eyes the fast OP RMS of the signal was never completely eliminated (see Fig. 6), suggesting that retinal ganglion cells are essential for the generation of the fast OPs but may not be the only cells that contribute to them. In our previous study we found that TTX also did not completely eliminate the OPs between 90 and 300 Hz. We also showed in that study that adding N-methyl-d-aspartate (NMDA) after TTX to block inner retinal nonspiking activity reduced these OPs further and that the OPs (90–300 Hz) were completely eliminated by γ-ami-nobutyric acid (GABA) administered to suppress all inner retinal activity. Putting together these findings, we can suggest that the fast OPs are generated by ganglion cells and other inner retinal spiking and nonspiking neurons.
Effect of Experimental Glaucoma on Nasotemporal Asymmetries of the OPs
Investigators in several studies on OPs in which focal and multifocal stimuli were used have described the nasotemporal asymmetries exhibited by OPs with larger OP amplitude in the temporal macula and smaller amplitude in the nasal macula,22-24,26,32 and Fortune et al.32 also reported a reduction in the nasotemporal asymmetry in human glaucoma.
The nasotemporal asymmetry is hypothesized to be produced by alignment of the locally generated retinal component (RC) and the optic nerve head component (ONHC) generated at the optic nerve head causing an augmentation of the OPs in the temporal retina and misalignment of these two components resulting in cancellation or relative reduction in the OPs in the nasal retina.26 In our previous study, we reported that TTX eliminates the nasotemporal asymmetries in the OPs,22 and in the present study we found that experimental glaucoma also results in elimination (even in eyes with moderate sensitivity losses) of the nasotemporal (and superior-inferior) asymmetries of the OPs. The reduction in the asymmetries in experimental glaucoma could be due to the retinal ganglion cells contributing to both the ONHC and locally generated responses (RC).
Effect of Experimental Glaucoma on a- and b-Wave of the Slow-Sequence mfERGs
We looked for effects on the a- and b-wave and, consistent with most other work, on experimental glaucoma in full-field flash ERGs in monkeys or glaucoma in humans, a- and b-waves were not affected. However, some effects have been noted on a-wave in full-field and diffuse flash ERGs when inner retinal spiking responses are blocked with TTX, and in subjects with optic neuropathies.8,48 Further, effects on N1 (decrease in amplitude and an increase in latency) were found in the fast sequence ERG in monkeys with experimental glaucoma,49 as well as after TTX.20
Application to Human Patients
In this study, we found that the slow-sequence mfERG recorded with 7 blank frames in humans have two frequency bands for OPs with ranges similar to those in monkeys with 14 blank frames (Fig. 2A). However, as described in our previous studies, OP amplitudes in monkeys are higher with 14 frames in the slow-sequence mfERG22 and localized signal reduction associated with nerve fiber layer loss are more easily identified.33 Slow-sequence mfERGs recorded from human subjects are quite noisy and have to be repeated many times to obtain an average response with a good signal-to-noise ratio. One alternative is to use a paradigm to enhance the optic nerve head component, as done by Fortune et al.32 Another alternative is to slow the sequence, but to reduce the number of interleaved frames further to three frames, as in Bearse et al.,34 who studied reductions in the OPs recorded with the slow-sequence mfERG in regions corresponding to retinopathy in diabetic patients. The signal-to-noise ratio of the OPs in Bearse et al.34 was further enhanced by adding induced responses to the second-order response. Our preliminary analyses of slow-sequence mfERGs recorded with three frames from control monkeys revealed two OP frequency bands, similar but not identical with those in the present study, suggesting that the 3-frame paradigm could be used in human subjects to examine the effect of glaucoma on the OPs as well. It will be useful to see whether the OPs of the slow-sequence mfERG with 3F can be enhanced34 and to determine the effect of pharmacological blockade and experimental glaucoma on these OPs.
In previous studies, investigators using full-field flash ERGs in patients with glaucoma and monkeys with experimental glaucoma have reported contradictory results, with some reporting a reduction in the OPs in glaucoma and some reporting that the OPs are not affected in glaucoma (e.g., Refs. 35,50,51). The reason for these discrepant findings could be the frequency ranges used in these studies. The present study indicates that restricting the lower limit to at least 100 Hz is advisable for seeing changes in OPs. Other differences in studies included scotopic versus photopic stimuli and the regions of the retina from which the ERGs were recorded. The large effects on the OPs in the photopic slow-sequence mfERG in this study was recorded from the central 17° (radius) of the retina where OPs were large and the effects of experimental glaucoma were very obvious.
In conclusion, although the PhNR amplitude was reduced in early glaucoma and can be used for early detection of glaucoma, the fast OPs were found to be proportional to predicted ganglion cell loss in the locations analyzed, suggesting a role for retinal ganglion cells in the generation of these Ops. The fast OPs may have value for monitoring glaucomatous progression and the effects of treatment.
Acknowledgments
The authors thank Deb K. Mojumder and Hidetaka Maeda for help with the experiments.
Supported by National Eye Institute Grants R01-EY06671 and P30-EY07751.
Footnotes
Disclosure: N.V. Rangaswamy, None; W. Zhou, None; R.S. Harwerth, None; L.J. Frishman, None
References
- 1.Quigley HA. Number of people with glaucoma worldwide. Br J Ophthalmol. 1996;80:389–393. doi: 10.1136/bjo.80.5.389. [DOI] [PMC free article] [PubMed] [Google Scholar]
- 2.Anderson DR. Glaucoma: the damage caused by pressure. XLVI Edward Jackson Memorial Lecture. Am J Ophthalmol. 1989;108:485–495. doi: 10.1016/0002-9394(89)90423-6. [DOI] [PubMed] [Google Scholar]
- 3.Quigley HA, Dunkelberger GR, Green WR. Retinal ganglion cell atrophy correlated with automated perimetry in human eyes with glaucoma. Am J Ophthalmol. 1989;107:453–464. doi: 10.1016/0002-9394(89)90488-1. [DOI] [PubMed] [Google Scholar]
- 4.Harwerth RS, Carter-Dawson L, Shen F, Smith EL, III, Crawford ML. Ganglion cell losses underlying visual field defects from experimental glaucoma. Invest Ophthalmol Vis Sci. 1999;40:2242–2250. [PubMed] [Google Scholar]
- 5.Kerrigan-Baumrind LA, Quigley HA, Pease ME, Kerrigan DF, Mitchell RS. Number of ganglion cells in glaucoma eyes compared with threshold visual field tests in the same persons. Invest Ophthalmol Vis Sci. 2000;41:741–748. [PubMed] [Google Scholar]
- 6.Graham SL, Drance SM, Chauhan BC, et al. Comparison of psychophysical and electrophysiological testing in early glaucoma. Invest Ophthalmol Vis Sci. 1996;37:2651–2662. [PubMed] [Google Scholar]
- 7.Holder GE. Pattern electroretinography (PERG) and an integrated approach to visual pathway diagnosis. Prog Retin Eye Res. 2000;20:531–561. doi: 10.1016/s1350-9462(00)00030-6. [DOI] [PubMed] [Google Scholar]
- 8.Viswanathan S, Frishman LJ, Robson JG. The uniform field and pattern ERG in macaques with experimental glaucoma: removal of spiking activity. Invest Ophthalmol Vis Sci. 2000;41:2797–2810. [PubMed] [Google Scholar]
- 9.Viswanathan S, Frishman LJ, Robson JG, Harwerth RS, Smith EL., III The photopic negative response of the macaque electroretinogram is reduced by experimental glaucoma. Invest Ophthalmol Vis Sci. 1999;40:1124–1136. [PubMed] [Google Scholar]
- 10.Colotto A, Falsini B, Salgarello T, Iorossi G, Galan ME, Scullica L. Photopic Negative response of the human ERG: losses associated with glaucomatous damage. Invest Ophthalmol Vis Sci. 2000;42:2205–2212. [PubMed] [Google Scholar]
- 11.Viswanathan S, Frishman LJ, Robson JG, Walters JW. The photopic negative response of the flash electroretinogram in primary open angle glaucoma. Invest Ophthalmol Vis Sci. 2001;42:514–522. [PubMed] [Google Scholar]
- 12.Drasdo N, Aldebasi YH, Chiti Z, Mortlock KE, Morgan JE, North RV. The s-cone PhNR and pattern ERG in primary open angle glaucoma. Invest Ophthalmol Vis Sci. 2001;42:1266–1272. [PubMed] [Google Scholar]
- 13.Gur M, Zeevi YY, Bielik M, Neumann E. Changes in the oscillatory potentials of the electroretinogram in glaucoma. Curr Eye Res. 1987;6:457–466. doi: 10.3109/02713688709025202. [DOI] [PubMed] [Google Scholar]
- 14.Lan Y, Jian G, Liu Y. The evaluation of oscillatory potentials of the electroretinogram in the early diagnosis of patients with primary open angle glaucoma (in Chinese) Yan Ke Xue Bao. 1996;12:88–92. [PubMed] [Google Scholar]
- 15.Sutter EE. The fast m-transform: a fast computation of cross-correlation with binary m-sequences. Soc Ind Appl Math. 1991;20:686–694. [Google Scholar]
- 16.Sutter EE, Tran D. The field topography of ERG components in man-I: the photopic luminance response. Vision Res. 1992;32:433–466. doi: 10.1016/0042-6989(92)90235-b. [DOI] [PubMed] [Google Scholar]
- 17.Hood DC, Frishman LJ, Saszik S, Viswanathan S. Retinal origins of the primate multifocal ERG: Implications for the human response. Invest Ophthalmol Vis Sci. 2002;43:1673–1685. [PubMed] [Google Scholar]
- 18.Hood DC, Frishman LJ, Viswanathan S, Robson JG, Ahmed J. Evidence for a ganglion cell contribution to the primate electroretinogram (ERG): effects of TTX on the multifocal ERG in macaque. Vis Neurosci. 1999;16:411–416. doi: 10.1017/s0952523899163028. [DOI] [PubMed] [Google Scholar]
- 19.Hood DC, Bearse MA, Sutter EE, Viswanathan S, Frishman LJ. The optic nerve head component of the monkey’s (Macaca mulatta) multifocal electroretinogram (mERG) Vision Res. 2001;41:2029–2041. doi: 10.1016/s0042-6989(01)00010-4. [DOI] [PubMed] [Google Scholar]
- 20.Frishman LJ, Saszik S, Harwerth RS, et al. Effects of experimental glaucoma in macaques on the multifocal ERG: multifocal ERG in laser-induced glaucoma. Doc Ophthalmol. 2000;100:231–251. doi: 10.1023/a:1002735804029. [DOI] [PubMed] [Google Scholar]
- 21.Hood DC, Seiple W, Holopigian K, Greenstein V. A comparison of the components of the multifocal and full-field ERGs. Vis Neurosci. 1997;14:533–544. doi: 10.1017/s0952523800012190. [DOI] [PubMed] [Google Scholar]
- 22.Rangaswamy NV, Hood DC, Frishman LJ. Regional variations in local contributions to the primate photopic flash ERG: revealed using the slow-sequence mfERG. Invest Ophthalmol Vis Sci. 2003;44:3233–3247. doi: 10.1167/iovs.03-0009. [DOI] [PubMed] [Google Scholar]
- 23.Miyake Y, Shiroyama N, Horiguchi M, Ota I. Asymmetry of focal ERG in human macular region. Invest Ophthalmol Vis Sci. 1989;30:1743–1749. [PubMed] [Google Scholar]
- 24.Miyake Y. Macular oscillatory potentials in humans. Doc Ophthalmol. 1990;75:111–124. doi: 10.1007/BF00146547. [DOI] [PubMed] [Google Scholar]
- 25.Wu S, Sutter EE. A topographic study of oscillatory potentials in man. Vis Neurosci. 1995;12:1013–1025. doi: 10.1017/s0952523800006696. [DOI] [PubMed] [Google Scholar]
- 26.Bearse MA, Jr, Shimada Y, Sutter EE. Distribution of oscillatory components in the central retina. Doc Ophthalmol. 2000;100:185–205. doi: 10.1023/a:1002783719958. [DOI] [PubMed] [Google Scholar]
- 27.Heynen H, Wachtmeister L, von Norren D. Origin of the oscillatory potentials in primate retina. Vision Res. 1985;10:1365–1373. doi: 10.1016/0042-6989(85)90214-7. [DOI] [PubMed] [Google Scholar]
- 28.Algvere P, Gjotterberg M. The diagnostic value of oscillatory potentials of the electroretinogram and fluorescein angiography in diabetic proliferative retinopathy. Ophthalmology. 1974;168:97–108. doi: 10.1159/000307027. [DOI] [PubMed] [Google Scholar]
- 29.Speros P, Price J. Oscillatory potentials: history, techniques and potential use in the evaluation of retinal circulation. Surv Ophthalmol. 1981;25:237–252. doi: 10.1016/0039-6257(81)90093-x. [DOI] [PubMed] [Google Scholar]
- 30.Coupland SG. A comparison of oscillatory potentials and pattern electroretinogram measures in diabetic retinopathy. Doc Ophthalmol. 1987;66:207–218. doi: 10.1007/BF00145234. [DOI] [PubMed] [Google Scholar]
- 31.Shimada Y, Li Y, Bearse MA, Sutter EE, Fung W. Assessment of early retinal changes in diabetes using a new multifocal ERG protocol. Br J Ophthalmol. 2001;85:414–419. doi: 10.1136/bjo.85.4.414. [DOI] [PMC free article] [PubMed] [Google Scholar]
- 32.Fortune B, Bearse MA, Cioffi GA, Johnson CA. Selective loss of an oscillatory component from temporal retinal multifocal ERG responses in glaucoma. Invest Ophthalmol Vis Sci. 2002;43:2638–2647. [PubMed] [Google Scholar]
- 33.Fortune B, Wang L, Bang BV, Cull G, Dong J, Cioffi GA. Local ganglion cell contributions to the macaque electroretinogram revealed by experimental nerve fiber bundle defect. Invest Ophthalmol Vis Sci. 2003;44:4567–4579. doi: 10.1167/iovs.03-0200. [DOI] [PubMed] [Google Scholar]
- 34.Bearse MA, Han Y, Schneck ME, Barez S, Jacobsen C, Adams AJ. Local multifocal oscillatory potential abnormalities in diabetes and early diabetic retinopathy. Invest Ophthalmol Vis Sci. 2004;45:3259–3265. doi: 10.1167/iovs.04-0308. [DOI] [PubMed] [Google Scholar]
- 35.Frishman LJ, Shen FF, Du L, et al. The scotopic electroretinogram of macaque after retinal ganglion cell loss from experimental glaucoma. Invest Ophthalmol Vis Sci. 1996;37:125–141. [PubMed] [Google Scholar]
- 36.Dawson WW, Trick GL, Litzkow CA. Improved electrode for electroretinography. Invest Ophthalmol Vis Sci. 1979;18:988–991. [PubMed] [Google Scholar]
- 37.Smith EL, III, Chino YM, Harwerth RS, Ridder WH, Crawford ML, DeSantis L. Retinal inputs to the monkey’s lateral geniculate nucleus in experimental glaucoma. Clin Vis Sci. 1993;8:113–139. [Google Scholar]
- 38.Harwerth RS, Smith EL, III, DeSantis L. Behavioral perimetry in monkeys. Invest Ophthalmol Vis Sci. 1993;34:31–40. [PubMed] [Google Scholar]
- 39.Hood DC, Greenstein VC, Odel JG, et al. Visual field defects and multifocal visual evoked potentials: evidence of a linear relationship. Arch Ophthalmol. 2002;120:1672–1681. doi: 10.1001/archopht.120.12.1672. [DOI] [PubMed] [Google Scholar]
- 40.Harwerth RS, Carter-Dawson L, Smith EL, III, Barnes G, Holt WF, Crawford ML. Neural losses correlated with visual losses in clinical perimetry. Invest Ophthalmol Vis Sci. 2004;45:3152–3160. doi: 10.1167/iovs.04-0227. [DOI] [PubMed] [Google Scholar]
- 41.Harwerth RS, Quigley HA. Visual field defects and retinal ganglion cell losses in human glaucoma patients. Arch Ophthalmol. doi: 10.1001/archopht.124.6.853. In press. [DOI] [PMC free article] [PubMed] [Google Scholar]
- 42.Guide to Statistics, Vol I. S-PLUS 2000. Seattle, WA: Mathsoft Inc; 1999. pp. 340–368. [Google Scholar]
- 43.Nork TM, Ver Hoeve JN, Paulsen GL, et al. Swelling and loss of photoreceptors in chronic human and experimental glaucomas. Arch Ophthalmol. 2000;118:235–245. doi: 10.1001/archopht.118.2.235. [DOI] [PubMed] [Google Scholar]
- 44.Harwerth RS, Crawford ML, Frishman LJ, Viswanathan S, Smith EL, III, Carter-Dawson L. Visual field defects and neural losses in glaucoma. Prog Retin Eye Res. 2002;21:91–125. doi: 10.1016/s1350-9462(01)00022-2. [DOI] [PubMed] [Google Scholar]
- 45.Stafford DK, Dacey DM. Physiology of the A1 amacrine: a spiking axon-bearing interneuron of the macaque monkey retina. Vis Neurosci. 1997;14:507–522. doi: 10.1017/s0952523800012165. [DOI] [PubMed] [Google Scholar]
- 46.Miguel-Hidalgo JJ, Snider CJ, Angelides KJ, Chalupa LM. Voltage-dependent sodium channel alpha subunit immunoreactivity is expressed by distinct cell types of the cat and monkey retina. Vis Neurosci. 1994;11:219–228. doi: 10.1017/s0952523800001589. [DOI] [PubMed] [Google Scholar]
- 47.Pan ZH, Hu HJ. Voltage-dependent sodium currents in the mammalian retinal cone bipolar cells. J Neurophysiol. 2000;84:2564–2571. doi: 10.1152/jn.2000.84.5.2564. [DOI] [PubMed] [Google Scholar]
- 48.Rangaswamy NV, Dorotheo EU, Frishman LJ, Schiffman JS, Bahrani H, Tang RA. Photopic ERGs in patients with optic neuropathies: comparison with primate ERGs after pharmacologic blockade of inner retina. Invest Ophthalmol Vis Sci. 2004;45:3827–3837. doi: 10.1167/iovs.04-0458. [DOI] [PubMed] [Google Scholar]
- 49.Raz D, Perlman I, Percicot CL, Lambrou GN, Ofri R. Functional damage to inner and outer retinal cells in experimental glaucoma. Invest Ophthalmol Vis Sci. 2003;44:3675–3684. doi: 10.1167/iovs.02-1236. [DOI] [PubMed] [Google Scholar]
- 50.Vaegan, Graham SL, Goldberg I, Buckland L, Hollows FC. Flash and pattern electroretinogram changes with optic atrophy and glaucoma. Exp Eye Res. 1995;60:697–706. doi: 10.1016/s0014-4835(05)80011-9. [DOI] [PubMed] [Google Scholar]
- 51.Hare W, Ton H, Ruiz G, Feldman B, Wijono M, Woldemoussie M. Characterization of retinal injury using ERG measures obtained with both conventional and multifocal methods in chronic ocular hypertensive primates. Invest Ophthalmol Vis Sci. 2001;42:127–136. [PubMed] [Google Scholar]