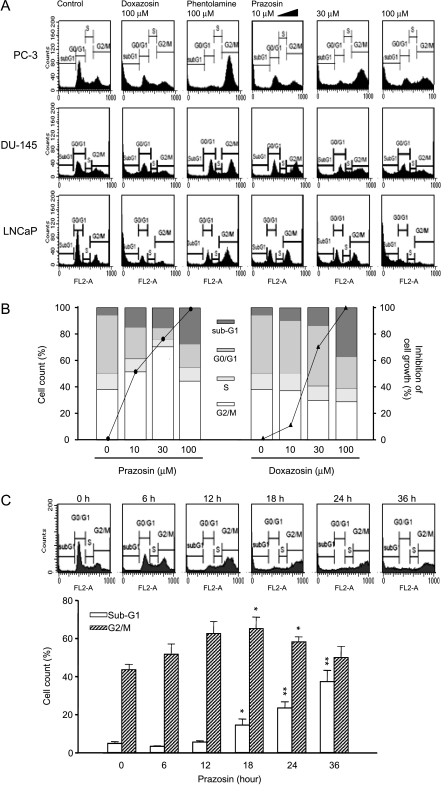
Figure 2.
Effect of α-adrenoceptor antagonists on cell-cycle progression. Cells were treated with the indicated drug at various concentrations for 48 hours. Then the cells were fixed and stained with PI to analyze DNA content by FACScan flow cytometric analysis. Data are representative of three independent experiments (A and B). The inhibition of cell growth by doxazosin and prazosin using SRB assay (solid curves) is demonstrated. The data show that growth inhibition is correlated with the population in G2/M phase in response to prazosin action, but not with PC-3 cells in response to doxazosin action (B). Prazosin (30 µM)-mediated time-dependent change in G2/M phase and sub-G1 population were detected by FACScan flow cytometric analysis in PC-3 cells. Data are expressed as the mean ± SEM of three independent determinations. *P < .05 and **P < .01 compared with the respective controls (zero time) (C).

