

Abstract
Genes involved in the regulation of catecholamine function may be important in obesity because of the role catecholamines play in energy expenditure and lipolysis. To determine if common single nucleotide polymorphisms (SNPs) in β1 (ADRB1), β2 (ADRB2), β3 (ADRB3) and α2a adrenergic receptor (ADRA2A) genes associate with obesity and metabolic alterations, we recruited 74 healthy African American and 161 Caucasian males and females (age: 18–49y) to participate in this case-control genetic association study. Genotypes were determined by PCR and RFLP. Associations between genotype and body mass index (BMI), percent body fat (by measuring skin fold thickness in 7 different sites), fasting (12-hour) plasma glucose, insulin, potassium concentrations, glycated hemoglobin (Hgb AIC) and insulin resistance (homeostasis model assessment score (HOMA-IR)) were performed. Among Caucasians, the ADRB1 Arg389→Gly variant associated with insulin concentrations and HOMAIR: mean ± SD values for insulin and HOMAIR in Arg389 homozygotes and carriers of the Gly were 10 ± 7.0 and 12 ± 9.4 μIU/ml (p=0.02) and 2.1 ± 1.7 and 2.6 ± 2.2 (p=0.057), respectively. Systolic blood pressure was higher in Caucasian for carriers of the ADBR1 Ser49 compared to Gly49 homozygotes 124 ± 12.6 vs. 119 ± 11.3 mm Hg, respectively (p = 0.02). Subsequent analysis revealed that these associations were attributable to a higher BMI among obese participants. The ADRA2A G1780A SNP associated with BMI and percent body fat in African Americans (p=0.05). Interactions were detected between ADRA2A C-1291G and ADRB2 Gln27→Glu variants for obesity in African Americans; and between ADRA2A C-1291G SNP and ADBR1 haplotype for obesity in Caucasians. We conclude that common SNPs in adrenergic receptor genes may be important susceptibility loci for obesity and related alterations. Because of the limited size of our populations, our results should be interpreted with caution and should be replicated in larger populations.
Keywords: association study, obesity, adrenergic receptor polymorphisms, insulin resistance, gene-gene interactions
INTRODUCTION
Obesity is a major health problem in the United States. Sixty-five percent of American adults are overweight, and over 30% are obese 1. It is well accepted that obesity in some but not in all individuals leads to metabolic alterations including hyperinsulinemia and insulin resistance 2, which can lead to the development of Type II diabetes and to cardiovascular diseases and some forms of cancer 3 4 –6. Although rare, obesity syndromes can be caused by mutations in single genes. However, the greatest proportion of obesity involves variants in multiple genes interacting with environmental factors particularly diet 7;8.
Genes that are involved in the regulation of catecholamine function may be important in obesity because of the role catecholamines play in energy expenditure and lipolysis. Fat stored in the body as triglycerides is hydrolyzed to free fatty acids and glycerol through the process of lipolysis 9. Activation of β adrenergic receptors (ADRB) expressed in adipocytes mediate lipolysis 3;10;11 while stimulation of α2 adrenergic receptors (ADRA2) inhibit lipolysis12. Insulin is also an important inhibitor of catecholamine-stimulated lipolysis 13 by reducing the ADBR effects of epinephrine and by activating ADRA2 in adipocytes 14.
Additionally, catecholamine-stimulated whole body lipolysis and lipolysis in subcutaneous adipocytes are blunted in obesity 10;15;16, thereby limiting lipid mobilization and favoring fat accumulation. The mechanisms underlying lipolytic resistance to catecholamines in obesity are not clear and may include desensitization of ADRB2 function 17, increased activity of ADRA and the hyperinsulinemia that accompanies obesity 18;19.
Several mutations in genes encoding ADRA and ADRB have been identified that could alter receptor expression and function. Given the important role that adrenergic receptors play in regulating energy expenditure and lipolysis, it is possible that common genetic polymorphisms in these genes contribute to obesity and to the accompanying metabolic alterations. Numerous studies have reported on the relationship between obesity and genetic variants in adrenergic receptors in different populations with conflicting results 20–22. Few however, have explored associations between adrenergic receptor polymorphisms and obesity and accompanying metabolic alterations in self-identified African Am ericans and Caucasians. In the present study we tested the hypothesis that obesity and metabolic alterations associate with common polymorphisms in adrenergic receptor genes.
METHODS
Study Participants, Outcome Measures
All participants were between the ages of 18 and 49 years old, healthy, non-smokers and were not taking any medications chronically. Body Mass Index (BMI) was calculated from height and weight using the formula: BMI=[Body weight (pounds)/height (inches)2]*704.5. Obesity was defined as a BMI ≥ 30 1. Percent body fat was determined by calculating the mean of 3 measurements of skin fold thickness in 7 different anatomical sites (triceps, biceps, sub scapula, abdominal, suprailiac, thigh and chest), using a Lange Skin fold Caliper (Beta Technology Inc., Cambridge, MD) and equations as previously described 23. All participants were fasted overnight. Systolic and diastolic blood pressures were measured manually with a mercury sphygmomanometer by auscultation using a stethoscope, following a 5-minute period of supine rest. Fasting plasma concentrations of glucose were quantified by the glucose oxidase method with a Glucose Analyzer II (Beckman, Fullerton, CA). Anthropometric measurements were performed by one of two registered nurses. Fasting plasma concentrations of insulin were quantified by RIA (INSULIN RIA, Diagnostics Systems Laboratories, Inc., Webster, TX). Fasted glycated hemoglobin (Hgb AIC) and potassium concentrations were quantified by a Beckman Autoanalyzer Model LX20 (Beckman, Fullerton, CA). Insulin resistance was assessed using the homeostasis model assessment score (HOMA-IR) 24. Studies were performed in the Nemours Children’s Clinic and the University of Florida Shands Jacksonville/SJCHC, Jacksonville, FL, and were approved by the Nemours Children’s Clinic clinical research review committee, Nemours Children’s Clinic and University of Florida institutional review committees. All subjects gave informed written consent prior to entering the study.
Determination of Genotype, Haplotype
The genotype of common single nucleotide polymorphisms (SNP) for the adrenergic receptors was determined by PCR and RFLP. Genomic DNA was extracted from whole blood using a DNA isolation kit (Gentra Systems, Inc., Minneapolis, MN, USA). Primers were synthesized by Operon Technologies, Inc. (Alameda, CA, USA). The restriction enzymes were purchased from New England Biolabs, Inc. (Beverly, MD, USA). The following SNPs were typed for the ADRB1 (NCBI RefSeq: NM_000684): A145G (Ser49→Gly, rs1801252), C1165G (Arg389→Gly, rs1801253); ADRB2 (NCBI RefSeq: NM_000024): T-47C (Cys19→Arg, rs1042711), G46A (Gly16→Arg, rs1042713), C79G (Gln27→Glu, rs1042714); ADRB3 (NCBI RefSeq: NM_000025): T190C (Trp64→Arg, rs4994); ADRA2A (NCBI RefSeq: NM_000681): C-1291G (rs1800544); G1780A (3’UT, rs553668). The first nucleotide in the initiating codon of methionine for translation is referred as nucleotide position +1 in the reference sequences. Because of strong linkage disequilibrium between amino acids 49 and 389 25;26, we inferred the following ADRB1 haplotypes: Ser49/Arg389, Ser49/Gly389, Gly49/Arg389. ADRB2 haplotypes Cys19/Arg16/Gln27, Cys19/Gly16/Gln27 and Arg-19/Gly16/Glu27 were determined as previously described 27. The following primers and restriction enzymes were used in PCR and RFLP for ADRB1 Ser49Gly: forward 5′-GTCCTGGGCGCCTCCGAG-3′/reverse 5′-GATGGCCACGATCACCAGCAC-3′ and Sau96 I; ADRB1 Arg389Gly: forward 5′-CGCTCTGCTGGCTGCCCTTCTTCC-3′/reverse 5′-GGTCTCCGTGGGTCGCGTGG-3′) and BstN I; ADRB3 Trp64Arg: forward 5′-CAATACCGCCAACACCAGTGG-3′/reverse 5′-GGTCATGGTCTGGAGTCTCG-3′ and Msp I; ADRA2A C-1291G: forward 5′-GGAGGTTACTTCCCTCG-3′/reverse 5′-GGTACCTTGAGCTAGAGAC-3′ and Msp I; A1780G: forward 5′-CAGAGCAGCACTGGACTAC-3′/reverse 5′-TGGAAGGCATCTCTCCCAAG-3′ and Dra I
Statistics
We estimated a sample size of 88 obese and 88 non-obese participants to address the hypothesis in this study. This estimate was based on the ADRB2 haplotype frequencies 28, and assuming that the frequency of the Gly16/Glu27 haplotype is 20% higher in obesity compared to non-obese participants. Normal Q-Q plots 29 with tests were used to assess normality of distribution. The data were log-transformed when characteristics departed from normality in African Americans and Caucasians. Hardy-Weinberg equilibria between expected and observed genotype distributions were calculated using Chi-square goodness-of-fit tests. Deviations between observed and expected values with probabilities larger than 10% was accepted as no statistical deviation from H-W equilibrium. Linkage disequilibrium (LD) 30 was assessed by comparing expected and observed haplotype distributions, and analyzed by Haploview32. The statistical significance of the estimated LD was tested by converting LOD score into an equivalent chi-squared statistic using one degree of freedom.
The prevalence of obesity by gender and race were compared using Fisher’s exact test 31. Non-parametric Spearman correlation coefficients 32 between BMI and metabolic characteristics were calculated based on ranking the two variables. Metabolic characteristics were compared between non-obese and obese participants, of which Student’s unpaired t-test was used for continuous variables with normal distribution including body fat, Hgb A1C, systolic blood pressure, and diastolic blood pressure; nonparametric method, Mann-Whitney test, was used for data that are significantly skewed including BMI, potassium, glucose, insulin, and insulin resistance.
Frequency distributions of SNP genotypes and haplotypes between African Americans and Caucasians were compared by x2 test. General linear models 33 were used to assess qualitative and quantitative explanatory variables at the same time. Assuming a general linear model, logarithmic transformation was used to normalize the distributions of BMI, plasma potassium, glucose, insulin, and insulin resistance. The linear model was applied in all associations between the genetic variants with metabolic and clinical responses. Percentage of body fat and BMI were adjusted for age and sex; all other metabolic and clinical characteristics including potassium, glucose, insulin, Hgb A1c, insulin resistance were also adjusted for percentage of body fat.
To estimate the risk of obesity associated with candidate SNPs, odds ratios were calculated. Crude odds ratios were calculated by dividing the odds in the exposed group by the odds in the control group. Adjusted odds ratios for the risk of obesity were calculated by logistic regression model with adjustment of age and sex 31. For each odds ratio, two-tailed p-vale and 95% confidence interval (CI) were estimated. Statistical significance was made at a cutoff value of P-value<0.10 for screening risk factors 34. Analysis of covariance was applied in associations between the numbers of haplotype copies and BMI adjusted for age and sex 33. Chi-square test was used for testing obese prevalence differences between the numbers of haplotype copies. A general linear model with covariates of age and sex was used to assess interactions between ADRA and variants of ADRB1 and ADRB2. All analyses were performed in SPSS. P values < 0.1 were considered significant.
RESULTS
Participants
A total of 238 subjects participated in the study; 161 were self-identified Caucasians (7 Hispanic, 154 non-Hispanic), 74 were African Americans and the remaining participants were either Indian (2) or Asian (1). Because of the small numbers of Indians and Asians, analyses were performed on 235 participants; 161 self-identified Caucasians (72.7% female) and 74 African Americans (80% female). Mean ± SD age for African Americans and Caucasians were: 30 ± 8.7 vs. 30 ± 8.0 years, respectively (p = 0.63). Among African American, BMI and % body fat were higher compared to Caucasians: 33 ± 7.8 vs. 29 ± 7.5 kg/m2 (p=0.001); and 36 ± 8.2 vs. 32 ± 10 %, respectively (p =0.008). Among Caucasians 36% were classified as obese, compared to 61% in African Americans.
Table 1 compares anthropometric, metabolic and other characteristics by ethnicity. For African Americans and Caucasians, BMI, percent body fat, insulin concentrations and values for HOMAIR were higher among obese individuals compared to non-obese. For Caucasians, resting glucose concentrations, HgbAIC and systolic blood pressure were higher in obese participants compared to non-obese. Among African Americans, diastolic blood pressure was higher in obese compared to non-obese individuals. For African Americans, glucose concentrations and Hgb AIC were similar between obese and non-obese individuals.
Table 1.
Comparison of means ± SD for anthropometric measures and metabolic characteristics by ethnicity and body weight designation.
| Measurement | Caucasians | African Americans | ||||||||
|---|---|---|---|---|---|---|---|---|---|---|
| obese | normal | p | Obese | normal | p | |||||
| n | x̄ ± sd | n | x̄ ± sd | n | x̄ ± sd | n | x̄ ± sd | |||
| BMI(Kg/m2) | 58 | 37.02 ± 5.73 | 103 | 24.24 ± 3.26 | <0.0001 | 45 | 37.26 ± 6.07 | 28 | 25.27 ± 3.33 | <0.0001 |
| Body Fat (%) | 58 | 40.30 ± 6.65 | 101 | 27.59 ± 7.73 | <0.0001 | 44 | 40.33 ± 5.26 | 28 | 28.52 ± 6.73 | <0.0001 |
| Potassium (meq/ml) | 55 | 4. 38 ± 0.57 | 98 | 4. 37 ± 0.49 | 0. 959 | 45 | 4.17 ± 0.23 | 28 | 4.25 ± 0.53 | 0.522 |
| Glucose (mg/dl) | 55 | 87.27 ± 10.40 | 99 | 82.23 ± 9.14 | 0.015 | 45 | 86.13 ± 12.66 | 28 | 84.32 ± 11.11 | 0.364 |
| Insulin (uIU/ml) | 54 | 15.52 ± 10.16 | 98 | 9.48 ± 10.81 | <0.0001 | 45 | 13.72 ± 7.94 | 28 | 8.44 ± 6.75 | 0.001 |
| Hgb AIC (%) | 51 | 5. 35 ± 0.46 | 91 | 5.12 ± 0.41 | 0.002 | 40 | 5.51 ± 0.49 | 26 | 5.42 ± 0.46 | 0.464 |
| HOMA IR | 54 | 3.46 ± 2.62 | 98 | 1. 91 ± 2.04 | <0.0001 | 45 | 2.99 ± 1.88 | 28 | 1.80 ± 1.68 | 0.001 |
| Systolic | 58 | 123. 95 ± 10.58 | 103 | 118. 30 ± 11.99 | 0.003 | 44 | 123 ± 13.78 | 27 | 119.30 ± 12.23 | 0.215 |
| Diastolic | 58 | 76.50 ± 8.50 | 103 | 74.29 ± 9.08 | 0.132 | 44 | 78.00 ± 10.01 | 27 | 73.19 ± 8.21 | 0.039 |
Student t test was used for variables of body fat, Hgb A1C, systolic blood pressure, and diastolic blood pressure; Mann-Whitney U test was used for BMI, potassium, glucose, insulin, and HOMA IR.
Relation between BMI and Metabolic Characteristics
Glucose, insulin, HOMAIR and HA1c were related to BMI in both African Americans and Caucasians (Figure 1). The relationship between glucose concentrations and BMI was weak with an R2 value of 0.018 (p = 0.045). Insulin concentrations and HOMAIR values were more strongly related with obesity with R2 values of 0.14 (p < 0.0001) and 0.18 (p<0.0001), respectively (Figure 1), demonstrating increased insulin resistance at normal glucose concentrations. Blood pressure was weakly associated with BMI: the R2 values for systolic and diastolic blood pressures were 0.046 (p=0.001) and 0.018 (p = 0.037), respectively. Systolic and diastolic blood pressures were not associated with age (p = 0.21 and 0.36, respectively (data not shown)).
Figure 1.
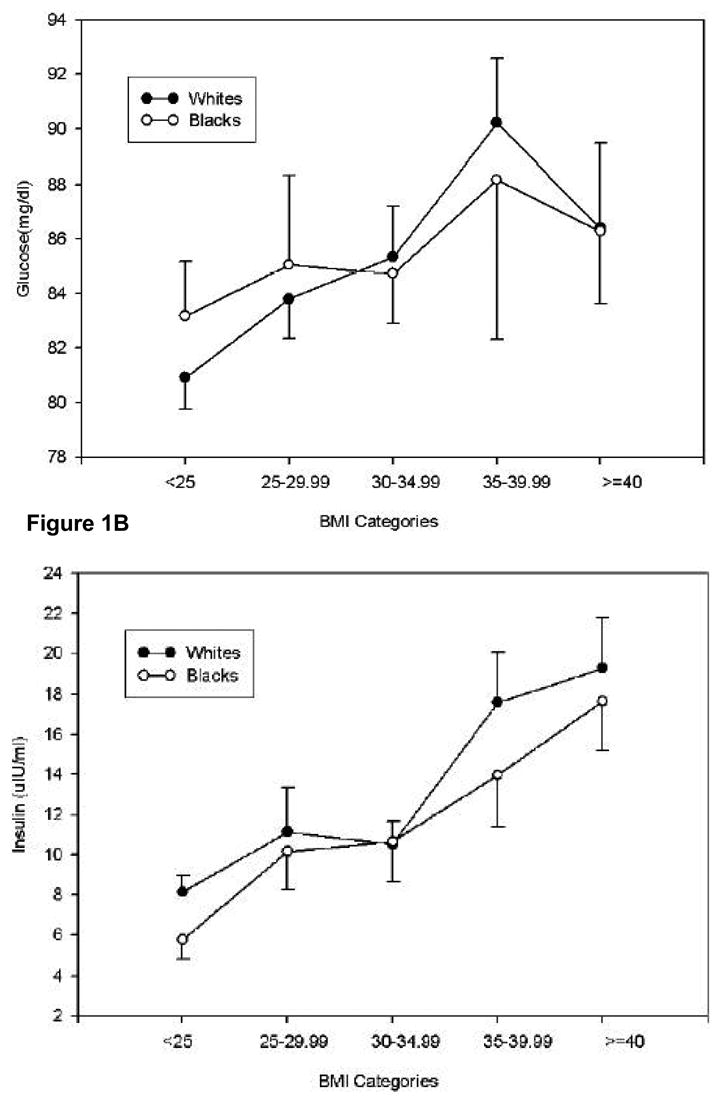
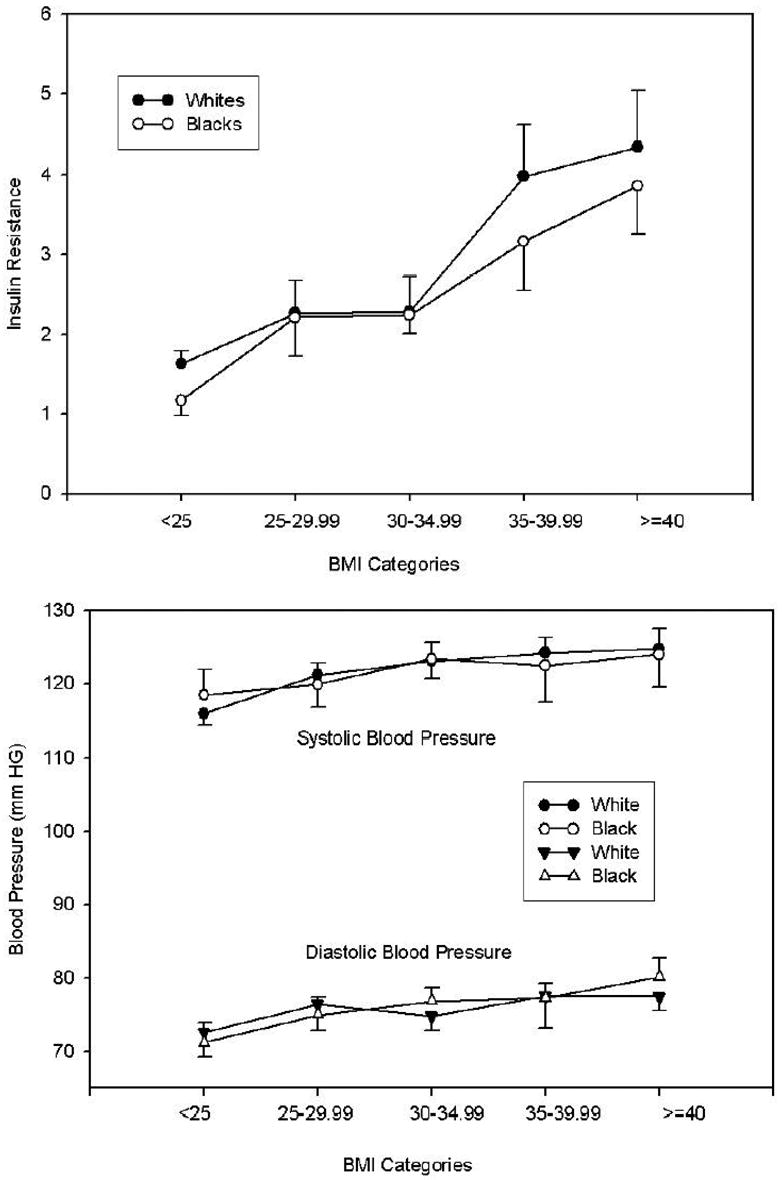
Relationship between mean ± SD fasting glucose concentrations (A), insulin concentrations (B), insulin resistance (C) as determined by HOMAIR and blood pressure (D) as a function of BMI in self-identified Caucasians and African Americans.
Genotype, Haplotype Frequencies
A high rate of genotyping (> 98%) was achieved for all SNPs, which were in Hardy-Weinberg equilibrium when assessed by ethnicity except for the ADBR2 Gly16→Arg variant in Caucasians (data not shown). The ADRB2 SNPs Cys19→Arg and Gln27→ Glu27 were in complete linkage disequilibrium (LD). ADRB1 SNPs Ser49→Gly and Arg389→Gly; ADRB2 SNPs amino acids Gln27→ Glu27; and Gly16→Arg and Gln27→Glu; and ADRA2A SNPs C–1291G and G→1780A were in tight LD (data not shown). Table 2 compares genotype frequencies of the 8 adrenergic receptor SNPs between 2 ethnic groups. Ethnic differences for genotype frequencies were found for ADRB1 (Ser49→Gly), ADRB2 (Cys19→Arg; Gln27→Glu) and the ADRA2A (C-1291G) SNPs. Ethnic differences were also noted for ADRB1 and ADRB2 haplotype frequencies (Table 3).
Table 2.
Adrenergic receptor polymorphism genotype frequencies in African American and Caucasian subjects.
| SNPs | Genotype | Frequency (%) | Pearson Chi-Square | P-value | |
|---|---|---|---|---|---|
| African American | Caucasian | ||||
| ADRB1 Codon 49 | A/A | 44 (59.5) | 120(75.0) | 7.440 | 0.02 |
| G/A | 25 (33.8) | 37(23.1) | |||
| G/G | 5 (6.8) | 3 (1.9) | |||
| ADRB1 Codon 389 | C/C | 30 (40.5) | 85 (53.1) | 3.614 | 0.16 |
| C/G | 35 (47.3) | 63 (39.4) | |||
| G/G | 9 (12.2) | 12(7.5) | |||
| ADRB2 5′ LC-19 | CC | 4 (5.4) | 31(19.4) | 15.91 | <0.0001 |
| TC | 22 (29.7) | 67(41.9) | |||
| TT | 48 (64.9) | 62(38.8) | |||
| ADRB2 Codon 16 | CC | 12 (16.2) | 33(20.6) | 4.808 | 0.09 |
| GC | 39 (52.7) | 60(37.5) | |||
| GG | 23 (31.1) | 67(41.9) | |||
| ADRB2 Codon 27 | CC | 48 (64.9) | 62(38.8) | 15.905 | <0.0001 |
| GC | 22 (29.7) | 67(41.9) | |||
| GG | 4 (5.4) | 31(19.4) | |||
| ADRB3 | CC | 3 (4.2) | 2 (1.3) | 3.454 | 0.18 |
| TC | 15 (20.8) | 23(14.7) | |||
| TT | 54 (75) | 131(84.0) | |||
| Alpha 2A C-1291G | CC | 10 (13.7) | 85(53.5) | 39.827 | <0.0001 |
| CG | 37 (50.7) | 58(36.5) | |||
| GG | 26 (35.6) | 16(10.1) | |||
| Alpha 2A A2659G | AA | 4 (5.5) | 8(5.0) | 5.470 | 0.07 |
| AG | 29 (39.7) | 40(25.0) | |||
| GG | 40 (54.8) | 112(70.0) | |||
Table 3.
Haplotype frequencies for ADRB1 and ADRB2 in African American and Caucasian subjects
| Gene | Haplotype | Frequency | P value | |
|---|---|---|---|---|
| African American (%) | Caucasian (%) | |||
| ADRB1 | Gly49-Arg389 | 35(23.6) | 43(13.4) | <0.0001 |
| Ser49-Arg389 | 60(40.5) | 194(60.6) | ||
| Ser49-Gly389 | 53(35.8) | 83(25.9) | ||
| ADRB2 | 5′LCCys19-Gly16-Gln27 | 55(37.2) | 65(20.3) | <0.0001 |
| 5′LCCys19-Arg16-Gln27
5′LCArg19-Gly16-Glu27 |
64(43.2)
29(19.6) |
126(39.4)
129(40.3) |
||
Genetic Association Analyses
Among Caucasians, significant associations were found for the ADRB1 Arg389→Gly variant and insulin concentrations and HOMA-IR (Figure 2; table 4): mean ± SD values for insulin and HOMA-IR in Arg389 homozygotes and carriers of the Gly were 10 ± 7.0 and 12 ± 9.4 μIU/ml (p=0.02) and 2.1 ± 1.7 and 2.6 ± 2.2 (p=0.057), respectively, at similar values for BMI, percent body fat and glucose concentrations. When we stratified by BMI (obese < 30 kg/m 2 vs. non-obese ≥ 30 kg/m2), the associations between ADRB1 Arg389→Gly variant and insulin and HOMAIR were lost (Table 4). However, among obese participants, BMI was significantly higher in carriers of the Gly allele compared to Arg389 homozygotes: 39 ± 6.5 vs. 35 ± 4.0; p = 0.018, suggesting that the association between the Arg389→Gly genotype and insulin and insulin resistance (Figure 2) was attributable to the higher BMI among carriers of the Gly16 allele. Systolic blood pressure was higher in Caucasians for carriers of the ADBR1 Gly49 compared to Ser49 homozygotes: 124 ± 12.6 vs. 119 ± 11.3 mm Hg, respectively, p= 0.023. For non-obese participants, systolic blood pressures in Ser49 homozygotes (n=74) and carriers of the Gly (n=28) were 117 ± 11 and 122 ± 14, respectively; p = 0.19. For obese participants, systolic blood pressures in Ser49 homozygotes (n=45) and carriers of the Gly (n=12) were 123 ± 11 and 129 ± 8.9, respectively, p= 0.088.
Figure 2.
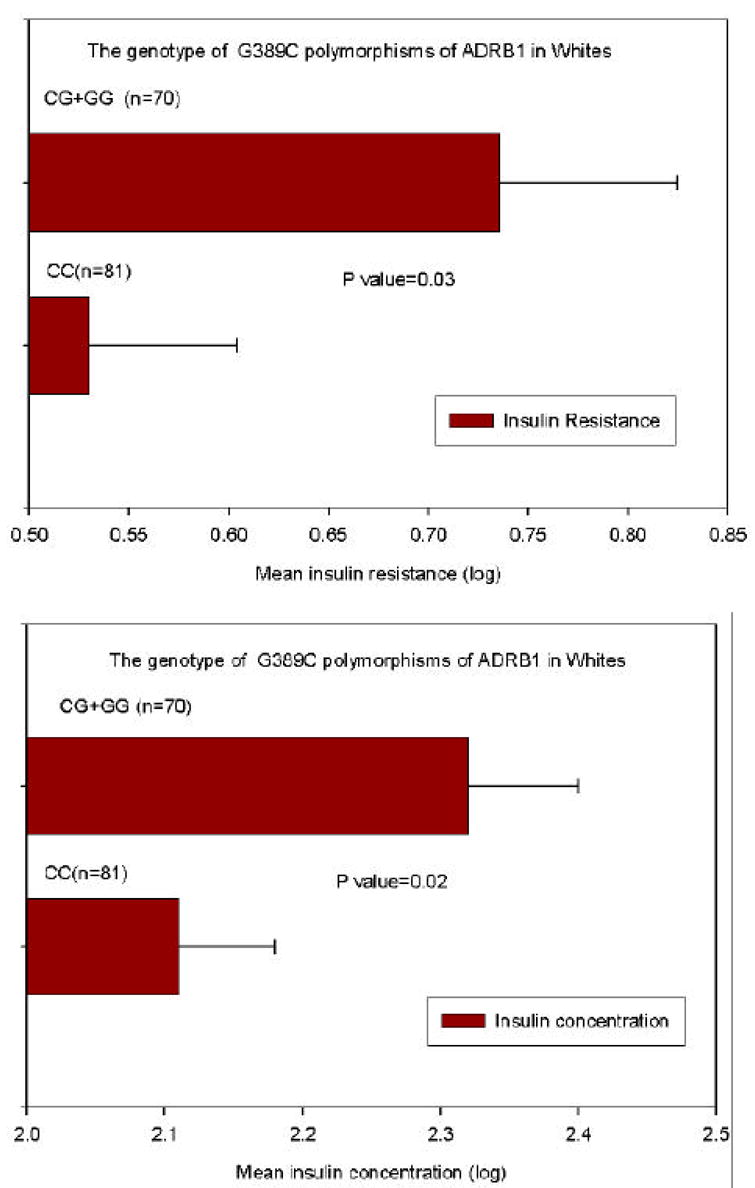
Influence of the ADRB1 Arg389→Gly (G1165C) polymorphism on insulin resistance and insulin concentrations in Caucasians. Insulin concentrations and values for HOMAIR were log transformed; means ± SE were determined and tested by t-test in Arg389 homozygotes and Gly389 carriers.
Table 4.
Comparison of mean ± SD BMI, insulin and insulin resistance (by HOMAIR) by ADRB1389 genotype among obese and non-obese Caucasians.
| Measurement (white) | ADRB1codon389(x̄ ± sd)/n | |||
|---|---|---|---|---|
| CC | CG+GG | P | ||
| BMI(Kg/m2) | 27.97 ± 6.04
N=85 |
29.63 ± 8.72
N=75 |
0.29 | |
| Insulin (Uiu/ml) | 9.99 ± 6.96
N=81 |
12.28 ± 9.36
N=69 |
0.041 | |
| BMI (Kg/m2) | Non-obese | 24.41 ± 3.11
N=56 |
24.04 ± 3.45
N=47 |
0.70 |
| obese | 34.86 ± 3.99
N=29 |
39.02 ± 6.48
N=28 |
0.018 | |
| Insulin (uIU/ml) | Non-obese | 7.77 ± 3.35
N=54 |
9.50 ± 7.24
N=43 |
0.102 |
| obese | 14.43 ± 9.78
N=27 |
16.87 ± 10.71
N=26 |
0.33 | |
| HOMA | 2.13 ± 1.72
N=81 |
2.63 ± 2.24
N=69 |
0.057 | |
| HOMA | Non-obese | 1.59 ± 0.69
N=54 |
1.93 ± 1.47
N=43 |
0.15 |
| obese | 3.20 ± 2.52
N=27 |
3.78 ± 2.78
N=26 |
0.34 | |
Among African Americans, there was a significant gene dose-response relationship for the ADRA2A G1780A genotype with both BMI and percent body fat (Figure 3). Compared to carriers of the ADRB2 Glu27 (n=25), Gln27 homozygotes (n=48) had higher insulin concentrations: 12.3 ± 8.0 vs. 10.6 ± 7.7, p = 0.056; and were more insulin resistant as determined by HOMOIR: 2.7 ± 2.0 vs. 2.2 ± 1.8, p = 0.06. There were no significant associations between the genotype of the ADRB3 Trp64→Arg SNP and anthropometric measures or metabolic characteristics in Caucasians or African Americans (data not shown).
Figure 3.
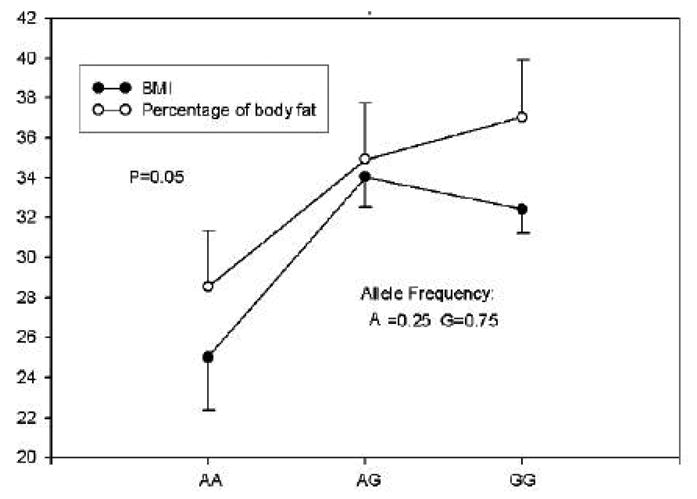
Mean ± SE of BMI and percentage of body fat by ADRA2A A1780G genotypes in African Americans
Gene-Gene Interactions
Among Caucasians there was a significant interaction for BMI between ADRB1 haplotype and ADRA2A C-1291G SNP (p=0.038): 5 participants with the Ser49-Arg389/Ser49-Gly389 diplotype and C1291G G homozygous genotype had the highest BMI: 39.4 ± 9.73 kg/m2. Among African Americans, there was a significant interaction between the ADRB2 Gln27→Glu variant and the ADRA2A C-1291G SNP, p =0.010: 6 participants who were homozygous for Gln27 and homozygous for the C-1291 SNPs had the highest BMI compared to other combinations: 38.8 ± 5.98 kg/m2.
Discussion
Obesity is a common complex disease that involves multiple genetic variants interacting with environmental and behavioral factors. Genes involved in the regulation of catecholamine function may be important in obesity because of the role catecholamines play in energy expenditure and lipolysis. Stimulation of ADRB increases lipolysis, which favors weight reduction, whereas ADRA2A inhibits lipolysis, which favors weight gain. In the present study we hypothesized that common SNPs in ADRB and ADRA2A associate with obesity and accompanying metabolic alterations. The results of our study demonstrate that common SNPs in ADRB and ADRA2A genes may contribute to obesity and to metabolic alterations in young healthy Caucasians and African Americans, although in a complex manner. Among Caucasians, genotype (and haplotype) of ADRB and ADRA2A SNPs contributed little or not at all to obesity, which is in keeping with previous studies in older adult women 26 and children 35, though in an earlier study, the Arg389 variant was weakly associated with obesity in older adult women (0.86 kd/m2/Arg allele) 36. In the present study, Caucasian carriers of the ADRB1 Gly389 (heterozygotes and Gly homozygotes) had higher insulin concentrations and were more insulin resistant compared to Arg389 homozygotes (Figure 2) at similar BMI and percent body fat values. To determine what drove this association, we stratified our cohort by obesity status, and found that among obese participants (BMI ≥ 30 kg/m2), BMI was significantly higher among Gly389 carriers compared to Arg389 homozygotes (Table 4). These data suggest that the association we found between the Gly389 variant and insulin resistance may, at least in part, be attributed to the higher BMI in this genotype. We therefore conclude that the ADRB1 Arg389→Gly polymorphism contributes to obesity and to accompanying metabolic alterations in young healthy Caucasians.
The functional basis underlying the association between the ADRB1 Arg389→Gly variant with obesity and metabolic alterations may be related to the pivotal role the sympathetic nervous system (SNS) plays in obesity. Previous studies have reported that compared to the Gly389, the Arg389 form of the ADRB1 mediated a higher isoproterenol-stimulated adenylyl cyclase activity and greater coupling 37, demonstrated a greater inotropic response to stimulation 38, and was more responsive to beta blockade 25, though several studies report no differences between the two variants for several phenotypes (see ref21). It has been hypothesized that SNS underactivity could lead to an inadequate thermogenic response to overeating, positive energy balance and weight gain 39. Alternatively, SNS activation that occurs with chronic overeating can lead to enhanced sympathetic stimulation 39;40. Our finding is consistent with the former hypothesis as the Gly389 variant is the less active form of the ADBR1. Whatever the mechanism, it apparently does not involve lipolysis since lipolytic response to ADRB1 stimulation in human adipocytes did not differ by amino acid 389 variants 41.
Among Caucasians, we found that carriers of the ADRB1 Gly49 had higher systolic blood pressures compared to Arg49 homozygotes. Although we did not find associations between BMI or percent body fat with Ser49→Gly variant in obese vs. non-obese participants, among obese individuals carrying the Gly49, systolic blood pressure was 6 mm Hg higher compared to obese Ser49 homozygotes (p = 0.088). These data suggest that the higher systolic blood pressure we observed in carriers of the Gly49 was driven by the higher BMI. These data are consistent with the study by Linne et al 42 who reported that the Gly49 was associated with long-term weight gain in women. In in-vitro studies the Gly49 variant demonstrated higher basal and agonist-stimulated adenylyl cyclase activity compared to the Ser49 43, and the Gly49 was down-regulated to a greater extent by continuous agonist exposure 43;44. It is possible that increased sympathetic tone contributes to elevations in blood pressure in the obese state 40, which are consistent with our findings.
Among African Americans, we found a weak association between ADRB2 Gln27→Glu and insulin: Gln27 homozygotes tended to have slightly higher insulin concentrations and were slightly more insulin resistant. The ADRB2 gene is highly polymorphic 45. In studies of human adipocytes, the Glu27 variant has been associated with reduced lipolytic activity compared to the Gln27 46. Our results are not consistent with these studies. However, the results of several association studies of common SNPs (genotype and haplotype) with obesity, diabetes and other common complex diseases are conflicting 21. Taken together, and given the small numbers of African Americans in our study, the relevance of this finding is not clear.
Our data suggest that the ADRA2A gene may play an important role in obesity (Figure 3). The ADRA2A gene is located on chromosome 10q24-q26, is intronless and highly polymorphic 47. The C -1291G SNP is located in the promoter or enhancer region with the G allele having frequencies of 0.27 and 0.67 in Caucasians and African Americans, respectively. The G1780A SNP is located in the 3’ UTR with the A allele having frequencies of 0.17 and 0.31, respectively 47. In our study, the allele frequencies for the G-1291 allele in Caucasians and African Americans were 0.28 and 0.61, respectively; for the A1780 SNP the allele frequencies were 0.18 and 0.25, respectively. These ADRA2A variants were selected because associations with the G1780A SNP and hypertension in African Americans 48, with obesity in Caucasians 49;50, and with endurance in Caucasian athletes have been reported 51. The C -1291G SNP has been associated with changes in glucose and diastolic blood pressure in response to dexamethasone 52. In the present study, the G1780 allele was associated with obesity and percent body fat among African Americans. Moreover, we found evidence of interactions between ADRA2A and ADRB1 genes among Caucasians and, and ADRA2A and ADRB2 genes among African Americans with obesity. These data support a complex and important role for adrenergic receptor variants in obesity and the accompanying metabolic alterations, and agree with a study by Ukkola et al. 53 that interactions among ADRA2A and ADRB genes contribute to obesity related phenotypes. In the future, large studies should explore interactions for genes that regulate catecholamine-mediated effects on energy expenditure.
The epidemic of obesity in this country and world-wide has led to a marked increase in the incidence of metabolic syndrome, which is variably defined as a constellation of metabolic abnormalities including glucose intolerance (type 2 diabetes), insulin resistance, central obesity (BMI ≥ 30 kg/m2) dyslipidemia and hypertension (blood pressure ≥ 130/85 mm Hg) 54. The mechanism(s) underlying the development of the metabolic syndrome is not clear, but is thought to be largely attributable to insulin resistance with an excessive flux of fatty acids and the involvement of the proinflammatory state 55. Although none of the obese individuals in our study could be characterized as having type 2 diabetes or metabolic syndrome, some but not all had higher concentrations of glucose and insulin, insulin resistance as assessed by HOMAIR, and elevated Hgb AIC and blood pressures, compared to non-obese individuals (Table 1, Figure 1). It is likely that many of these participants, if left untreated (i.e., life-style modifications) would go on to develop type 2 diabetes, metabolic syndrome and cardiovascular and other diseases. A few studies support a genetic basis for metabolic syndrome including the ADRB2 Gly16→Arg and the Gln27→Glu variants 56 and others 57. It is in this context that our findings that common SNPs in the ADRB and ADRA genes may associate with hyperinsulinemia, insulin resistance and elevated systolic blood pressures portend significant clinical relevance.
We have uncovered several intriguing associations between common SNPs in ADRB2A and ADRB genes with obesity and related alterations. However, the present study has several limitations. Many gene variants contribute to obesity and related alterations and those in ADRA2A and ADRB may have modest effects thus requiring large sample sizes to detect associations 58. Our sample size was small, and it is possible that the associations we observed between ADRA2A and ADRB SNPs with obesity could represent false positives. Because of the potential for population stratification 59, we stratified our population by self-identified ethnicity, which further exacerbates our problems with small numbers. In addition, our findings are further confounded by the fact that 73% and 80% of our Caucasian and African American population was female even though we adjusted for sex in our analyses. We did not correct for multiple hypothesis testing, which could also contribute to false positive associations 58. We chose not to adjust for multiple comparisons because given the small numbers of participants; we reasoned that it is important not to dismiss differences that could be real. For these reasons, the results of our study should be interpreted with caution and should regarded as exploratory, and underscore the need for replication in larger populations.
Acknowledgments
This work was supported by NIH grant R03DK57734
Footnotes
Publisher's Disclaimer: This is a PDF file of an unedited manuscript that has been accepted for publication. As a service to our customers we are providing this early version of the manuscript. The manuscript will undergo copyediting, typesetting, and review of the resulting proof before it is published in its final citable form. Please note that during the production process errors may be discovered which could affect the content, and all legal disclaimers that apply to the journal pertain.
Reference List
- 1.Flegal KM, Carroll MD, Ogden CL, et al. Prevalence and trends in obesity among US adults, 1999–2000. JAMA. 2002;288:1723–1727. doi: 10.1001/jama.288.14.1723. [DOI] [PubMed] [Google Scholar]
- 2.Despres JP, Mareette A. Obesity and insulin resistance epidemiologic, metabolic, and molecular aspects. In: Reaven G, Laws A, editors. Contemporary Endocrinology: Insulin Resistance. Totowa: Humana Press, Inc; 1999. pp. 51–81. [Google Scholar]
- 3.Haffner CA, Kendall MJ, Maxwell S, et al. The lipolytic effect of beta 1- and beta 2-adrenoceptor activation in healthy human volunteers. Br J Clin Pharmacol. 1993;35:35–39. doi: 10.1111/j.1365-2125.1993.tb05667.x. [DOI] [PMC free article] [PubMed] [Google Scholar]
- 4.Govindarajan G, Whaley-Connell A, Mugo M, et al. The cardiometabolic syndrome as a cardiovascular risk factor. Am J Med Sci. 2005;330:311–318. doi: 10.1097/00000441-200512000-00009. [DOI] [PubMed] [Google Scholar]
- 5.Baillargeon J, Rose DP. Obesity, adipokines, and prostate cancer (review) Int J Oncol. 2006;28:737–745. [PubMed] [Google Scholar]
- 6.Gunter MJ, Leitzmann MF. Obesity and colorectal cancer: epidemiology, mechanisms and candidate genes. J Nutr Biochem. 2006;17:145–156. doi: 10.1016/j.jnutbio.2005.06.011. [DOI] [PubMed] [Google Scholar]
- 7.Loos RJ, Bouchard C. Obesity--is it a genetic disorder? J Intern Med. 2003;254:401–425. doi: 10.1046/j.1365-2796.2003.01242.x. [DOI] [PubMed] [Google Scholar]
- 8.Loos RJ, Rankinen T. Gene-diet interactions on body weight changes. J Am Diet Assoc. 2005;105:S29–S34. doi: 10.1016/j.jada.2005.02.015. [DOI] [PubMed] [Google Scholar]
- 9.Coppack SW, Jensen MD, Miles JM. In vivo regulation of lipolysis in humans. J Lipid Res. 1994;35:177–193. [PubMed] [Google Scholar]
- 10.Large V, Arner P. Regulation of lipolysis in humans. Pathophysiological modulation in obesity, diabetes, and hyperlipidaemia. Diabetes Metab. 1998;24:409–418. [PubMed] [Google Scholar]
- 11.Barbe P, Millet L, Galitzky J, et al. In situ assessment of the role of the beta 1-, beta 2- and beta 3- adrenoceptors in the control of lipolysis and nutritive blood flow in human subcutaneous adipose tissue. Br J Pharmacol. 1996;117:907–913. doi: 10.1111/j.1476-5381.1996.tb15279.x. [DOI] [PMC free article] [PubMed] [Google Scholar]
- 12.Stich V, de GI, Crampes F, et al. Activation of antilipolytic alpha(2)-adrenergic receptors by epinephrine during exercise in human adipose tissue. Am J Physiol. 1999;277:R1076–R1083. doi: 10.1152/ajpregu.1999.277.4.R1076. [DOI] [PubMed] [Google Scholar]
- 13.Hellstrom L, Rossner S, Hagstrom-Toft E, et al. Lipolytic catecholamine resistance linked to alpha 2-adrenoceptor sensitivity--a metabolic predictor of weight loss in obese subjects. Int J Obes Relat Metab Disord. 1997;21:314–320. doi: 10.1038/sj.ijo.0800407. [DOI] [PubMed] [Google Scholar]
- 14.Stich V, Pelikanova T, Wohl P, et al. Activation of alpha2-adrenergic receptors blunts epinephrine-induced lipolysis in subcutaneous adipose tissue during a hyperinsulinemic euglycemic clamp in men. Am J Physiol Endocrinol Metab. 2003;285:E599–E607. doi: 10.1152/ajpendo.00502.2002. [DOI] [PubMed] [Google Scholar]
- 15.Arner P. Catecholamine-induced lipolysis in obesity [In Process Citation] Int J Obes Relat Metab Disord. 1999;2310-3(Suppl 1):10–13. doi: 10.1038/sj.ijo.0800789. [DOI] [PubMed] [Google Scholar]
- 16.Blaak EE, van Baak MA, Kemerink GJ, et al. Beta-adrenergic stimulation of energy expenditure and forearm skeletal muscle metabolism in lean and obese men. Am J Physiol. 1994;267:E306–E315. doi: 10.1152/ajpendo.1994.267.2.E306. [DOI] [PubMed] [Google Scholar]
- 17.Reynisdottir S, Ellerfeldt K, Wahrenberg H, et al. Multiple lipolysis defects in the insulin resistance (metabolic) syndrome. J Clin Invest. 1994;93:2590–2599. doi: 10.1172/JCI117271. Abstract. [DOI] [PMC free article] [PubMed] [Google Scholar]
- 18.Bougneres P, Stunff CL, Pecqueur C, et al. In vivo resistance of lipolysis to epinephrine. A new feature of childhood onset obesity. J Clin Invest. 1997;99:2568–2573. doi: 10.1172/JCI119444. [DOI] [PMC free article] [PubMed] [Google Scholar]
- 19.Horowitz JF, Coppack SW, Paramore D, et al. Effect of short-term fasting on lipid kinetics in lean and obese women. Am J Physiol. 1999;276:E278–E284. doi: 10.1152/ajpendo.1999.276.2.E278. [DOI] [PubMed] [Google Scholar]
- 20.Rosmond R. Association studies of genetic polymorphisms in central obesity: a critical review. Int J Obes Relat Metab Disord. 2003;27:1141–1151. doi: 10.1038/sj.ijo.0802397. [DOI] [PubMed] [Google Scholar]
- 21.Leineweber K, Buscher R, Bruck H, et al. β-adrenoceptor polymorphisms. Naunyn-Schmiedeberg’s Arch Pharmacol. 2004;369:1–22. doi: 10.1007/s00210-003-0824-2. [DOI] [PubMed] [Google Scholar]
- 22.Rankinen T, Zuberi A, Chagnon YC, et al. The human obesity gene map: the 2005 update. Obesity (Silver Spring) 2006;14:529–644. doi: 10.1038/oby.2006.71. [DOI] [PubMed] [Google Scholar]
- 23.Durnin JV, Womersley J. Body fat assessed from total body density and its estimation from skinfold thickness: measurements on 481 men and women aged from 16 to 72 years. Br J Nutr. 1974;32:77–97. doi: 10.1079/bjn19740060. [DOI] [PubMed] [Google Scholar]
- 24.Wallace TM, Levy JC, Matthews DR. Use and abuse of HOMA modeling. Diabetes Care. 2004;27:1487–1495. doi: 10.2337/diacare.27.6.1487. [DOI] [PubMed] [Google Scholar]
- 25.Johnson JA, Lima JJ. Drug receptor/effector polymorphisms and pharmacogenetics: current status and challenges. Pharmacogenetics. 2003;13:525–534. doi: 10.1097/00008571-200309000-00001. [DOI] [PubMed] [Google Scholar]
- 26.Terra SG, McGorray SP, Wu R, et al. Association between beta-adrenergic receptor polymorphisms and their G-protein-coupled receptors with body mass index and obesity in women: a report from the NHLBI-sponsored WISE study. Int J Obes (Lond) 2005;29:746–754. doi: 10.1038/sj.ijo.0802978. [DOI] [PubMed] [Google Scholar]
- 27.Wang J, Mougey EB, David CJ, et al. Determination of human β2-adrenoceptor haplotypes by denaturation selective amplification and subtractive genotyping. Am J Pharmacogenomics. 2001;1:1175–2203. doi: 10.2165/00129785-200101040-00008. [DOI] [PubMed] [Google Scholar]
- 28.D’amato M, Vitiani LR, Petrelli G, et al. Association of persistent bronchial hyperresponsiveness with beta2- adrenoceptor (ADRB2) haplotypes. A population study. Am J Respir Crit Care Med. 1998;158:1968–1973. doi: 10.1164/ajrccm.158.6.9804126. [DOI] [PubMed] [Google Scholar]
- 29.Myers R. Classical and modern regression with applications. 2. Duxbury Press; 1990. [Google Scholar]
- 30.Balding D, Bishop M. Handbook of statistical Genetis. Wiley; 2001. [Google Scholar]
- 31.Agresti A. Categoracal data analysis. 2. Wiley; 2002. [Google Scholar]
- 32.Conover W. Pratical nonparametric statistics. 3. John Wiley & Sons, Inc; 1999. [Google Scholar]
- 33.Rao P. Statistical research methods in life sciences. Duxbury Press; 1998. [Google Scholar]
- 34.Utts J, Heckard R. Mind on Statistics. (2) 2004 [Google Scholar]
- 35.Tafel J, Branscheid I, Skwarna B, et al. Variants in the human beta 1-, beta 2-, and beta 3-adrenergic receptor genes are not associated with morbid obesity in children and adolescents. Diabetes Obes Metab. 2004;6:452–455. doi: 10.1111/j.1462-8902.2004.00366.x. [DOI] [PubMed] [Google Scholar]
- 36.Dionne IJ, Garant MJ, Nolan AA, et al. Association between obesity and a polymorphism in the beta(1)-adrenoceptor gene (Gly389Arg ADRB1) in Caucasian women. Int J Obes Relat Metab Disord. 2002;26:633–639. doi: 10.1038/sj.ijo.0801971. [DOI] [PubMed] [Google Scholar]
- 37.Mason DA, Moore JD, Green SA, et al. A gain-of-function polymorphism in a G-protein coupling domain of the human beta1-adrenergic receptor. J Biol Chem. 1999;274:12670–12674. doi: 10.1074/jbc.274.18.12670. [DOI] [PubMed] [Google Scholar]
- 38.Sandilands AJ, O’Shaughnessy KM, Brown MJ. Greater inotropic and cyclic AMP responses evoked by noradrenaline through Arg389 beta 1-adrenoceptors versus Gly389 beta 1-adrenoceptors in isolated human atrial myocardium. Br J Pharmacol. 2003;138:386–392. doi: 10.1038/sj.bjp.0705030. [DOI] [PMC free article] [PubMed] [Google Scholar]
- 39.Esler M, Rumantir M, Wiesner G, et al. Sympathetic nervous system and insulin resistance: from obesity to diabetes. Am J Hypertens. 2001;14:304S–309S. doi: 10.1016/s0895-7061(01)02236-1. [DOI] [PubMed] [Google Scholar]
- 40.Straznicky NE, Lambert EA, Lambert GW, et al. Effects of dietary weight loss on sympathetic activity and cardiac risk factors associated with the metabolic syndrome. J Clin Endocrinol Metab. 2005;90:5998–6005. doi: 10.1210/jc.2005-0961. [DOI] [PubMed] [Google Scholar]
- 41.Ryden M, Hoffstedt J, Eriksson P, et al. The Arg 389 Gly beta1-adrenergic receptor gene polymorphism and human fat cell lipolysis. Int J Obes Relat Metab Disord. 2001;25:1599–1603. doi: 10.1038/sj.ijo.0801815. [DOI] [PubMed] [Google Scholar]
- 42.Linne Y, Dahlman I, Hoffstedt J. beta1-Adrenoceptor gene polymorphism predicts long-term changes in body weight. Int J Obes (Lond) 2005;29:458–462. doi: 10.1038/sj.ijo.0802892. [DOI] [PubMed] [Google Scholar]
- 43.Levin MC, Marullo S, Muntaner O, et al. The myocardium-protective Gly-49 variant of the beta 1-adrenergic receptor exhibits constitutive activity and increased desensitization and down-regulation. J Biol Chem. 2002;277:30429–30435. doi: 10.1074/jbc.M200681200. [DOI] [PubMed] [Google Scholar]
- 44.Rathz DA, Brown KM, Kramer LA, et al. Amino acid 49 polymorphisms of the human beta1-adrenergic receptor affect agonist-promoted trafficking. J Cardiovasc Pharmacol. 2002;39:155–160. doi: 10.1097/00005344-200202000-00001. [DOI] [PubMed] [Google Scholar]
- 45.Drysdale CM, McGraw DW, Stack CB, et al. Complex promoter and coding region beta 2-adrenergic receptor haplotypes alter receptor expression and predict in vivo responsiveness [In Process Citation] Proc Natl Acad Sci USA. 2000;97:10483–10488. doi: 10.1073/pnas.97.19.10483. [DOI] [PMC free article] [PubMed] [Google Scholar]
- 46.Large V, Hellstrom L, Reynisdottir S, et al. Human beta-2 adrenoceptor gene polymorphisms are highly frequent in obesity and associate with altered adipocyte beta-2 adrenoceptor function. J Clin Invest. 1997;100:3005–3013. doi: 10.1172/JCI119854. [DOI] [PMC free article] [PubMed] [Google Scholar]
- 47.Belfer I, Buzas B, Hipp H, et al. Haplotype-based analysis of alpha 2A, 2B, and 2C adrenergic receptor genes captures information on common functional loci at each gene. J Hum Genet. 2005;50:12–20. doi: 10.1007/s10038-004-0211-y. [DOI] [PubMed] [Google Scholar]
- 48.Li JL, Canham RM, Vongpatanasin W, et al. Do Allelic Variants in {alpha}2A and {alpha}2C Adrenergic Receptors Predispose to Hypertension in Blacks? Hypertension. 2006 doi: 10.1161/01.HYP.0000217972.80731.ef. [DOI] [PubMed] [Google Scholar]
- 49.Oppert JM, Tourville J, Chagnon M, et al. DNA polymorphisms in the alpha 2- and beta 2-adrenoceptor genes and regional fat distribution in humans: association and linkage studies. Obes Res. 1995;3:249–255. doi: 10.1002/j.1550-8528.1995.tb00145.x. [DOI] [PubMed] [Google Scholar]
- 50.Ukkola O, Perusse L, Chagnon YC, et al. Interactions among the glucocorticoid receptor, lipoprotein lipase and adrenergic receptor genes and abdominal fat in the Quebec Family Study. Int J Obes Relat Metab Disord. 2001;25:1332–1339. doi: 10.1038/sj.ijo.0801735. [DOI] [PubMed] [Google Scholar]
- 51.Wolfarth B, Rivera MA, Oppert JM, et al. A polymorphism in the alpha2a-adrenoceptor gene and endurance athlete status. Med Sci Sports Exerc. 2000;32:1709–1712. doi: 10.1097/00005768-200010000-00008. [DOI] [PubMed] [Google Scholar]
- 52.Rosmond R, Bouchard C, Bjorntorp P. A C-1291G polymorphism in the alpha2A-adrenergic receptor gene (ADRA2A) promoter is associated with cortisol escape from dexamethasone and elevated glucose levels. J Intern Med. 2002;251:252–257. doi: 10.1046/j.1365-2796.2002.00961.x. [DOI] [PubMed] [Google Scholar]
- 53.Ukkola O, Rankinen T, Weisnagel SJ, et al. Interactions among the alpha2-, beta2-, and beta3-adrenergic receptor genes and obesity-related phenotypes in the Quebec Family Study. Metabolism. 2000;49:1063–1070. doi: 10.1053/meta.2000.7708. [DOI] [PubMed] [Google Scholar]
- 54.Zimmet P, Magliano D, Matsuzawa Y, et al. The metabolic syndrome: a global public health problem and a new definition. J Atheroscler Thromb. 2005;12:295–300. doi: 10.5551/jat.12.295. [DOI] [PubMed] [Google Scholar]
- 55.Eckel RH, Grundy SM, Zimmet PZ. The metabolic syndrome. Lancet. 2005;365:1415–1428. doi: 10.1016/S0140-6736(05)66378-7. [DOI] [PubMed] [Google Scholar]
- 56.Dallongeville J, Helbecque N, Cottel D, et al. The Gly16-->Arg16 and Gln27-->Glu27 polymorphisms of beta2-adrenergic receptor are associated with metabolic syndrome in men. J Clin Endocrinol Metab. 2003;88:4862–4866. doi: 10.1210/jc.2003-030173. [DOI] [PubMed] [Google Scholar]
- 57.Fumeron F, Aubert R, Siddiq A, et al. Adiponectin gene polymorphisms and adiponectin levels are independently associated with the development of hyperglycemia during a 3-year period: the epidemiologic data on the insulin resistance syndrome prospective study. Diabetes. 2004;53:1150–1157. doi: 10.2337/diabetes.53.4.1150. [DOI] [PubMed] [Google Scholar]
- 58.Hirschhorn JN, Daly MJ. Genome-wide association studies for common diseases and complex traits. Nat Rev Genet. 2005;6:95–108. doi: 10.1038/nrg1521. [DOI] [PubMed] [Google Scholar]
- 59.Pritchard JK, Rosenberg NA. Use of unlinked genetic markers to detect population stratification in association studies. Am J Hum Genet. 1999;65:220–228. doi: 10.1086/302449. [DOI] [PMC free article] [PubMed] [Google Scholar]