Abstract
Natural killer (NK) cell- or T cell-mediated cytotoxicity traditionally is measured in 4-16h 51Cr-release assays (CRA). A new four-color flow cytometry-based cytotoxicity assay (FCC) was developed to simultaneously measure NK cell cytotoxicity and NK cell phenotype (CD3−CD16+CD56+). Target cells, K562 or Daudi, were labeled with Cell Tracker Orange (CTO) prior to the addition of effector cells. Following co-incubation, 7 amino-actinomycin D (7-AAD) was added to measure death of target cells. The phenotype of effectors, viability of targets, the formation of tumor-effector cell conjugates and absolute numbers of all cells were measured based on light scatter (FSC/SSC), double discrimination of the fluorescence peak integral and height, and fluorescence intensity. Kinetic studies (0.5 and 1 to 4h) at different effector to target (E:T) cell ratios (50, 25, 12, and 6) confirmed that the 3h incubation was optimal. The FCC assay is more sensitive than the CRA, has a coefficient of variation (CV) 8–13% and reliably measures NK cell- or lymphokine-activated killer (LAK) cell-mediated killing of target cells in normal controls and subjects with cancer. The FCC assay can be used to study a range of phenotypic attributes, in addition to lytic activity of various subsets of effector cells, without radioactive tracers and thus, it is relatively inexpensive. The FCC assay has a potential for providing information about molecular interactions underlying target cell lysis and thus becoming a major tool for studies of disease pathogenesis as well as development of novel immune therapies.
Keywords: Cell-mediated cytotoxicity, Natural killer cells (NK), Lymphokine activated killer cells (LAK), Flow cytometry cytotoxicity (FCC)
Introduction
Cell-mediated cytotoxicity is a mechanism used by immune cells for defense against intracellular pathogens, tumor cells, and allogeneic tissue grafts (Biron et al, 1999; Shresta et al, 1998; Graubert et al, 1997). Lymphocyte effector cells, including natural killer (NK) cells, NKT cells and cytotoxic T lymphocytes (CTL), recognize and kill targets by direct cell-to-cell interactions, cytokine production, and/or granule exocytosis (Kreuwel et al, 1999). NK cells are regulated by inhibitory and activating receptors to protect normal “self” but eliminate “dangerous” (infected, transformed) cells expressing ligands complementary to activating receptors (Lanier, 2003; DiSanto, 2006). NK cells are responsible for immune surveillance and represent the major component of innate immunity (Whiteside and Herberman, 1995). Resting NK cells express the β chain of the IL-2 receptor, and their stimulation with interleukin-2 (IL-2) leads to the generation of lymphokine activated killer (LAK) cells with up-regulated cytotoxicity against a wide variety of targets (Whiteside and Herberman, 1995). Another subset of lymphocytes, NKT cells, expressing both T and NK cell markers, also contribute to regulation of tumor growth and metastasis as well as autoimmune disorders (Smyth et al, 2002). CTL, which require antigen priming and sensitization, mediate acquired immunity (Andersen et al, 2006). Activities of these various lymphocyte subsets may be impaired or enhanced in disease. Thus, the ability of effector cells to kill a target expressing certain defined characteristics has become an accepted way of monitoring cytotoxic activity. At the same time, the nature as well as numbers and phenotypic characteristics of effector cells mediating this activity are of interest to fully evaluate the extent of abnormalities present in disease or recovery of effector cell functions following therapy.
Since 1968, the radioactive chromium (51Cr)-release method has been traditionally used to determine the cytolytic activity of effector cell populations (Roder et al, 1980; Morales and Ottenhof, 1983). In this assay, 51Cr labeled targets are co-cultured with effector cells for 4 to 16h, and the culture supernatants are quantified for 51Cr released from lysed targets in a gamma counter. Although the assay is reliable and has become a “gold standard” for measuring cytotoxicity, it has a number of disadvantages and functional limitations. The major disadvantages of the 51chromium-release assay (CRA) are (1) the use of radioactivity which may be hazardous to health and is impractical and costly due to the short half-life of 51Cr and requirements for radiation safety training and licensing; (2) the use of CRA is limited to targets which spontaneously label with 51Cr quantities sufficient for reliable detection of lysis; (3) the CRA sensitivity depends on the background, i.e., the amount of 51Cr released from viable target cells over the assay period; (3) the assay is not interpretable if spontaneous 51Cr-release is high, and thus many targets are not suitable for CRA because of high spontaneous 51Cr release; (4) its interassay variability is considerable, and coefficients of variation (CV’s) over 20% are common. The functional limitations of the assay are that results are uniparametric, death is not quantified at a single-cell level, and difficulties in labeling target cells with 51Cr are common. For these reasons, a search for methods that could replace the CRA has been ongoing, and several alternative assays have been introduced (Von Zons et al, 1997; Jedema et al, 2004; Roden et al, 1999; Chahroudi et al, 2003).
Recently, flow cytometry-based methods have been developed to overcome some of the disadvantages and limitations of the CRA. For example, monitoring of cell death by highly sensitive measurements of fluorochrome release by labeled targets or staining with specific markers or dyes for indication of target death represent novel initiatives (Goldberg et al, 1999; Ozdemir et al, 2003; Liu et al, 2002). However, an assay that simultaneously monitors not one but several functional characteristics of effector cells, defines their phenotype, evaluates effector-tumor conjugate formation in addition to killing or quantifies avidity of effector target binding in relation to cytotoxicity has not yet been devised. We have undertaken the development of a multi-color flow cytometry assay to simultaneously measure NK cell- or LAK cell-mediated cytotoxicity, visualize conjugates of tumor and effectors, obtain absolute cell counts, measure cytolytic function of killer cells and determine their immunophenotype. This approach is expected to provide a more accurate evaluation of the mechanisms involved in killing of target cells by effector cells obtained from normal donors or diseased subjects. At the same time, the assay results correlate with the traditional CRA. Here, using effector cells isolated from the peripheral blood of patients with cancer, we demonstrate that the new flow-based assay extends the number of features applicable to identification and characterization of effector cell subsets that are responsible for killing of tumor cell targets.
Materials and Methods
Subjects and samples
Venous blood was obtained from healthy volunteers (n = 11), patients with melanoma (n = 8), and patients with head and neck cancer (n = 7) for the NK cell assay. Additional healthy volunteers (n = 12) donated peripheral blood for the LAK cell assay. Blood samples were collected into heparinized tubes and delivered to the laboratory within 2h of phlebotomy. All subjects signed a consent form approved by the IRB. Peripheral blood mononuclear cells (PBMC) were isolated by Ficoll-Hypaque gradient centrifugation. PBMC were recovered from the gradient interface, washed in phosphate buffered saline (PBS), counted and assessed for viability in a trypan blue dye (0.2% (v/v) in PBS), and promptly used for the flow cytometry and the CRA, which were performed in parallel by the same individual (GGK).
Cell targets
K562, human chronic myelogenous leukemia cells (ATCC #CCL-243), were cultured in RPMI 1640 medium supplemented with 10% (v/v) heat-inactivated fetal calf serum (FCS), 2 mM L-glutamine, 100 U/mL penicillin, and 100 μg/mL streptomycin (complete medium, CM) from Invitrogen, Carlsbad, CA at 37°C in the atmosphere of 5% CO2 in air. Daudi, human lymphoma cells (ATCC #CCL-213), were cultured in CM and used as targets for LAK assays. Target cells were harvested in the log phase of growth, washed in PBS and counted in a trypan blue dye prior to use.
LAK cell generation
PBMC (1 x 10⁶ cells/mL) were cultured in the CM medium described above. The CM was additionally supplemented with 2,000 International Units (IU)/mL of recombinant human Interleukin 2 (IL-2) obtained from Chiron (Emeryville, CA). Cells were cultured in T75 flasks at 37°C in the atmosphere of 5% CO2 in air for 3 days. On day 3, LAK cells were harvested and counted, then assayed for cytotoxic activity against Daudi targets.
51 Cr-release assay
The assay was performed as previously described (Whiteside et al, 1990). Briefly, target cells were labeled with 100 μCi of 51Cr (Perkin Elmer, Billerica, MA 200–500 mCi/mg) for 1h at 37°C in the atmosphere of 5% CO2 in air. The labeled cells were washed twice in CM, resuspended in CM, and the viable cell counts were performed. Cells were co-incubated at effector to target (E:T) ratios of 50, 25, 12, 6 for use in NK-cell assays and E:T ratios of 6, 3, 1.5, 0.75 for use in LAK-cell assays. Co-cultures were set up in 24 well flat bottom plates (Linbro, Aliso Viejo, CA) and plates were incubated in triplicate for 4h at 37°C in the atmosphere of 5% CO2 in air. Controls included targets incubated in medium alone for spontaneous release and targets in 5% (v/v) Triton X-100 (Sigma, St. Louis, MO) in PBS for maximum release. Radioactivity was measured by Wallac Wizard 1470 Automatic Gamma Counter. The percentage of cytotoxic activity was calculated using the following formula: % specific lysis = (sample cpm - spontaneous cpm)/(maximal cpm −spontaneous cpm) × 100%.
NK-cell flow cytometric assay
Target cells were labeled with 5 μM CellTracker Orange CMTMR (CTO) (Invitrogen, Eugene, Oregon) for 1h at 37°C in the atmosphere of 5% CO2 in air. The labeled cells were washed twice in PBS, resuspended in CM, and counted in a trypan blue dye. PBMCs were incubated in the presence of FITC-anti-CD16 (Leu-11a) (BD Biosciences, San Jose, CA), FITC-anti-CD56 (NCAM16.2) (BD Biosciences), and ECD-anti-CD3 (UCHT1) (Beckman Coulter, Miami, FL) monoclonal antibodies (MoAbs) according to the manufacturers’ recommendations for 30 min at 4°C. Cells were washed twice in PBS and again counted. The effector cells were co-incubated at the E:T ratios of 50, 25, 12, 6 for NK cell and 6, 3, 1.5, 0.75 for LAK cell assays, for various periods of time at 37°C in the atmosphere of 5% CO2 in air. Triplicate samples were set up for each E:T ratio. As controls, targets or PBMC alone were incubated in CM to measure spontaneous cell death. 7-amino-actinomycin D (7-AAD) (BD Biosciences) was added to every tube at the final concentration of 1ug/mL, as recommended by the manufacturer. Fluorospheres (Beckman Coulter) were added in order to obtain absolute cell counts. Samples used for the analysis of conjugate formation were acquired using low flow, so as not to disturb E:T conjugates. Stained samples were analyzed by multicolor flow cytometry immediately after the end of the incubation period.
Determining absolute counts using fluorospheres
The concentration of Flow Count Fluorospheres (Beckman Coulter) was confirmed using Coulter Micro Diff 16 counter (998 beads/μL). Fluorospheres were incubated at room temperature (25°C) for 30 minutes prior to their addition to the assay tubes. The fluorospheres were gently vortexed and an equal volume was added to each sample using an Eppendorf repeat pipettor. Samples were tested by flow cytometry, and the absolute cell counts were determined using the formula: (cell events / bead events) x the calibrator factor (998 beads/μL).
Immunophenotyping by multicolor flow cytometry
In parallel to tubes set up for measurements of cytotoxicity, PBMC were incubated in the presence of ECD-anti-CD3 (UCHT1), PC5-anti-CD16 (3G8), and PC5-anti-CD56 (N901) MoAbs (all from Beckman Coulter) at dilution recommended by the manufacturer for 30 min at 4°C. The stained cells were washed twice in PBS and counted in a trypan blue dye. The cells were co-incubated at the E:T ratios of 50, 25, 12, 6 for the NK-cell assay and at the E:T ratios of 6, 3, 1.5, 0.75 for the LAK-cell assay for 3h at 37°C in the atmosphere of 5% CO2 in air. To identify effector cells activated in the presence of the target, FITC-anti-CD69 (L78) (BD Biosciences) MoAb was added to the assay tubes immediately after termination of the incubation period. Isotype control MoAb was placed in control tubes. The cells were washed twice in PBS, fixed in 2% (w/v) paraformaldehyde in PBS (PFA) and washed again in PBS. Next, they were permeabilized in 1% saponin /0.1% (v/v) bovine serum albumin (BSA) in PBS (saponin solution), stained with PE-anti-granzyme B MoAb(CLB-GB11) or isotype control Ab (Research Diagnostics, Flanders, NJ) for 30 min at 4°C and washed in saponin solution followed by PBS. The controls were PBMC alone incubated in CM for baseline activity and granzyme B content. Stained samples were analyzed by flow cytometry within 24h of staining.
Flow cytometry acquisition and data analysis
Four-colored flow cytometry acquisition was performed on a Epics XL-MCL (Beckman Coulter) equipped with an argon laser operating at 488 nm. The instrument was calibrated daily. Alignment and fluids operation were verified with Flow Check beads (Beckman Coulter); PMT gain settings were confirmed using Flow Set beads (Beckman Coulter). The stop and save functions were used to acquire 20,000 CTO+ targets for each sample. Cells were acquired at a low flow rate with double discrimination of fluorescence peak integral and height to detect conjugate formation, and a time parameter was added to detect any fluidics problems during sample acquisition. CTO (λabs = 540 nm and λem = 566 nm) was detected in the FL2 channel, using filter configurations recommended by the manufacturer. 7-AAD was detected in the far red range of the spectrum (FL4, 650 nm long-pass filter). Spectral overlap was compensated in FL1, FL2, and FL3 channels using FITC-anti-CD8 MoAb, CTO, and ECD-anti-CD8 MoAb. 7-AAD + events (i.e., dead cells), which were detected in both FL3 and FL4 channels, were removed from analyses of FL3 fluorescence by logical gating. Fluorospheres, used for absolute counts determinations, were also detected in all channels, but were excluded from analyses of cellular fluorescence by their distinctive scatter and fluorescence signature. The data were analyzed using the Coulter EXPO 32v1.2 analysis software. The percentages of cytotoxic activity was calculated using the following equation:
Amnis-based imaging of E and T interactions
The Amnis instrument was purchased from The Amnis Corporation, Seattle, WA. The FCC assays were set up at different E:T ratios as described above. In the Amnis imaging assay, similar to the FCC assay, targets are identified by CTO staining and are scored for cell death by up-take of 7-AAD. However, interactions of surface-labeled effector populations with the target are visualized using a brightfield image. The brightfield aspect ratio is quantified as the ratio of the width to the length of imaged objects. An aspect ratio close to 1 indicates a round object. Smaller aspect ratios indicate an elongated object, such as that formed by a cluster of two or more cells.
Statistical analyses
Reproducibility of the flow cytometric assay was characterized by estimating the pooled within-subject coefficient of variation and the intra-class correlation coefficient. The standard error of measurement was calculated and used to compute 95% confidence bounds on each NK cell flow cytometric measurement of percent of cell death. The FCC was compared to CRA with random coefficient regression models (Rutter and Elashof, 1994). For each subject, the proportion of positive cells was logit transformed, and a regression model was fit to the base 2 logarithm of the E:T ratio. Each donor was treated as a random effect with a common unstructured covariance matrix. Once the linearity assumption was verified, the mean response for each type of assay was estimated as a fixed effect, and the slopes were compared by testing for equality under the assumption that the intercepts differ. Thus, it was possible to verify whether a single slope model could describe both the FCC and CRA.
Results
Gating strategies for the flow cytometry-based assay
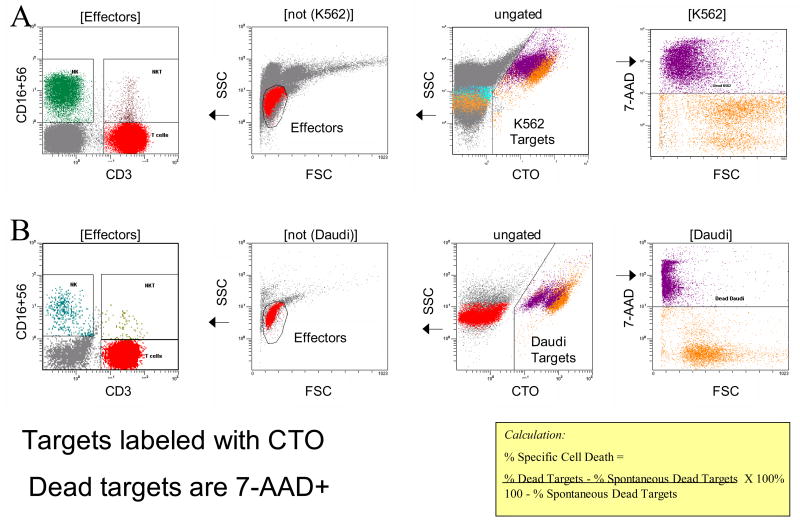
Discrimination between effectors, targets and effector cell-target conjugates in the flow cytometry-based cytotoxicity (FCC) assay is dependent on gating strategies. For example, the gating strategy shown in Figure 1 permits simultaneous identification of target cells (alive vs. dead) and several populations of effector cells. NK cells (CD3−CD56+CD16+) are discriminated from T cells (CD3+CD16−CD56−). In its simplest version, the assay provides information about the proportion of target cells killed during co-incubation with the identified and quantified effector cell populations consisting of NK cells, NKT cells and T lymphocytes. Other gating strategies which permit assessments of cell numbers or examination of conjugates are presented in subsequent figures.
Figure 1.
Gating strategy used for the FCC assay. Identification of target cells: ungated events are shown in the third panel from the left. Target cells (K562) are identified as CTO+ events with high side scatter. The rightmost panel, gated on target cells only, shows forward scatter versus 7-AAD fluorescence. Dead K562 target cells (color-evented purple) in A or dead Daudi cells in B are identified by 7-AAD dye uptake and low forward scatter. Identification of effector cells: the second panel from the left is gated to exclude target cells and shows the light scatter characteristics of the peripheral blood mononuclear cells assayed for cytotoxicity. The leftmost panel, gated to include lymphoid light scatter events from the previous panel, and to exclude target cells, shows anti-CD3 ECD fluorescence, versus anti-CD16 plus CD56 FITC fluorescence. Effector cells are analyzed for expression of CD3, CD16 and CD56 to identify NK (CD3−CD16+CD56+), NKT (CD3+CD16+CD56+) and T cell (CD+CD16−CD56−) populations.
Quantification of cytotoxicity using flow cytometry
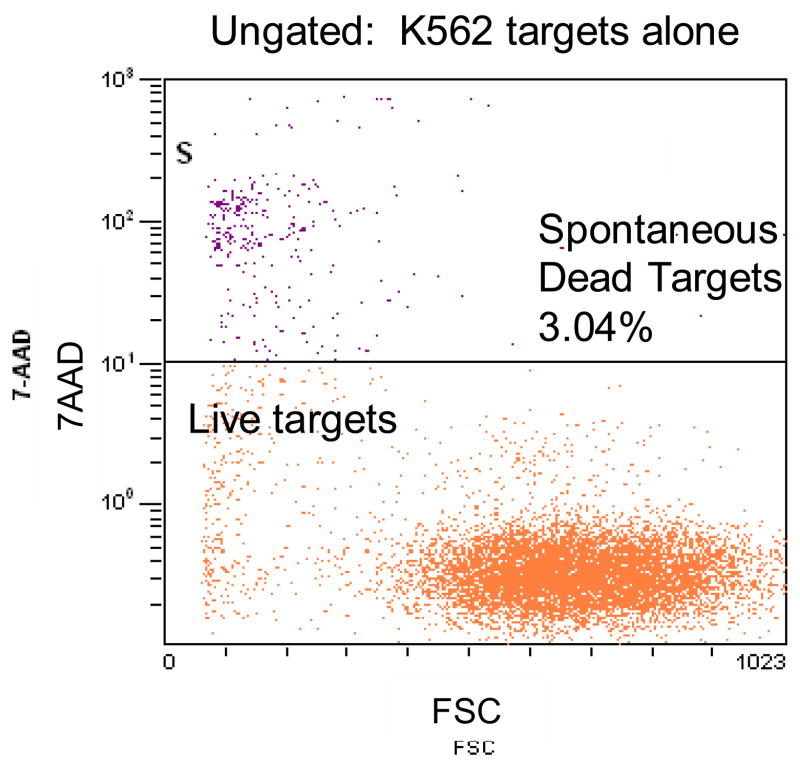
In the 51Cr-release assay (CRA), 51Cr may be spontaneously released by leaky target cells, and the formula for the calculation of percent specific lysis corrects for spontaneous 51Cr release. In the FCC method, 7-AAD uptake by live cells is limited and easily distinguished from that of dead cells (Figure 1). However, some targets may be dead prior to co-incubation with effector cells. To account for spontaneous target cell death (i.e., before co-incubation) a similar formula is used: % specific death = % total 7-AAD+CTO+ (dead) cells - % spontaneous 7-AAD+CTO+ / (100% - % spontaneous 7-AAD+CTO+ (dead) cells) x 100%. The percentage of spontaneous 7-AAD+CTO+ target cells is measured in the tube containing target cells only (Figure 2) , while that of dead 7-AAD+CTO+ target cells is determined after co-incubation of targets with effectors (Figures 1 and 2). Because flow cytometry has the capacity for analyzing thousands of cells per second, one cell at a time, the number and percentage of cells acquired that display defined characteristics may be rapidly and precisely determined in multiple experimental and control tubes. In our experiments, we routinely acquired 20,000 targets for analysis.
Figure 2.
Measurement of spontaneous release of the dye from labeled K562 cells. A representative experiment of 9 performed with PBMC of normal donors.
Absolute counts of effector cells
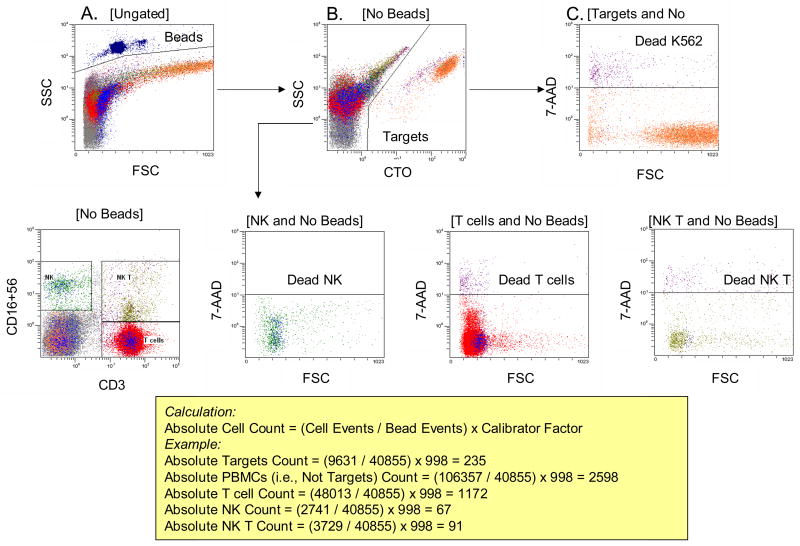
The addition of fluorosphere beads at the known concentration to tubes containing effectors and targets allowed for calculation of the absolute numbers of all identifiable cell populations at the termination of the assay (Figure 3). Since the absolute number of target cells at time 0 is known, the assay can account for target cells which have disappeared from the analysis as well as for those that have become 7-AAD permeable. Similarly, time-dependent changes in the number of effector populations can be determined.
Figure 3.
Gating strategies used for the assessment of absolute lymphocyte and tumor cell counts in the presence of fluorobeads. Beads (high scatter events) are dark blue; live targets are orange; and dead targets are purple. A. In an open gate, fluorobeads are visualized and bead events are counted. B. Gate is set on cells, discriminating CTO + targets from lymphocytes. C. Gate is set on targets to obtain the number of live and dead K562 cells. The lower row shows the gates used to determine numbers of live an dead effector cells (NK, T and NKT).
Assay kinetics
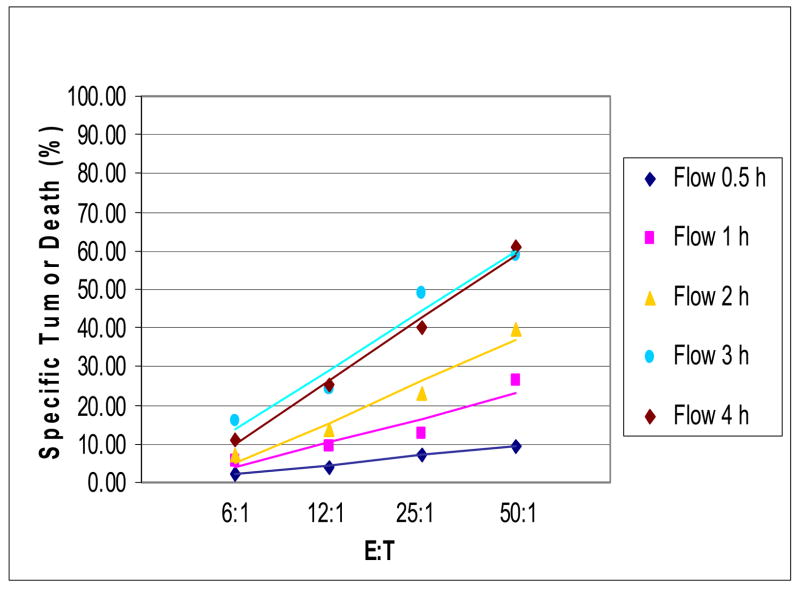
The CRA are incubated for 4-16h, depending on the sensitivity of targets to effector cell-mediated lysis. Using K562 cells as targets and PBMC obtained from normal donors as effectors (n = 11), the co-cultures were incubated for various time periods. As illustrated in Figure 4, the cytotoxicity curves for the 3h and 4h assays were nearly identical. Neither the shorter nor longer co-incubation periods were satisfactory. Assays incubated longer than 4h were not reproducible and tended to show decreased cytotoxicity values. Therefore, the 3h period was selected as optimal incubation time for the FCC assay.
Figure 4.
FCC assays performed for different co-incubation time periods using PBMC as effectors and K562 cells as targets. Representative data obtained with PBMC from one of 11 normal donors tested.
Assay reproducibility
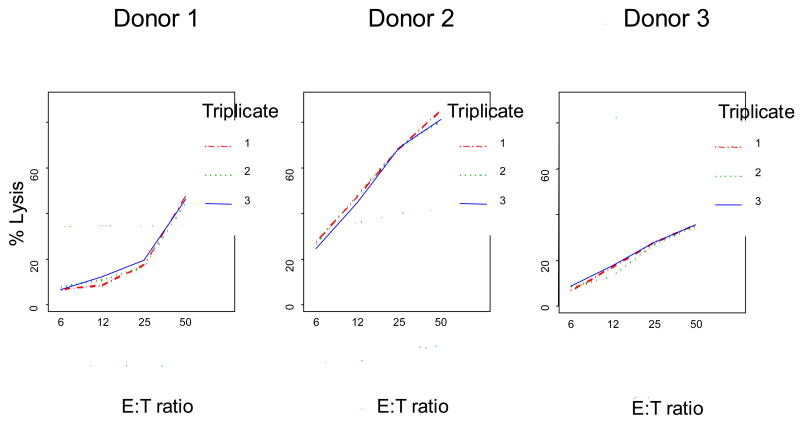
The initial assay validation tested the linearity assumption for samples run at four E:T ratios. The percent of cell lysis was logit transformed, and the E:T ratio was log transformed (base 2). The linearity assumption of the E:T ratio vs. % specific lysis was found to be correct, and random coefficient linear regression models were fit to the logit-transformed data. Blood samples obtained from 9 normal donors were assayed in triplicate, and were tested in parallel on the same day for each donor. In total, 108 data points were analyzed. This strategy allowed for the assay precision to be determined, and the CV for the assay calculated as shown in Table 1. The assay was found to be highly reproducible with CV ranging from 7.9 to 12.7%, high intra-class correlation coefficient (0.960–0.987), small standard error of measurement estimated from the pooled within-donor variances (0.87–4.35), and 95% confidence bounds for the assay value ranging from ± 1.7 to ± 8.5. The representative data for three of nine donors are shown in Figure 5, demonstrating excellent intra-assay variability for these samples.
Table 1.
Reproducibility of the flow cytometry-based cytotoxicity assay
| E:T Ratio
|
||||
|---|---|---|---|---|
| 6:1 | 12:1 | 25:1 | 50:1 | |
|
|
||||
| Within subject coefficient of variationa | 9.1% | 12.7% | 7.9% | 11.1% |
| Intra-class correlation coefficientb | .985 | .970 | .987 | .960 |
| Standard error of measurementc | 0.87 | 2.22 | 2.05 | 4.35 |
| 95% confidence bounds for a new assay valued | ± 1.7 | ± 4.4 | ± 4.1 | ± 8.5 |
Within-subject coefficient of variation = intra-assay standard deviation / overall mean
Intraclass correlation coefficient = correlation of assay results within the same sample (also = ratio of subject variation to total (inter)variation, i.e., 1-intraclass correlation = proportion of variation due to measurement error)
Standard error of measurement estimated from the pooled within-donor variance (intra)
Confidence interval for the true (error-free) value
The data were obtained by testing specimens obtained from 9 normal donors. Each assay was repeated 3 times on the same day
Figure 5.
Intra-assay variability of FCC assays performed with K562 targets and PBMC obtained from three representative normal donors (of 9 tested). Note that the Y-axis is plotted on the logit scale used to linearize the data for statistical analysis. Each FCC assay was repeated three times (solid, dashed and dotted lines).
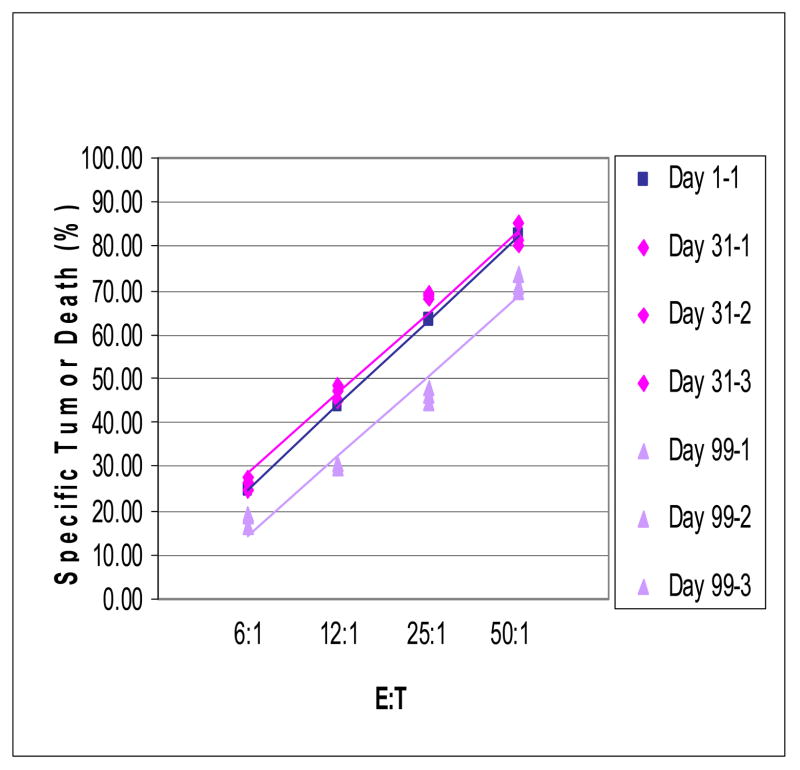
Biological variability of the assay is, of course, dependent on changes in the measured activity spontaneously occurring overtime in a tested subject. In the case of NK cell cytotoxicity, biological variability in a representative normal donor between day 1 and day 99 was noticeable, with a difference of about 30% at all E:T ratios (Figure 6). In contrast, as shown in Figure 6, differences in NK cell cytotoxicity between day 1 and 31 were negligible for the same donor. The data suggest that the assay is able to discriminate between levels of activity that change overtime in the same individual and thus is likely to be applicable to serial measurements taken in the course of therapy, for example.
Figure 6.
Biologic variability in NK cell cytotoxicity detected in a FCC assay with K562 cells. PBMC were obtained from the same normal donor on days 1, 30 and 99. On days 30 and 99, the FCC assays were done in triplicate. Data from a representative donor of 4 tested.
Comparisons of the FCC assay with CRA
To determine whether the FCC assay could be substituted for the CRA, both assays were performed in parallel, using the same blood samples. In the initial experiments, it was established that spontaneous dye release was consistently <4% in the FCC assay using K562 or Daudi targets. This contrasted favorably with the CRA, which had spontaneous release ranging from 10 to 12%. We also showed that the FCC assay incubated for 3h correlated best to the standard CRA, with R2 values of 0.9090 to 0.9980 and p<0.003 for linear regression analysis of results obtained from 3 normal control (NC) samples incubated for 0.5, 1, 2, 3 and 4h (Figure 4). This result confirmed that the flow-based assay was measuring kinetics of effector-target interactions with greater efficiency.
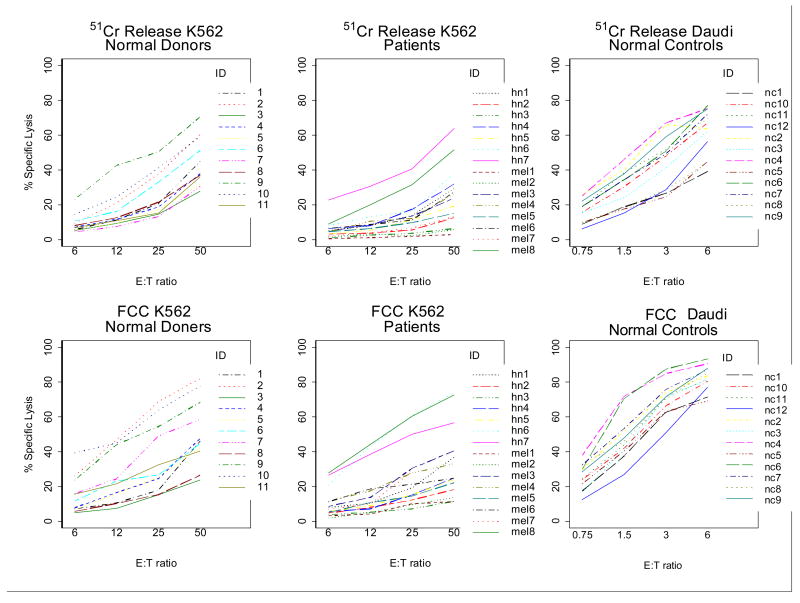
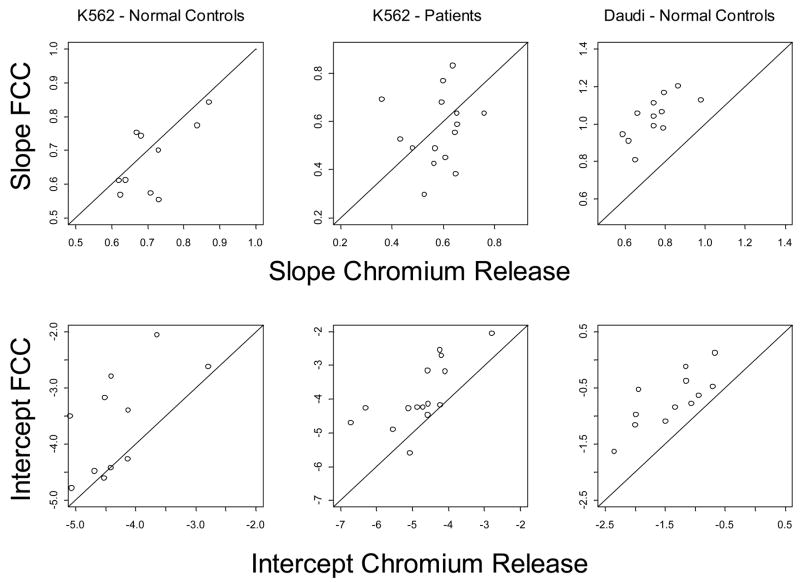
Next, three sets of cytotoxicity data were obtained in the parallel experiments, comparing 4h CRA with 3h FCC assay: (1) NK cell cytotoxicity in PBMC obtained from 11 NC; (2) NK cell cytotoxicity in PBMC of 15 patients with cancer (7 with squamous cell carcinoma of the head and neck and 8 with melanoma); and (3) LAK activity in IL-2-stimulated PBMC of 12 NC. K562 targets were used as targets in the first two series, and Daudi cells served as targets for LAK assays. Untransformed results for these three series of parallel experiments are shown in Figure 7. In this figure, slopes and intercepts appear to be similar for both assays when measuring cytotoxicity of NK cells against K562 targets. However, the response curves for LAK cytotoxicity vs. Daudi targets appear to have different slopes in the two assays. All data were logit transformed to linearize the response curves and allow for a fit into a linear regression model. From random coefficient models, the predicted mean responses of NC were identical in both assays, as indicated by the parallel slopes of lytic curves and by intercepts which were not significantly different (p = 0.230). With patient samples, heterogenous responses were observed, resulting in a greater variability of individual slopes (p = 0.029). Also, the intercept was significantly higher for FCC assay than for 51Cr-release (p = 0.022). Using Daudi cells as targets in LAK assays, the mean slopes differed significantly (p = 0.0003). Figure 8 displays these individual slopes and intercepts for each assay, with a line of equality drawn in each graph for reference (slope = 1). For the NK cell assay (K562 targets), the slopes for both ND and patients tended to cluster around the line of equality suggesting equivalent responses in the two assays. In contrast, the intercepts indicate that FCC assay measures a uniformly higher response than the CRA. In all three subsets, the individual intercepts are greater for flow cytometry than for 51Cr-release. Overall, within the range of E:T ratios used for LAK cytotoxicity in this study, the slope for flow cytometry was significantly greater than that for 51Cr-release; this finding is consistent with a greater sensitivity of the FCC assay.
Figure 7.
Comparisons of the 3h FCC assay with 4 h CRA. PBMC were co-incubated with K562 targets. Non-transformed data obtained with PBMC of normal donors (n = 11) and patients with cancer (n = 15). PBMC of 12 normal donors were also stimulated with IL-2 and tested for LAK activity with Daudi targets.
Figure 8.
Comparisons of slopes and intercepts obtained from analyses of data obtained in normal donors (n = 11) and patients with cancer were tested with K562 targets. PBMC of 12 normal donors were stimulated in the presence of IL-2 and tested for LAK activity with Daudi targets. A line of equality (slope = 1) is drawn on each graph for reference. In all three groups, the individual intercepts are greater for the FCC assay than CRA.
Immunophenotyping of effector cells
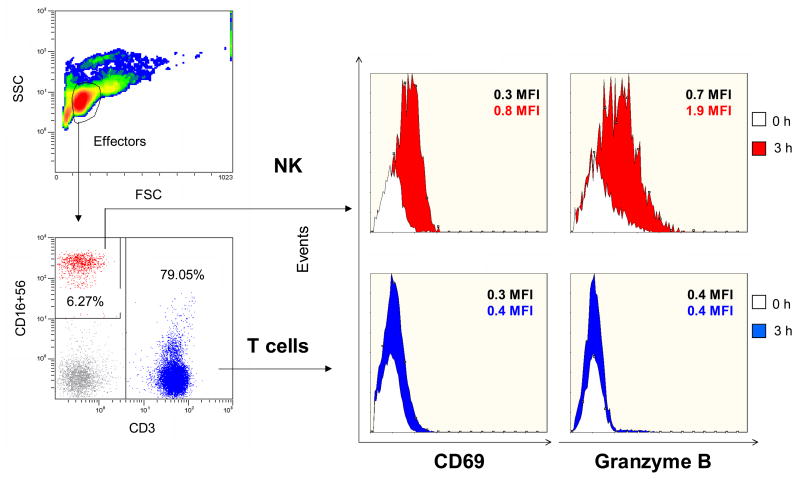
When PBMC or other mixtures of cell types are used as effector cells, the identification of cells activated in the presence of targets and presumably responsible for cytotoxicity is important. In an example shown in Figure 9, NK cells are identified as effectors (CD69+, Granzyme B+) mediating lysis of K562 targets. Combinations of MoAbs specific for surface markers on effector cells and for molecules involved in the lytic process, such as granzymes or perforin, can be used in the FCC assay to distinguish and quantify cells mediating lysis of targets.
Figure 9.
Gating strategy use to determine the phenotype of effector cells (left) in FCC assays. NK cells and T cells are identified by their surface markers. On the right, NK cells and T cells are identified as CD69+ or Granzyme B+ cells in a sample of PBMC tested at 50:1 E:T ratio. NK cells show early activation and increase of the Granzyme B level, while CD69 expression and Granzyme B levels remain low in T cells after 3h incubation. This phenotype suggests that NK cells are the active cells in this assay.
Conjugate formation
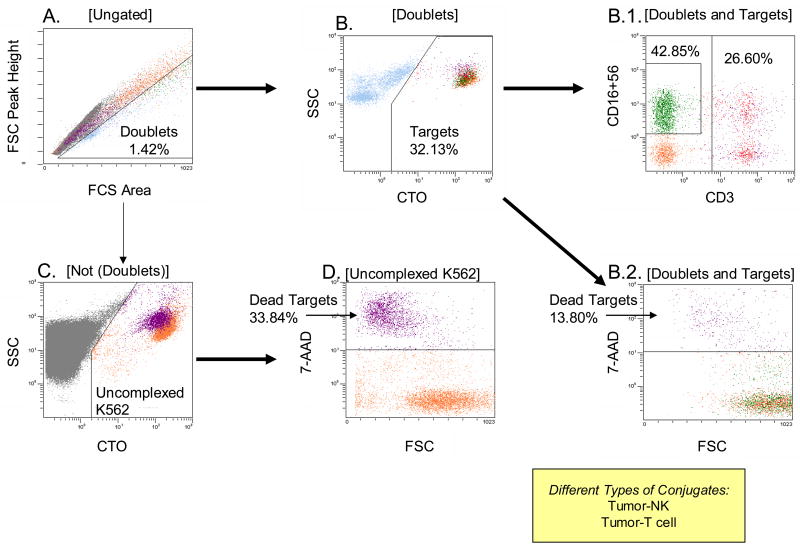
Formation of conjugates precedes lysis and is followed by dissociation of an effector cell from its target. The proportion of conjugated targets at the end of co-incubation reflects the ability of effectors to recognize and bind to the target as well as the kinetics of cytotoxicity. Effectors able to rapidly kill the target dissociate and are likely to re-cycle. Less effective killer cells may dissociate slowly or remain bound longer. Hence, assessing the proportion of conjugates is informative: it characterizes the efficiency of cytotoxic reactions mediated by a batch of effector cells. For example, in Figure 10, only 1.4% of cells formed complexes after 3h co-incubation and only 32.1% of these multi-cellular complexes contained K562 targets. Of K562-containing complexes, only 13.8% were 7-AAD permeant (compared to 33.3% in uncomplexed K562 cells), suggesting that killing occurs after conjugate release. The recycling effectors consisted largely of NK cells (42.5%) and T/NKT cells (26.6%) in this case. Conjugate formation at a selected E:T ratio can be measured throughout the cytotoxicity assay, providing information about kinetics of effector and target interactions.
Figure 10.
Gating strategy used to evaluate conjugate formation between tumor targets and effector cells. In A, single cells (not doublets) are discriminated from cell doublets on the basis of forward scatter integral versus forward scatter peak height. Cell doublets have relatively smaller peak height for a given peak integral. Among doublets, those with highest integral forward scatter contain K562 target cells. In this reaction at the E:T ratio of 50:1 only 1.43% cells form conjugates. In B, doublets in the gate are discriminated into those that contain targets and those that do not. In B1, gate is set on targets in the doublets to determine percentages of doublets containing NK cells or T cells. Tumor-NK conjugates are the most numerous. In B2, gate is also set on targets in the doublets to determine percentages of dead (7-AAD+) targets. Nearly all conjugated targets are alive (i.e., 7-AAD-negative) after 3h of co-incubation. In C, gate is set on cells not in doublets to distinguish uncomplexed targets. In D, gate is set to determine percentages of dead (7-AAD+) targets not in doublets.
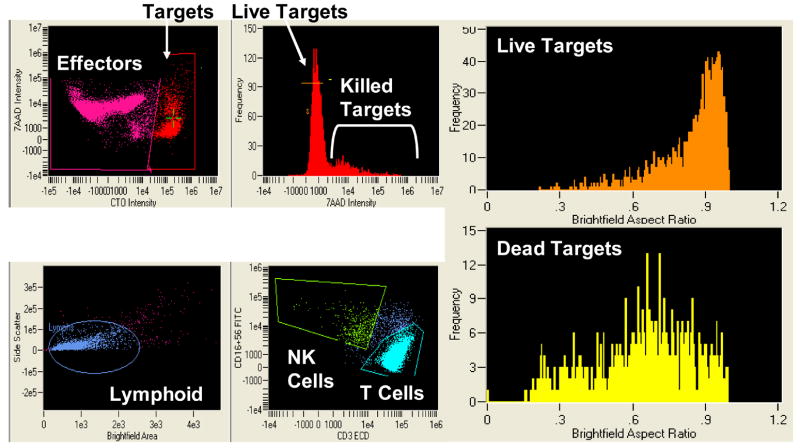
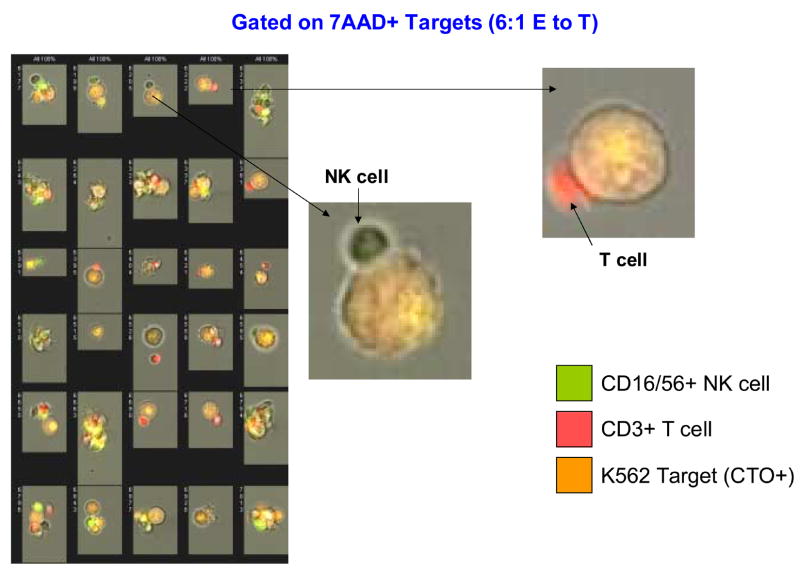
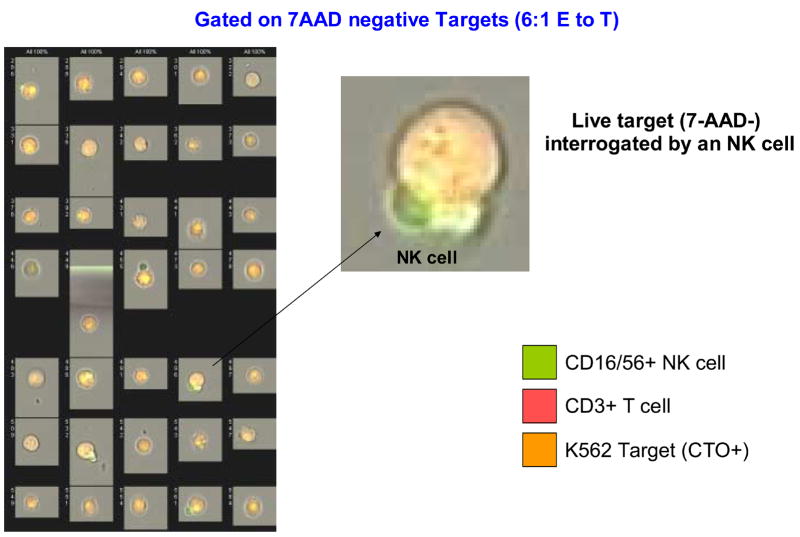
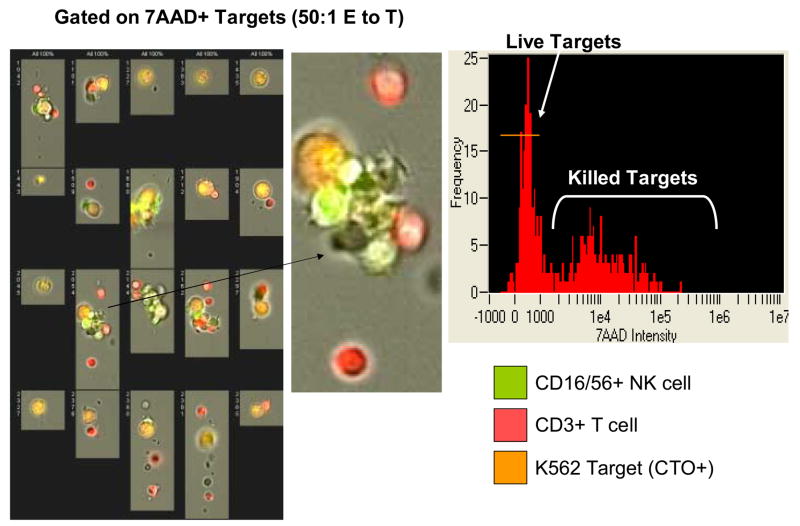
The addition of Amnis to conventional flow cytometry considerably expands the capability of following interactions of effector and targets during the cytotoxicity assay (Figure 11A-D). Imaging allows for direct visualization of T and NK cells interacting with the target. Gating on 7-AAD-permeable targets, it was possible to directly see and enumerate cell clusters containing both NK and T cells (Figure 11D). While dead targets were in clusters, 7-AAD-negative live targets were seen as single cells. In addition, early interactions of effectors with targets were observed as occasional single T or NK cells were in close contact with targets which were still alive.
Figure 11.
Amnis images of NK cells and T cells interacting with K562 targets in the FCC assay. In A, PBMC of a normal donor are tested in the FCC assay at the E to T ratio of 6:1. In the upper left panel targets and effectors are identified on the basis of CTO staining. The targets are scored for 7-AAD uptake (killing) in the top right histogram. The brightfield aspect ratio in live (orange histogram) and dead (yellow histogram) targets reveal the presence of a high proportion of cell doublets and clusters among the dead targets. The aspect ratio measures the ratio of the width to the length of imaged objects. An aspect ratio close to 1 indicates a round object. Smaller aspect ratios indicate an elongated object, such as is formed by a cluster of two or more cells. In the bottom left histogram, a lymphoid population is defined among the CTO negative cells. There are further subdivided into NK cells (CD3- CD16+56+) and T cells (CD3+) in the bottom center histogram. In the upper right panel, the bright field image of live target cells; in the lower right panel, a bright field image of dead targets, showing the presence of a high proportion of cell doublets or clusters among the dead targets. In B, individual images of 7-AAD+ (killed) targets from the same assay (left) and binding of the NK cell or T cell to K562 targets (right). In C, individual images of live (7-AAD negative) targets with an enlarged image of the NK cell interacting with a live target. In D, individual images of 7-AAD+ targets interacting with effector cells at the 50:1 ratio. An enlarged image of a cell cluster shows the presence of NK cells and T cell conjugated a dying target.
Discussion
We have developed a non-radioactive four-color flow cytometry-based assay to simultaneously measure cell-mediated cytotoxicity and the phenotype of killer cells. This method identifies effector cells based on their phenotypic characteristics as: NK (CD3−CD16+CD56+), T (CD3+CD16−CD56−), or NKT (CD3+CD16+CD56+) cells in PBMC as well as in IL-2-stimulated PBMC. Target cells, K562 and Daudi, are labeled with a fluorescent probe, CellTracker Orange (CTO), prior to co-incubation with effector cells. CTO is a thiol-reactive-membrane permeant dye which becomes trapped within the cytosol upon formation of glutathione adducts. Following co-incubation, 7-amino-actinomycin D (7-AAD) is added and taken up by dead target cells. 7-AAD is excluded by live cells with an intact cell membrane but enters the cytoplasm of apoptotic or necrotic cells, where it undergoes a spectral shift upon intercallation into DNA (Perfetto et al, 2006). This assay has several advantages (Table 2) that allow for a better understanding of celluar interactions taking place.
Table 2.
Advantages of the FCC assay
| Marker | Information it provides |
|---|---|
| CellTracker Orange™ CMTMR To measure the number of remaining target | Labels target cells via glutathione S-transferase mediated reaction (permeable through cell membrane) |
| 7-amino-actinomycin D (7-AAD) | Indicated cell death by necrosis and late apoptosis by binding to DNA (impermeable through intact cell membrane) |
| Anti-CD3 Ab | Phenotypes the effectors by marking cell surface antigens |
| Anti-CD16 Ab and anti-CD56 Ab | |
| Anti-CD69 Ab | Early activation marker indicating effector cell functions |
| Anti-Granzyme B Ab | Pro-apoptotic protease marker for target cell lysis |
| Number of E/T Conjugates | Estimates the ability of effector cells to re-bind to the targets |
| Amnis assessment of E/T interactions | Allows for following events during E to T binding |
Cytotoxicity assays are commonly performed in research laboratories and are often used to monitor responses of patients treated with biologic therapies (Whiteside and Herberman, 1994). These assays are difficult to perform, standardize, interpret and reproduce from one laboratory to another. In recent years, these assays have been largely replaced by single-cell cytokine-based ELISPOT or intracellular cytokine flow cytometry assays (Whiteside, 2005; Maino and Picker, 1998). However, spontaneous or antigen-induced cytokine production by effector cells does not inform about the ability of these cells to kill a target, a functional feature that is especially crucial to discern and measure in human diseases. While cytokine production in an ELISPOT assay is a result of the recognition event, it leaves out the fate of the target. As killing of any target entails recognition, binding, conjugate formation, mediator production and death, all of these elements should be examined to fully understand effector-target interactions.
In the past 30 years, the CRA has been used to quantify the ability of lymphocytes to induce death in selected target cells. The CRA has a number of limitations, including the use of radioactivity, a requirement for considerable numbers of effector cells, a lack of information about behavior of single cells, and considerable cost associated with its performance, especially when a scale-up in numbers of assays is necessary. In view of these limitations, attempts have been made to modify cytotoxicity assays and to incorporate new molecular insights into facilitating visualization and quantification of cytotoxicity (Blomberg et al, 1986; Kroesen et al, 1992). The most important of these has been a departure from radioactive targets and replacement of radioactive labeling with fluorescent labels that can be measured by flow cytometry (Derby et al, 2001; Hatam et al, 1994). The cytotoxicity assays for NK cells and cytolytic T cells have been described that quantify target cell death based on the level of various fluorochrome labels released from or retained by the pre-labeled target cells (Derby et al, 2001; Hatam et al, 1994). Others described flow cytometry-based assays using intercalative DNA dyes (Roden et al, 1999) or activation of fluorogenic caspase substrates in the apoptosing target cells (Chahroudi et al, 2003; Liu et al, 2002). In fact, numerous assays measuring apoptosis by flow and image cytometry have been introduced and used to measure effector-mediated cytotoxicity. (Roden et al, 1999; Chahroudi et al, 2003; Goldberg et al, 1999; Ozdemir et al, 2003; Liu et al, 2002; Telford et al, 2004; Hasper et al, 2000). However, activation of apoptotic pathway in target cells is not equivalent to lysis, and apoptosis is but one form of cell death (Lukovic et al, 2003). The CRA recapitulates all molecular events involved in target cell lysis, and this has been the reason for its status as the “gold standard” for cytotoxicity determinations.
While there has been a general trend to substitute CRA by flow cytometry-based measurements, with few exceptions (e.g., Ozdemir et al, 2003), most of the modified cytotoxicity assays were not correlated with CRA. The FCC assay we developed compares favorably with CRA in several respects. Its reproducibility, with a CV ranging from 9 to 13%, is excellent. The linear kinetics allow for a comparison of lytic curve slopes, indicating that responses to the increasing E:T ratios are identical, at least for K562 targets. The uniformly higher intercepts obtained for the flow assay indicate that it is more sensitive than the CRA. The shorter optimal incubation time (3h vs. 4h) probably reflects the more rapid kinetics of the dye influx into an injured cell, compared to efflux of 51Cr-complexed cytosolic proteins. The assay results calculated as the percent specific lysis at the four different E:T ratios can be converted into lytic units, as commonly done for the CRA. The cytotoxicity data can be presented on per effector cell basis, using the absolute cell number values determined in the assay (LU/absolute # NK cells). This is advantageous for discrimination between individuals with few NK cells but strong NK cell activity from those with many NK cells but weak NK cell activity. Further, like the CRA, the flow-based assay discriminates between NC, who have somewhat higher NK cell activity and patients with cancer, whose NK cell activity may be depressed (Figure 7). Thus, the assay is sensitive enough to measure biologic variations, as also indicated by changes observed in NK cell activity of individual donors serially tested overtime (Figure 6). Like the CRA, the flow assay accurately measured LAK activity, using Daudi as cellular targets. These data convincingly show that the FCC assay can be substituted for the CRA to measure NK cell and LAK activities without concerns about comparison to historical data sets.
Recent discovery of inhibitory and activating receptors on NK cells has brought about resurgence of interest in NK cell activity (Ruggeri et al, 2002; Miller et al, 2003). The realization that NK cells are programmed to interact with tissue or hematopoietic cells and play a major role in innate immunity has been reinforced as the understanding of molecular regulatory mechanisms emerged (Smyth et al, 2004). The phenotypic and functional heterogeneity of NK cell subsets re-focused attention on their lytic activity and the molecular interactions between effectors and targets. The new FCC assays offer an opportunity for a multi-parameter definition of these interactions. Specifically, in the assay described here, at least six distinct characteristics of NK cells engaged in killing of a sensitive target can be discerned, as indicated in Table 2. In aggregate, the major advantage of this multi-parameter FCC assay is that it allows for a quantitative phenotypic as well as functional definition of NK cell (or T cell) subsets engaged in an interaction with a cognate target. An additional advantage is that the assay is non-radioactive. The assay can be adapted to measuring various phenotypic attributes of effector cells such as the state of cellular activation, cytokine expression, perforin content or signaling molecule expression, in addition to their absolute numbers and percent specific lysis. One of its most attractive features is the possibility of extending the number of characteristics measured by the use of additional labeled antibodies in polychrome flow cytometry. This opens avenues for investigating mechanisms or molecular events contributing to target lysis by discrete subsets of effector cells.
The FCC assay in its four-color version, as described here, can reproducibly serve as a routine NK cell cytotoxicity assay in a monitoring laboratory, replacing the CRA and providing data on NK cell activity per absolute number of NK cells present in the sample. However, in a research laboratory, it can be adapted to a multicolor, multi-parameter tool capable of providing useful insights into molecular mechanisms of NK cell-, T cell- or NKT cell-mediated death of various targets.
Acknowledgments
The authors are grateful to Dr. Paul Wallace of Roswell Park Cancer Institute, Buffalo, NY for helpful suggestions in the development of the FCC assay and to the staff of the Immunolgic Monitoring and Cell Products Laboratory (IMCPL) at the University of Pittsburgh Cancer Institute for help in assay performance.
Supported in part by NIH grants PO1-DE12321 and RO-1 DE13918 to Theresa L. Whiteside
Footnotes
Publisher's Disclaimer: This is a PDF file of an unedited manuscript that has been accepted for publication. As a service to our customers we are providing this early version of the manuscript. The manuscript will undergo copyediting, typesetting, and review of the resulting proof before it is published in its final citable form. Please note that during the production process errors may be discovered which could affect the content, and all legal disclaimers that apply to the journal pertain.
References
- 1.Andersen MH, Schrama D, Thor Straten P, Becker JC. Cytolytic T cells. J Invest Dermatol. 2006;126:32. doi: 10.1038/sj.jid.5700001. [DOI] [PubMed] [Google Scholar]
- 2.Biron CA, Nguyen KB, Pien GC, Cousens LP, Salazar-Mather TP. Natural killer cells in antiviral defense: function and regulation by innate cytokines. Ann Rev Immunol. 1999;17:189. doi: 10.1146/annurev.immunol.17.1.189. [DOI] [PubMed] [Google Scholar]
- 3.Blomberg K, Granberg C, Hemmila I, Lovgren T. Europium-labelled target cells in an assay of natural killer cell activity. I A novel non-radioactive method based on time-resolved fluorescence. J Immunol Meth. 1986;86:225. doi: 10.1016/0022-1759(86)90457-6. [DOI] [PubMed] [Google Scholar]
- 4.Chahroudi A, Silvestri G, Feinberg MB. Measuring T cell-mediated cytotoxicity using fluorogenic caspase substrates. Methods. 2003;31:120. doi: 10.1016/s1046-2023(03)00121-x. [DOI] [PubMed] [Google Scholar]
- 5.Derby E, Reddy V, Baseler M, Malyguine A. Flow cytometric assay for the simultaneous analysis of cell-mediated cytotoxicity and effector cell phenotype. BioTechniques. 2001;31:660. doi: 10.2144/01313dd03. [DOI] [PubMed] [Google Scholar]
- 6.Di Santo JP. Natural killer cell developmental pathways: a question of balance. Annu Rev Immunol. 2006;24:257. doi: 10.1146/annurev.immunol.24.021605.090700. [DOI] [PubMed] [Google Scholar]
- 7.Goldberg JE, Sherwood SW, Clayberger C. A novel method for measuring CTL and NK cell-mediated cytotoxicity using annexin V and two color flow cytometry. J Immunol Meth. 1999;224:1. doi: 10.1016/s0022-1759(98)00038-6. [DOI] [PubMed] [Google Scholar]
- 8.Graubert TA, DePersio JF, Russell JH, Ley TJ. Perforin/granzyme-dependent and independent mechanisms are both important for the development of graft-versus-host disease after murine bone marrow transplantation. J Clin Invest. 1997;100:904. doi: 10.1172/JCI119606. [DOI] [PMC free article] [PubMed] [Google Scholar]
- 9.Hasper HJ, Weghorst RM, Richel DJ, Meerwaldt JH, Olthuis FM, Schenkeveld CE. A new four-color flow cytometric assay to detect apoptosis in lymphocyte subsets of cultured peripheral blood cells. Cytometry. 2000;40:167. [PubMed] [Google Scholar]
- 10.Hatam L, Schuval S, Bonagura VR. Flow cytometric analysis of natural killer cell function as a clinical assay. Cytometry. 1994;16:59. doi: 10.1002/cyto.990160109. [DOI] [PubMed] [Google Scholar]
- 11.Jedema I, van der Werff NM, Barge RM, Willemze R, Falkenburg JH. New CFSE-based assay to determine susceptibility to lysis by cytotoxic T cells of leukemic precursor cells within a heterogenous target cell population. Blood. 2004;104:2677. doi: 10.1182/blood-2003-06-2070. [DOI] [PubMed] [Google Scholar]
- 12.Kreuwel HT, Morgan DJ, Krahl T, Ko A, Sarvetnick N, Sherman LA. Comparing the relative role of perforin/granzyme versus Fas/Fas ligand cytotoxic pathways in CD8+ T cell-mediated insulin-dependent diabetes mellitus. J Immunol. 1999;163:4335. [PubMed] [Google Scholar]
- 13.Kroesen BJ, Mesander G, Terhaar JG, The TH, deLeij L. Direct visualization and quantification of cellular cytotoxicity using two colour fluorescence. J Immunol Meth. 1992;156:47. doi: 10.1016/0022-1759(92)90009-i. [DOI] [PubMed] [Google Scholar]
- 14.Lanier LL. Natural killer cell receptor signaling. Curr Opin Immunol. 2003;15:308. doi: 10.1016/s0952-7915(03)00039-6. [DOI] [PubMed] [Google Scholar]
- 15.Liu L, Chahroudi A, Silvestri G, Wernett ME, Kaiser WJ, Safrit JT, Komoriya A, Altman JD, Packard BZ, Feinberg MB. Visualization and quantification of T cell-mediated cytotoxicity using cell-permeable fluorogenic caspase substrates. Nat Med. 2002;8:185. doi: 10.1038/nm0202-185. [DOI] [PubMed] [Google Scholar]
- 16.Lukovic D, Komoriya A, Packard BZ, Ucker DS. Caspase activity is not sufficient to execute cell death. Exp Cell Res. 2003;289:384. doi: 10.1016/s0014-4827(03)00289-1. [DOI] [PubMed] [Google Scholar]
- 17.Maino VC, Picker LJ. Identification of functional subsets by flow cytometry: intracellular detection of cytokine expression. Cytometry. 1998;34:207. doi: 10.1002/(sici)1097-0320(19981015)34:5<207::aid-cyto1>3.0.co;2-j. [DOI] [PubMed] [Google Scholar]
- 18.Miller JS, Soignier Y, Panoskaltsis-Mortari A, McNearney SA, Yun GH, Fautsch SK, McKenna D, Le C, Defor TE, Burns LJ, Orchard PJ, Blazar BR, Wagner JE, Slungaard A, Weisdorf DJ, Okazaki IJ, McGlave PB. Successful adoptive transfer and in vivo expansion of human haploidentical NK cells in patients with cancer. Blood. 2003;105:3051. doi: 10.1182/blood-2004-07-2974. [DOI] [PubMed] [Google Scholar]
- 19.Morales A, Ottenhof PC. Clinical application of a whole blood assay for human natural killer (NK) cell activity. Cancer. 1983;52:667. doi: 10.1002/1097-0142(19830815)52:4<667::aid-cncr2820520417>3.0.co;2-c. [DOI] [PubMed] [Google Scholar]
- 20.Ozdemir O, Ravindranath Y, Savasan S. Cell-mediated cytotoxicity evaluation using monoclonal antibody staining for target or effector cells with annexin V/propidium iodide colabeling by fluorosphere-adjusted counts on three-color flow cytometry. Cytometry Part A. 2003;56A:53. doi: 10.1002/cyto.a.10081. [DOI] [PubMed] [Google Scholar]
- 21.Perfetto SP, Chattopadhyay PK, Lamoreaux L, Nguyen R, Ambrozak D, Koup RA, Roederer M. Amine reactive dyes: an effective tool to discriminate live and dead cells in polychromatic flow cytometry. J Immunol Meth. 2006;313:199. doi: 10.1016/j.jim.2006.04.007. [DOI] [PubMed] [Google Scholar]
- 22.Roden MM, Lee KH, Panelli M, Marincola FM. A novel cytolysis assay using fluorescent labeling and quantitative fluorescent scanning technology. J Immunol Meth. 1999;226:29. doi: 10.1016/s0022-1759(99)00039-3. [DOI] [PubMed] [Google Scholar]
- 23.Roder JC, Haliotis T, Klein M, Korec S, Jett JR, Ortaldo J, Herberman RB, Katz P, Fauci AS. A new immunodeficiency disorder in humans involving NK cells. Nature. 1980;284:553. doi: 10.1038/284553a0. [DOI] [PubMed] [Google Scholar]
- 24.Ruggeri L, Capanni M, Urbani E, Perruccio K, Shlomchik WD, Tosti A, Posati S, Rogaia D, Frassoni F, Aversa F, Martelli MF, Velardi A. Effectiveness of donor natural killer cell alloreactivity in mismatched hematopoietic transplants. Science. 2002;295:2097. doi: 10.1126/science.1068440. [DOI] [PubMed] [Google Scholar]
- 25.Rutter CM, Elashof RM. Analysis of longitudinal data: random coefficient regression modeling. Statistics Med. 1994;13:1211. doi: 10.1002/sim.4780131204. [DOI] [PubMed] [Google Scholar]
- 26.Shresta S, Pham CT, Thomas DA, Graubert TA, Ley TJ. How do cytotoxic lymphocytes kill their targets? Curr Opin Immunol. 1998;10:581. doi: 10.1016/s0952-7915(98)80227-6. [DOI] [PubMed] [Google Scholar]
- 27.Smyth MJ, Crowe NY, Hayakawa K, Takeda H, Yagita H, Godfrey DI. NKT cells - conductors of tumor immunity. Curr Opin Immunol. 2002;14:165. doi: 10.1016/s0952-7915(02)00316-3. [DOI] [PubMed] [Google Scholar]
- 28.Smyth MJ, Swann J, Kelly JM, Cretney E, Yokoyama WM, Diefenbach A, Sayers TJ, Hayakawa Y. NKG2D recognition and perforin effector function mediate effective cytokine immunotherapy of cancer. J Exp Med. 2004;200:1325. doi: 10.1084/jem.20041522. [DOI] [PMC free article] [PubMed] [Google Scholar]
- 29.Telford WG, Komoriya A, Parckard BZ. Multiparametric analysis of apoptosis by flow and image cytometry. Meth Mol Biol. 2004;263:141. doi: 10.1385/1-59259-773-4:141. [DOI] [PubMed] [Google Scholar]
- 30.Von Zons P, Crowley Novick P, Friberg D, Bell M, Koldovsky U, Whiteside TL. A comparison of europium- and chromium-release assays: Cytotoxicity in healthy individuals and patients with cervical carcinoma. Clin Diag Lam Immunol. 1997;4:202. doi: 10.1128/cdli.4.2.202-207.1997. [DOI] [PMC free article] [PubMed] [Google Scholar]
- 31.Whiteside TL, Bryant J, Day R, Herberman RB. Natural killer cytotoxicity in the diagnosis of immune dysfunction: Criteria for a reproducible assay. J Clin Lab Analysis. 1990;4:102. doi: 10.1002/jcla.1860040207. [DOI] [PubMed] [Google Scholar]
- 32.Whiteside TL, Herberman RB. Role of human natural killer cells in health and disease. Clin Diag Lab Immunol. 1994;1:125. doi: 10.1128/cdli.1.2.125-133.1994. [DOI] [PMC free article] [PubMed] [Google Scholar]
- 33.Whiteside TL, Herberman RB. Role of natural killer cells in immune surveillance of cancer. Curr Opin Immunol. 1995;7:704. doi: 10.1016/0952-7915(95)80080-8. [DOI] [PubMed] [Google Scholar]
- 34.Whiteside TL. ELISPOT Assays. In: Nagorsen D, Marincola FM, editors. Analyzing T Cell Responses. Springer Publishers; Dordrecht, The Netherlands: 2005. pp. 143–156. [Google Scholar]


