

Abstract
We tested the hypothesis that the MEK/Erk/caldesmon phosphorylation cascade regulates PKC-mediated podosome dynamics in A7r5 cells. We observed the phosphorylation of MEK, Erk and caldesmon, and their translocation to the podosomes upon phorbol dibutyrate (PDBu) stimulation, together with the nuclear translocation of phospho-MEK and phospho-Erk. After MEK inhibition by U0126, Erk translocated to the interconnected actin-rich columns but failed to translocate to the nucleus, suggesting that podosomes served as a site for Erk phosphorylation. The interconnected actin-rich columns in U0126-treated, PDBu-stimulated cells contained α-actinin, caldesmon, vinculin, and metalloproteinase-2. Caldesmon and vinculin became integrated with F-actin at the columns, in contrast to their typical location at the ring of podosomes. Live-imaging experiments suggested the growth of these columns from podosomes that were slow to disassemble. The observed modulation of podosome size and life time in A7r5 cells overexpressing wild-type and phosphorylation-deficient caldesmon-GFP mutants in comparison to untransfected cells suggests that caldesmon and caldesmon phosphorylation modulate podosome dynamics in A7r5 cells. These results suggest that Erk1/2 and caldesmon differentially modulate PKC-mediated formation and/or dynamics of podosomes in A7r5 vascular smooth muscle cells.
Keywords: Actin, Adhesion, Atherosclerosis, Cytoskeleton, Metalloproteinase, Remodeling
Introduction
Matrix metalloproteinases are key enzymes involved in extracellular matrix remodeling and migration of vascular smooth muscle cells in vascular diseases such as atherosclerosis [1]. Podosomes have been identified as the intracellular structures that regulate the release of metalloproteinases in a large number of cell types including vascular smooth muscle cells [2, 3, 4, 5, 6, 7]. Recent findings have implicated the involvement of podosomes in the invasion of vascular smooth muscle cells in proliferative vascular diseases such as atherosclerosis and restenosis [8]. A7r5 vascular smooth muscle cells have been studied extensively as a model system for investigating the mechanisms of podosome formation by several laboratories [3, 4, 9, 10, 11]. Conventional PKC has been found to mediate phorbol dibutyrate (PDBu)-stimulated podosome formation in A7r5 vascular smooth muscle cells [4]. Similarly, Gatesman et al. [12] showed that PKC-α also mediated phorbol-stimulated podosome formation in CaOV3 cells. PKC is known to regulate the actin cytoskeleton by initiating phosphorylation cascades [13]. PKC-mediated MEK/Erk1/2/caldesmon phosphorylation cascade is a well documented actin filament-based regulatory mechanism of vascular smooth muscle contraction [14, 15]. However, it remains unknown whether the MEK/Erk/caldesmon phosphorylation cascade plays a regulatory role in PKC-mediated formation of podosomes in A7r5 vascular smooth muscle cells.
Caldesmon is an actin-binding protein that is capable of inhibiting actomyosin ATPase activity, stabilizing actin filaments against severing by gelsolin, and inhibiting Arp2/3-mediated actin polymerization in vitro [16, 17, 18, 19]. It is noteworthy that gelsolin-mediated severing of actin filaments and Arp2/3-mediated actin polymerization are essential processes for the formation of podosomes as demonstrated by knockout studies [20, 21]. Furthermore, caldesmon is one of the few actin-binding proteins that are associated with podosomes but excluded from focal adhesions [22]. Erk-dependent phosphorylation of caldesmon has been shown to reverse the ability of the actin-binding carboxyl-terminal fragment of caldesmon to stabilize actin filaments against actin-severing proteins [23]. Recently, Eves et al. [10] showed that overexpression of caldesmon suppressed PDBu-stimulated podosome formation, whereas siRNA knock-down of caldesmon expression facilitated PDBu-stimulated podosome formation in A7r5 cells. However, their study did not address the role of Erk-dependent caldesmon phosphorylation in the regulation of podosome formation and dynamics.
The binding of caldesmon to actin is known to be regulated by phosphorylation and calmodulin-binding [24]. Recently, Kordowska et al. [25] showed that phosphorylation of the S497 and S527 serine residues of l-caldesmon facilitated the disassembly of actin stress fibers and postmitotic spreading in fibroblasts, suggesting that caldesmon phosphorylation regulates actin remodeling in fibroblasts. Webb et al. [26] showed that Erk1/2 MAPK regulated the disassembly of focal adhesions in mouse MEF cells, and that MEK1/2 inhibition by U0126 significantly decreased the disassembly of paxillin from focal adhesions. Since Erk is capable of phosphorylating multiple proteins in addition to caldesmon, it is possible that Erk and caldesmon may exert differential effects on the formation and dynamics of podosomes. In this study, we hypothesized that the MEK/Erk/caldesmon phosphorylation cascade regulates the formation and dynamics of podosomes in A7r5 vascular smooth muscle cells in response to PKC activation by PDBu. We tested this hypothesis by studying the phosphorylation and translocation of MEK1/2, Erk1/2 and caldesmon during the formation of podosomes in A7r5 cells in response to PDBu stimulation, investigating the effect of MEK inhibition by U0126 on the formation and dynamics of podosomes, and investigating the effects of overexpressing wild-type or phosphorylation-deficient caldesmon-GFP mutants on the size and life time of podosomes in live A7r5 cells.
Materials and Methods
Cell Culture
A7r5 rat vascular smooth muscle cells were purchased from ATCC (Manassas, VA), and grown in low-glucose (1000 mg/ml) DMEM without phenol red, supplemented with 10% fetal bovine serum, GlutaMAX™-I Supplement, and penicillin/streptomycin at 37°C and 10% CO2. All cell culture reagents were purchased from Invitrogen (Grand Island, NY). For immunofluorescence microscopy studies, cells were cultured on 15-mm glass coverslips. Cells were washed three times in phosphate-buffered saline (PBS) of the following composition: 138 mM NaCl, 26 mM KCl, 84 mM Na2HPO4, 14 mM KH2PO4, pH 7.4, then fixed in 4% paraformaldehyde (Electron Microscopy Sciences, Hatfield, PA) in PBS for 15 min, and extracted with 0.3% Triton X-100 in PBS for 10 min. Triton-extracted cells were labeled with primary antibodies for 1 hr, washed three times in PBS, incubated with secondary antibodies, washed three times in PBS, and then mounted on slides with FluorSave™ Reagent (Calbiochem, San Diego, CA). Podosome formation in cultured A7r5 cells was induced by 1 μM phorbol-12, 13-dibutyrate (PDBu) (Sigma) in serum-free medium. In U0126 experiments, unstimulated cells were treated with 10 μM U0126 (Cell Signaling, Beverly, MA) in serum-free medium for 2 hrs. PDBu-stimulated cells were pretreated with serum-free medium containing 10 μM U0126 for 1hr, and then treated with serum-free medium containing both 1 μM PDBu and 10 μM U0126 for another 1hr. In PDGF experiments, cells were serum-starved for 2 hours and then treated with 20 ng/ml PDGF for 3 minutes.
Transfection and Overexpression of GFP Fusion Proteins
Full-length non-muscle caldesmon-GFP cDNA construct in pCGN vector was a generous gift from Dr. David Helfman at the University of Miami [27]. Human fibroblast l-CaD (Gene Bank #M64110) in pCB6hx plasmid was a gift from Dr. Jim Lin (University of Iowa, Iowa City, IA). CaD-containing DNA was released from the whole plasmid by NcoI digestion, blunted by T4 DNA polymerase and followed by treatment with BamHI to generate blunt-BamHI CaD insert. The resulting insert was subcloned into BspEI (after making it blunt with T4 DNA polymerase) and BamHI sites of MCS in mammalian expression vector pEGFPC1 (Clontech). Sequencing confirmed the correct EGFP open reading frame and the stop codon. Mutation of S497 and S527 to Ala was performed using the Altered SitesR II in vitro Mutagenesis System (Promega, Madison, WI) with the following primers: 5′-ATG GAA ACA AGG CAC CTG CTC CCA-3′ for S497 to Ala; 5′-ATA AGG TCA CTG CCC CCA CTA AG-3′ for S527 to Ala.. Correct mutagenesis was confirmed by sequencing. On the day of the transfection experiment, A7r5 cells (~90% confluent) cultured in each 60-mm petri dish were treated with 4.5 ml serum-free medium plus 0.5 ml transfection solution consisting of 0.5ml serum-free medium, 4.0 μg caldesmon-GFP construct and 10μl Lipofectamine 2000 (Invitrogen, Grand Island, NY). After 6 hrs of transfection, the serum-free medium was replaced by a growth medium containing 10% serum. On the next day, cells were trypsinized and then either plated into 60-mm petri dishes for SDS-PAGE or cultured on coverslips for immunofluorescence microscopy. On the 3rd day after transfection, cells in 60-mm petri dishes were lysed to prepare protein samples for SDS-PAGE, whereas cells on coverslips were treated with or without PDBu followed by immunofluorescence Labeling.
Confocal Immunofluorescence Microscopy, Three-Dimensional Image Reconstruction, and Live Cell Imaging
Immunofluorescence images were captured on a Leica TCS SP2 AOBS confocal microscope equipped with a digital camera controlled by the manufacturer’s Leica Confocal Software package version 2.5 using a 63 × 1.4 Plan Apochromatic oil-immersion objective (Leica Microsystems, Exton, PA). Fluorescence intensity measurements and three-dimensional image reconstructions were performed in MetaMorph Imaging software version 6.1 (Universal Imaging, Chesterfield, PA). For live cell imaging experiments, cells were grown in 35 mm glass-bottomed Petri dishes (World Precision Instruments, Sarasota, Florida). These dishes were mounted in a heating chamber superfused with 10% CO2 at 37°C and placed on the stage of a Zeiss Axiovert 200 MAT Light Microscope (Carl Zeiss MicroImaging, Thornwood, NY). Time-lapse series of phasecontrast or fluorescence images were taken by a highly sensitive monochrome camera (Hamamatsu ORCA-ER) driven by Axiovision software version 4.2, using 40 × 1.3 Plan Neofluor oil-immersion objective (Carl Zeiss MicroImaging, Thornwood, NY).
SDS-Polyacrylamide Gel Electrophoresis (SDS-PAGE) and Western Blot Analysis
For SDS-PAGE experiments, A7r5 cells were lysed and scraped at 4°C in a cell lysis buffer of the following composition: 1% Triton X-100, 50 mM Hepes, 150 mM NaCl, 5 mM EDTA, 5 mM EGTA, 20 mM NaF, 20 mM sodium pyrophosphate, 1mM PMSF, 1mM Na3VO4; pH 7.4. DC protein assays (Bio-Rad Laboratories, Hercules, CA) were performed on cell lysate samples. Equal amount of protein from each sample was run on each lane of 7.5% SDS-PAGE gels. After gel electrophoresis, proteins were transferred to nitrocellulose membranes for Western blot analysis. Proteins on the membranes were labeled with primary antibodies overnight at 4°C, then labeled by peroxidase-conjugated secondary antibodies, and visualized by Enhanced Chemiluminescence (ECL) detection reagents (Amersham Biosciences, Piscataway, NJ).
Scanning Electron Microscopy
Cells grown on 15mm glass coverslips were fixed for 2 hr at room temperature with 4% paraformaldehyde and 2% gluteraldehyde in 0.1M sodium cacodylate buffer at pH 7.4. After 3 washes in 0.1 M sodium cacodylate buffer (pH 7.4) they were post-fixed with 2% osmium tetroxide in buffer for 1 hr at room temperature. Following post-fixation, the cells were dehydrated in a graded series of ethanol and critically point dried using a LADD 29000. The coverslips were coated with 15nm of gold palladium with an Emitech K550 and viewed on a Hitachi S-2700 at 5kV.
Mathematical Modeling of Podosome Dynamics
The following model considers a single podosome in exchange with the substrates in the microenvironment as shown in the following kinetic scheme.
Substrates ↔ Podosome
In this microenvironment, substrates may assemble to allow the growth of the single podosome, and the single podosome may disassemble to form substrates as described by the following differential equations.
In these equations, kon (in min−1) is the apparent rate constant that represents the ratio of total flux going from substrates to the podosome divided by substrates mass; and Koff (in min−1) is the rate constant that represents the ratio of total flux going from the podosome back to substrates divided by podosome mass.
Podosome mass can reach a steady state when podosome assembly is balanced by podosome disassembly. This steady state is analogous to the steady-state level of protein phosphorylation that is maintained by kinase and phosphatase activities in a cell. In a steady state, the following equation predicts podosome mass as a function of Maximum Podosome Mass, kon, and koff.
| (1) |
Maximum Podosome Mass is limited by the total mass of substrates available for podosome growth in the microenvironment. This equation predicts that an increase in podosome mass can result from an increase in kon, or a decrease in koff. However, these two alternatives will predict different changes in podosome life time. Before addressing this point, the following analysis relates podosome mass to podosome size which is the variable measured in this study.
Podosome Mass is related to podosome size and podosome height as follows.
Podosome Mass α (Podosome Size)2 × Podosome Height
Assuming that podosome height is relatively constant as suggested by the findings in this study, the above relation may be simplied as follows.
Podosome Mass α (Podosme Size)2
Substituting this relation into equation (1) yields the following equation between podosome size and the rate constants.
| (2) |
To model the podosome life time that was measured in this study, we related podosome life time to mean residence time as defined by the rate constants, kon and koff in equation (3), based on the experimental definition that podosome life time describes a podosome from it first appearance to its disappearance. In compartmental analysis, mean residence time (1/koff) is the average time for a molecule to stay in a compartment. The rate constant, koff may be considered as the probability per time for a molecule to leave a compartment. For a given amount of time, some molecules will leave a compartment whereas other molecules will remain in the compartment. Mean residence time is the average time for the population of molecules to reside in a compartment. Mean residence time seems to be the simplest approach to finding a mathematical correlate to the podosome life-time that was measured in this study. Alternatively, one may consider five half-times for elimination as life time, which is 5 × ln(2)/koff. The difference between these two approaches is the scaling factor of 5 × ln(2), so that the absolute values of kon and koff may be adjusted by the scaling factor. In both approaches, the predicted changes in kon and koff will remain the same.
| (3) |
In a kinetic compartment, life time is the time it takes to turn over 100% of the molecules in a compartment, whereas half-time is the time it takes to turn over 50% of the molecules in a compartment. Altogether, there are three variables in these equations (2) and (3), namely, Maximum Podosome Size, kon, and koff. To reduce the degrees of freedom, we constrained Maximum Podosome Size to be the same for all experimental conditions based on the rationale that maximum podosome size is limited by the constituent proteins in the microenvironment of podosome formation. We then iterated values of kon and koff to first model the podosome life time data using equation (3), and then substituted the same values of kon and koff into equation (2) to calculate podosome size for comparison with experimental data until the model fitted the data within 10% (Fig. 8C, line). We constrained maximum podosome size at 16 μm for all data points, and found that >1000 fold change in koff together with <10 fold in kon was necessary to model the data (Fig. 8D).
Figure 8.
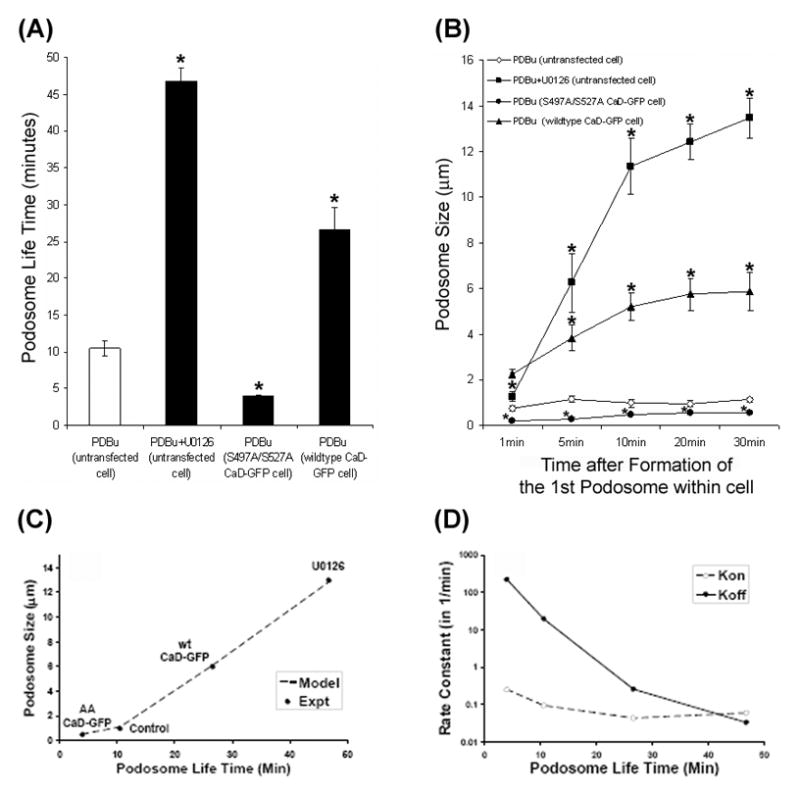
Modulation of podosome life time and podosome size in live A7r5 cells. Panel A shows the life times of podosomes or interconnected actin-rich columns in untransfected, untreated cells, U0126-treated cells, cells overexpressing (S497A/S527A) caldesmon-GFP, and cells overexpressing wild-type caldesmon-GFP as estimated from frame-by-frame analysis of the time-lapse images shown in Fig. 7 and Movies 1 to 6. Bars and vertical lines represent mean ± standard error (n = 30). Panel B shows the size of podosomes or interconnected actin-rich columns in the four groups of cells at 1, 5, 10, 20, and 30 min after the beginning of podosome formation as estimated from frame-by-frame analysis of time-lapse images. Symbols and vertical lines represent mean ± standard errors (n = 10). Asterisks indicate significant difference from untransfected cells (p < 0.05). Panel C shows the correlation between podosome size and podosome life time as measured in the experiments (symbols) and predicted by the minimal model of podosome dynamics (broken line). Panel D shows changes in the rate constants for podosome assembly (kon, open symbols), and podosome disassembly (koff, closed symbols) that were necessary for modeling the experimental data shown in panel C.
Antibodies
Erk2 monoclonal, PKC-α polyclonal, phospho-cofilin polyclonal, MMP-2 monoclonal, and GFP polyclonal antibodies were purchased from Santa Cruz Biotechnology (Santa Cruz, CA). Phospho-MEK1/2 polyclonal and phospho-ERK1/2 polyclonal antibodies were purchased from Cell Signaling Technology (Beverly, MA). Caldesmon polyclonal antibody was generated in the laboratory of one of us [25]. Phospho-caldesmon polyclonal antibody was purchased from Upstate Biotechnology (Charlottesville, VA), as described by D’Angelo et al. [28] and Franklin et al. [29]. Anti-α-actinin and anti-vinculin primary antibodies, and peroxidase-conjugated secondary antibodies were purchased from Sigma-Aldrich (St. Louis, MO). Alexa Fluor 488 and Alexa Fluor 568-conjugated secondary antibodies and phalloidin were purchased from Molecular Probes (Eugene, OR).
Statistics
Numerical data are presented as means ± SE; n represents the number of cells. Student’s t-test was used for the comparison of two means (P < 0.05 considered significant).
Results
PDBu Stimulated MEK/Erk1/2/Caldesmon Phosphorylation and Translocation in A7r5 Cells
In these experiments, A7r5 cells were either unstimulated or stimulated with 1μM PDBu in serum-free medium for 1 hour. Whole cell lysates were then analyzed by SDS-PAGE and western blotting. As shown in Figs. 1A and 1B (PDBu −), some basal levels of phospho-Erk1/2 and phospho-caldesmon were detectable in unstimulated cells. As shown in Figs. 1A and 1B, “PDBu +”, PDBu stimulated parallel increases in both Erk1/2 and caldesmon phosphorylation. Labeling of the same blot using anti-Erk2 and anti-caldesmon antibodies demonstrated the similarity in loading of the unstimulated and PDBu-stimulated cell lysates (Fig. 1A and 1B, bottom rows).
Figure 1.
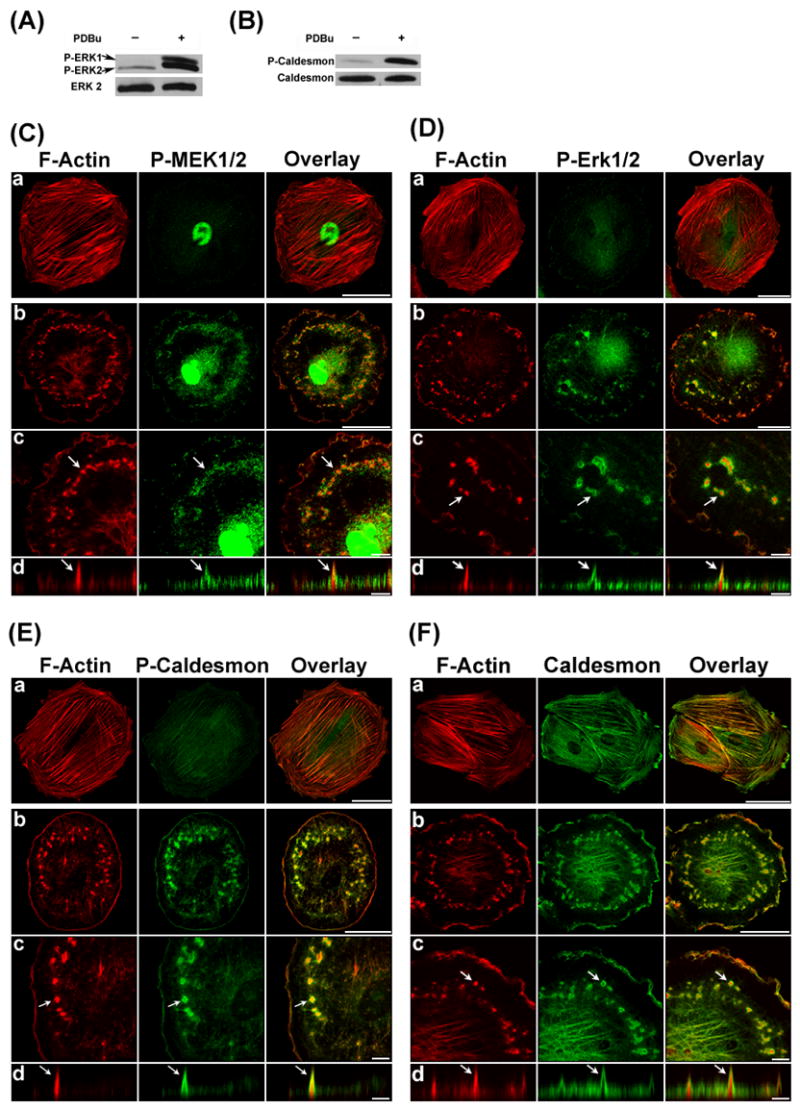
PDBu stimulated MEK/Erk1/2/caldesmon phosphorylation and translocation in A7r5 Cells. Panels A and B show the Western blots of Erk1/2 and caldesmon phosphorylation in unstimulated cells ( PDBu−) and PDBu-stimulated cells (PDBu+). Labeling of total Erk2 and caldesmon (bottom rows) are also included as loading controls. Panels C, D, E, and F show the confocal fluorescence microscopy of F-Actin, phospho-MEK1/2, phospho-Erk1/2, phospho-caldesmon, and total caldesmon respectively in unstimulated cells (row a) and PDBu stimulated cells (rows b to d). F-Actin was labeled in red by Alexa 568-conjugated phalloidin. Phospho-MEK1/2, phospho-Erk1/2, phospho-caldesmon, and total caldesmon were labeled in green by specific primary antibodies, followed by Alexa 488-conjugated secondary antibody. Podosomes indicated by arrows (row c) were enlarged and scanned along the orthogonal axis (row d), showing the columnar structure of podosomes having an F-actin core surrounded by phospho-MEK1/2, phospho-Erk1/2, phospho-caldesmon, and total caldesmon. Size bars represent 40 μm in rows a and b, and 8 μm in rows c and d. Z distances in row d of panels C, D, E, and F were amplified to show the podosome core and ring structure clearly. Actual podosome heights were ~3 μm in this figure.
The translocation of phospho-MEK1/2 and phospho-Erk1/2 in response to PDBu stimulation was imaged by confocal immunofluorescence microscopy and shown in Figs. 1C and 1D. In unstimulated cells, phospho-MEK1/2 was detected in the nucleus (Fig. 1C-a), whereas basal level of phospho-Erk1/2 was detected at the perinuclear region (Fig. 1D-a). In PDBu-stimulated cells, both phospho-MEK1/2 and phospho-Erk1/2 became colocalized at the podosomes and nucleus (Figs. 1C-b, c and 1D-b, c). Confocal imaging with Z-sectioning indicated that both phospho-MEK1/2 and phospho-Erk1/2 colocalized at the ring of podosomes (Figs. 1C-d and 1D-d). Z distances in Figs. 1C-d and 1D-d were amplified to show the core and ring structures of podosomes more clearly. Actual heights of podosome were ~3μm in Figs. 1C-d and 1D-d. Results shown in Fig. 1 indicated the colocalization of phospho-MEK1/2 and phospho-Erk1/2 at the podosomes.
The translocation of phospho-caldesmon in response to PDBu stimulation is shown in Fig. 1E. In unstimulated cells, basal level of phosphor-caldesmon was detectable at the actin stress fibers (Fig. 1E-a). Upon PDBu stimulation, phospho-caldesmon became localized at the ring of podosomes as shown by confocal imaging with Z-sectioning data (Fig. 1E b–d). Z distance in Fig. 1E-d was amplified to show the core and ring structures of podosomes more clearly. Actual heights of podosome were ~3μm in Fig. 1E-d. Since most caldesmon became phosphorylated in response to PDBu stimulation, the distributions of total caldesmon (Fig. 1F) and phospho-caldesmon (Fig. 1E) were similar. The observed location of caldesmon at the ring of podosomes in this study is different from the conclusion of Eves et al. [10] that caldesmon is a prominent component of the actin core of PDBu-induced podosomes in A7r5 cells. One possible explanation for this discrepancy is the existence of a gradient in caldesmon/actin ratio increasing from the core towards the ring of a podosome, possibly as a result of differential temporal dynamics of actin polymerization and caldesmon recruitment to the podosomes. Accordingly, a relatively strong labeling of caldesmon may result in the appearance of caldesmon in both the core and ring of podosomes as observed by Eves et al. [10], whereas a relatively weak labeling of caldesmon may result in the appearance of caldesmon only in the ring of podosomes as observed in this study.
MEK1/2 Inhibition by U0126 Abolished PDBu-Stimulated Erk1/2 and Caldesmon Suprabasal Phosphorylation
Conventional PKC has been shown to mediate PDBu-stimulated podosome formation in A7r5 cells [4], and PKC-mediated activation of MEK/Erk/caldesmon phosphorylation cascade has been well documented in vascular smooth muscle cells [14, 15]. Therefore, MEK1/2 inhibition by U0126 was expected to inhibit Erk1/2 and caldesmon phosphorylation in A7r5 cells. In these experiments, A7r5 cells were pretreated with 10 μM U0126 in serum-free medium for 1 hr, and then either unstimulated or stimulated by 1 μM PDBu in the same medium containing 10 μM U0126 for another hour. Figs. 2A and 2B (top rows) show the complete inhibition of PDBu-stimulated Erk1/2 and caldesmon phosphorylation in U0126-treated cells. Labeling the same blot using anti-Erk2 and anti-caldesmon antibodies demonstrated the similarity in loading of unstimulated and PDBu-stimulated cell lysates in this experiment (Figs. 2A and 2B, bottom rows).
Figure 2.
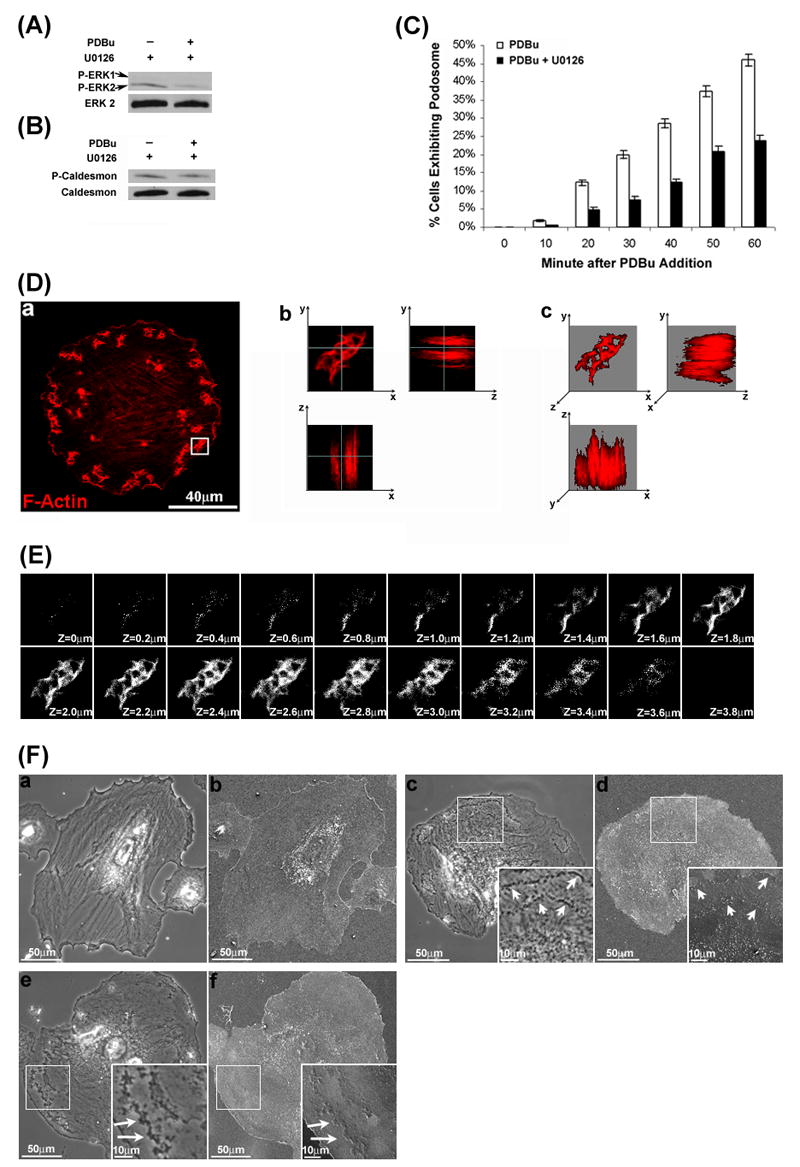
MEK1/2 Inhibition by U0126 abolished PDBu-stimulated Erk1/2 and caldesmon phosphorylation, decreased the percentage of podosome-forming cells, and induced the formation of interconnected actin-rich columns in A7r5 cells. The Western blots in panels A and B show that U0126 abolished PDBu-stimulated phosphorylation of both Erk1/2 and caldesmon. Labeling of total Erk2 and caldesmon are also included as loading controls. Panel C shows the inhibitory effect of U0126 on the percentage of cells forming podosomes in response to PDBu stimulation. A7r5 cells were either incubated in serum-free medium or pretreated with U0126 for 1 hr before PDBu stimulation and cell counting. Cells were fixed at 0 min (unstimulated), 10, 20, 30, 40, 50, or 60 min after PDBu stimulation. Podosomes were identified by labeling the core protein, F-Actin using Alexa 568-conjugated phalloidin, and then imaged by confocal fluorescence microscopy. Cells exhibiting a minimum of three podosomes were counted as positive. Bars and vertical lines in panel C represent means ± SE (n = 200). Panel D-a shows the two-dimensional distribution of interconnected actin-rich columns in a U0126-treated, PDBu-stimulated cell. In this experiment, A7r5 cells were pretreated with U0126 for 1 hour, followed by PDBu stimulation in the presence of U0126 for another 1 hour. Podosomes were identified by labeling the core protein, F-Actin using Alexa 568-conjugated phalloidin and imaged by confocal fluorescence microscopy. Panels D-b (orthogonal view) shows the columnar structure within interconnected actin-rich columns in Y-Z and X-Z planes as imaged by confocal fluorescence microscopy with Z-sectioning. White lines denote orthogonal positions. Panel D-c shows the three-dimensional reconstruction of the same interconnected actin-rich columns by maximum intensity projections, revealing the interconnections among actin-rich columns. Panel E shows serial optical sections of the same interconnected actin-rich columns from top to bottom. The Z distance between optical sections was 0.2 μm. Panel F shows the phase-contrast (a, c, e) and scanning electron microscopic (b, d, f) images of an untreated cell (a, b), PDGF-stimulated cell (c,d), and U0126-treated, PDBu-stimulated cell (e, f). Insets in panels F-c, F-d, F-e, and F-f represent higher magnification of selected regions of a cell.
U0126 Decreased the Percentage of Podosome-Forming Cells and Induced the Formation of Interconnected Actin-Rich Columns
Overexpression of l-caldesmon has recently been shown to suppress PDBu-stimulated podosome formation in A7r5 cells [10]. Since the function of caldesmon is regulated by phosphorylation [18], we investigated the effect of U0126 on the percentage of cells forming podosomes in response to PDBu stimulation in A7r5 cells. In these experiments, A7r5 cells were either untreated or pretreated by 10 μM U0126 for 1 hr, and then stimulated by 1 μM PDBu in the same conditions. Untreated and U0126-treated cells were fixed at 0 min (unstimulated), 10min, 20min, 30min, 40min, 50min or 60min after the addition of PDBu, and then labeled for F-actin using Alexa 568-conjugated phalloidin. Using confocal fluorescence microscopy, we estimated the percentage of podosome-forming cells by counting cells exhibiting at least three podosomes as positive. As shown in Fig. 2C, in untreated cells, the percentage of cells expressing podosomes increased from 1.8 ± 0.3 % at 10 min to 46 ± 2 % at 60 min after PDBu stimulation. In contrast, in U0126-treated cells, the percentage of cells expressing podosomes increased from 0.5 ± 0.2 % at 10 min to 24 ± 2% at 60 min after PDBu stimulation. At all measured times, the percentage of podosome-forming cells was significantly lower in U0126-treated cells relative to untreated cells (p < 0.05).
During the cell counting procedure, we noticed the formation of actin-rich structures in U0126-treated cells. Majority (>70%) of U0126-treated cells, when responsive, formed interconnected actin-rich columns in response to PDBu stimulation (data not shown). To better resolve the morphology of these actin-rich columns, we imaged U0126-treated, PDBu-stimulated cells labeled with Alexa 568-phalloidin using a higher magnification (100x) objective together with 4X digital zooming. Fig. 2D-a shows a two-dimensional view of the actin-rich structure in a single cell treated with U0126 and stimulated with PDBu. Fig. 2D-b shows the columnar structure of an actin-rich structure in an orthogonal view by confocal microscopy with Z-sectioning. Fig. 2D-c shows a three-dimensional reconstruction of the confocal images, revealing interconnections among the actin-rich columns (Fig. 2D-c). Fig. 2E shows serial optical sections of the actin-rich columns from top to bottom, further illustrating the interconnections and columnar structure of interconnected actin-rich columns.
To determine whether interconnected actin-rich columns were dorsal ruffles, we performed scanning electron microscopy experiments on A7r5 cells. In these experiments, platelet-derived growth factor (PDGF) stimulation was included as positive control because PDGF had been shown to stimulate the formation of dorsal ruffles in A7r5 cells [30]. As shown in Fig. 2F-b, scanning electron microscopy of the dorsal surface of an unstimulated A7r5 cell revealed a relatively smooth surface. As shown in Fig. 2F-c, phase-contrast microscopy confirmed the formation of circular dorsal ruffles in PDGF-stimulated cells. Scanning electron microscopy of the dorsal surface of the same cell revealed a ridge populated by numerous small bumps on the dorsal surface (Fig. 2F-d), which were characteristic of dorsal ruffles (Buccione et al., 2004). As shown in Fig. 2F-e, phase-contrast microscopy confirmed the formation of interconnected actin-rich columns in an U0126-treated, PDBu-stimulated cell. Scanning electron microscopy of the same cell revealed some smooth patches on the dorsal surface without the numerous small bumps associated with dorsal ruffles on the PDGF-stimulated cell (Fig. 2F-f). Therefore, results from the scanning electron microscopy experiments suggested that interconnected actin-rich columns and dorsal ruffles were distinct structures.
To investigate whether MEK1/2 inhibition by U0126 had any effect on the translocation of Erk1/2 and caldesmon to the podosomes, we imaged the localization of phospho-MEK1/2, Erk1/2, and caldesmon in U0126-treated, PDBu-stimulated cells. Phospho-MEK1/2 was included because U0126 was expected to inhibit the kinase activity of phospho-MEK1/2 without affecting MEK1/2 phosphorylation. We found that phospho-MEK1/2 became localized at the nucleus and interconnected actin-rich columns in U0126-treated, PDBu-stimulated cells (Fig. 3A a–c). Similarly, Erk 2 and caldesmon continued to translocate to the interconnected actin-rich columns in U0126-treated, PDBu-stimulated cells (Figs. 3B and 3C). However, unlike untreated cells where phospho-Erk1/2 became localized in the nucleus (Fig. 1D), Erk2 failed to translocate to the nucleus in U0126-treated cells (Fig. 3B). Instead, Erk2 was localized at the interconnected actin-rich columns and the perinuclear region in U0126-treated, PDBu-stimulated cells (Fig. 3B). It is noteworthy that perinuclear structures such as endosomes and the Golgi apparatus have been shown to contain Ras/MAPK signaling molecules [31]. Accordingly, the observed perinuclear localization of Erk2 in U0126-treated cells could reflect the localization of Erk2 at these membrane structures. U0126 treatment also altered the distribution of caldesmon in response to PDBu stimulation. As shown in Fig. 3C, caldesmon became integrated with F-actin in the interconnected actin-rich columns in PDBu-stimulated, U0126-treated cells instead of its typical location at the ring of podosomes in PDBu-stimulated untreated cells (Fig. 1E). To determine the effect of disrupting the actin cytoskeleton on Erk translocation, we performed the cytochalasin D experiments on A7r5 cells. As shown in Fig. 3D, cytochalasin D (2 μM) disrupted the actin cytoskeleton in A7r5 cells. Furthermore, cytochalasin D-treated cells failed to form podosomes and failed to translocate Erk2 to the nucleus in response to PDBu stimulation (Fig. 3E). Therefore, results from the cytochalasin D experiments suggested that integrity of the actin cytoskeleton was essential for PDBu-stimulated formation of podosomes and translocation of Erk to the nucleus in A7r5 cells.
Figure 3.
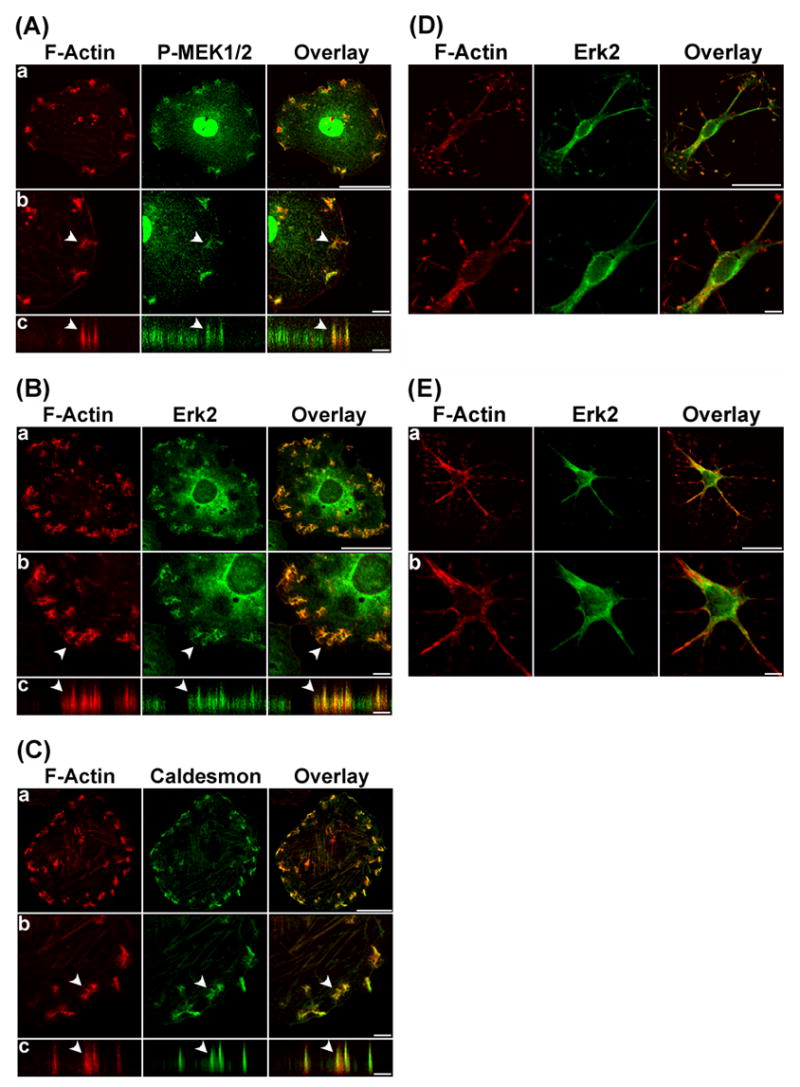
Phospho-MEK1/2, Erk2, and caldesmon were localized at the interconnected actin-rich columns in U0126-treated, PDBu-stimulated cells. In panels A, B, and C, F-Actin was labeled in red by Alexa 568-conjugated phalloidin. Phospho-MEK1/2, Erk2, and caldesmon were labeled green by specific primary antibodies, followed by Alexa 488-conjugated secondary antibody. Interconnected actin-rich columns indicated by arrows were enlarged (row b), and then scanned along the orthogonal axis (row c) to illustrate the columnar localization of these proteins within the interconnected actin-rich columns. Size bars represent 40 μm in row a, and 8 μm in rows b and c. Z distances in rows c of panels A, B, and C were amplified to show the interconnected actin-rich columns clearly. Actual column heights were ~3μm in this figure. In panel D, A7r5 cells were treated with serum-free media containing 2μM cytochalasin D for 2 hours. F-Actin was labeled in red by Alexa 568-conjugated phalloidin. Erk2 was labeled green by specific primary antibodies, followed by Alexa 488-conjugated secondary antibody. In panel E, A7r5 cells were pretreated with serum-free media containing 2μM cytochalasin D for 1 hour and then stimulated by serum-free media containing 1μM PDBu and 2μM cytochalasin D for another hour. F-Actin was labeled in red by Alexa 568-conjugated phalloidin. Erk2 was labeled green by specific primary antibodies, followed by Alexa 488-conjugated secondary antibody. Size bars represent 40 μm in row a, and 8 μm in rows b.
The following experiments investigated whether the podosome marker proteins, α-actinin, vinculin and metalloproteinase (MMP) were present at the interconnected actin-rich columns in U0126-treated cells. As control, Figs. 4A, 4B, and 4C (panels a–c) showed the typical morphology of podosomes in PDBu-stimulated, untreated cells, where F-actin constituted the core and α-actinin, vinculin and MMP-2 constituted the outer ring of podosomes. Figs. 4A, 4B, and 4C (panels d–f) showed the morphology of interconnected actin-rich columns in U0126-treated, PDBu-stimulated cells, and the presence of α-actinin, vinculin and MMP-2 at the columns. Confocal microscopy with Z-sectioning revealed the columnar localization of these marker proteins at the interconnected actin-rich columns as shown in Figs. 4A, 4B, and 4C (panel f). Careful comparison of the images recorded revealed a subtle difference in vinculin distribution between untreated and U0126-treated cells. Whereas vinculin was localized at the ring of podosomes (Fig. 4B-c), vinculin was integrated with F-actin at the interconnected actin-rich columns (Fig. 4B-f).
Figure 4.
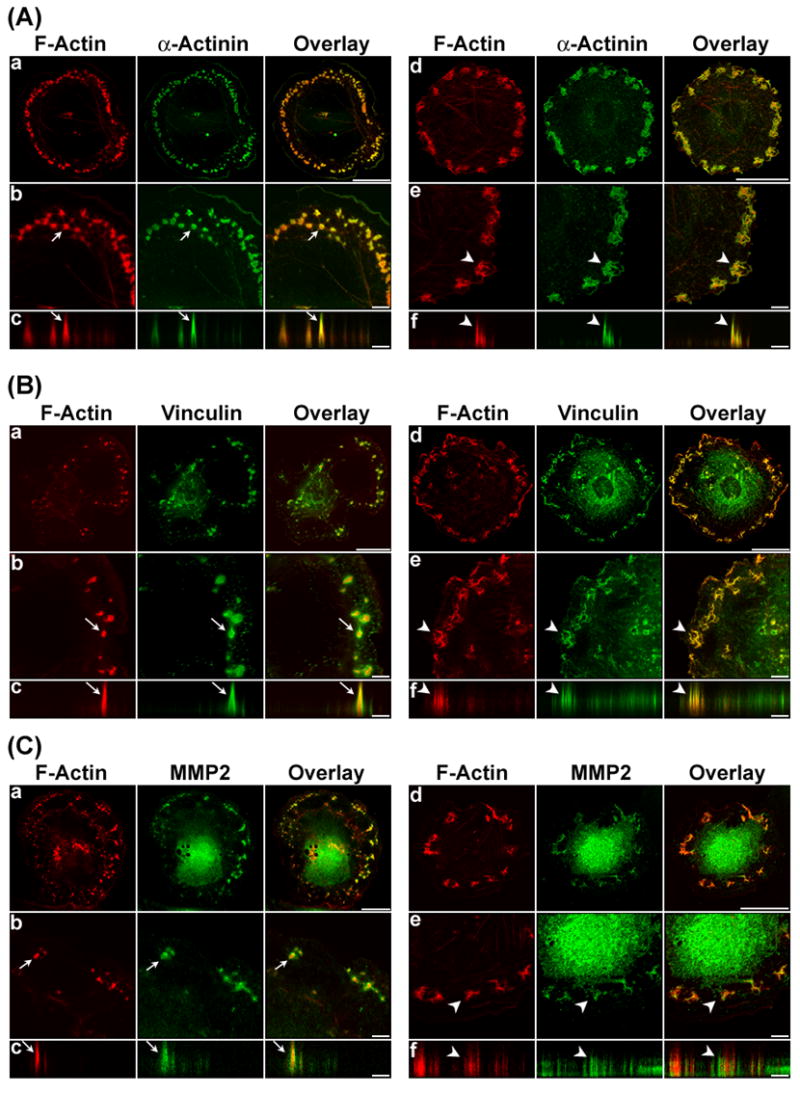
α-Actinin, vinculin, and MMP-2 are localized at the podosomes and interconnected actin-rich columns in U0126-treated, PDBu-stimulated A7r5 cells. Panels A to C show the localization of α-actinin, vinculin and MMP-2 at the podosomes in control cells (rows a to c), or interconnected actin-rich columns in U0126-treated cells (rows d to f) in response to PDBu stimulation. In the control group, A7r5 cells were incubated in serum-free media for 1 hr, and then stimulated by PDBu for 1 hour. In the U0126 treatment group, A7r5 cells were pretreated by U0126 for 1 hour, and then stimulated by PDBu in the presence of U0126 for 1 hour. F-Actin was labeled in red by Alexa 568-conjugated phalloidin. Other proteins were labeled green by specific primary antibodies, followed by Alexa 488-conjugated secondary antibody. Podosomes or interconnected actin-rich columns indicated by arrows were enlarged, and then scanned along the orthogonal direction to show the columnar distribution of the podosome markers. Size bars represent 40 μm in rows a and d, and 8 μm in rows b, c, e, and f. Z distances in rows c and f of panels A, B, and C were amplified to show the podosomes and interconnected actin-rich columns clearly. Actual heights of podosomes and interconnected actin-rich columns were ~ 3 μm in this figure.
Overexpression of Wild-Type Caldesmon-GFP Induced the Formation of Relatively Few But Large Podosomes in Response to PDBu stimulation
Overexpression of l-caldesmon has recently been shown to decrease the average number of podsosomes per cell in PDBu-stimulated A7r5 cells [10]. As control for the caldesmon mutant experiments, we investigated the effect of overexpressing wild-type caldesmon-GFP on podosome formation. As shown in Fig. 5A (lower two panels), Western blot analysis using an anti-caldesmon antibody confirmed the overexpression of wild-type caldesmon-GFP together with endogenous caldesmon in transfected A7r5 cells. Anti-phospho-caldesmon labeling of the same blot showed that both caldesmon-GFP and endogenous caldesmon became phosphorylated in response to PDBu stimulation. Furthermore, U0126 inhibited phosphorylation of both caldesmon-GFP and endogenous caldesmon (Fig. 5A, upper two panels), suggesting that PDBu-stimulated phosphorylation of both proteins was dependent on MEK activation. Confocal fluorescence microscopy of A7r5 cells overexpressing wild-type caldesmon-GFP indicated the localization of caldesmon-GFP at the actin stress fibers in unstimulated cells (Fig. 5B-a). Upon PDBu stimulation, cells overexpressing wild-type caldesmon developed relatively few but large podosomes (Fig. 5B b–d).
Figure 5.
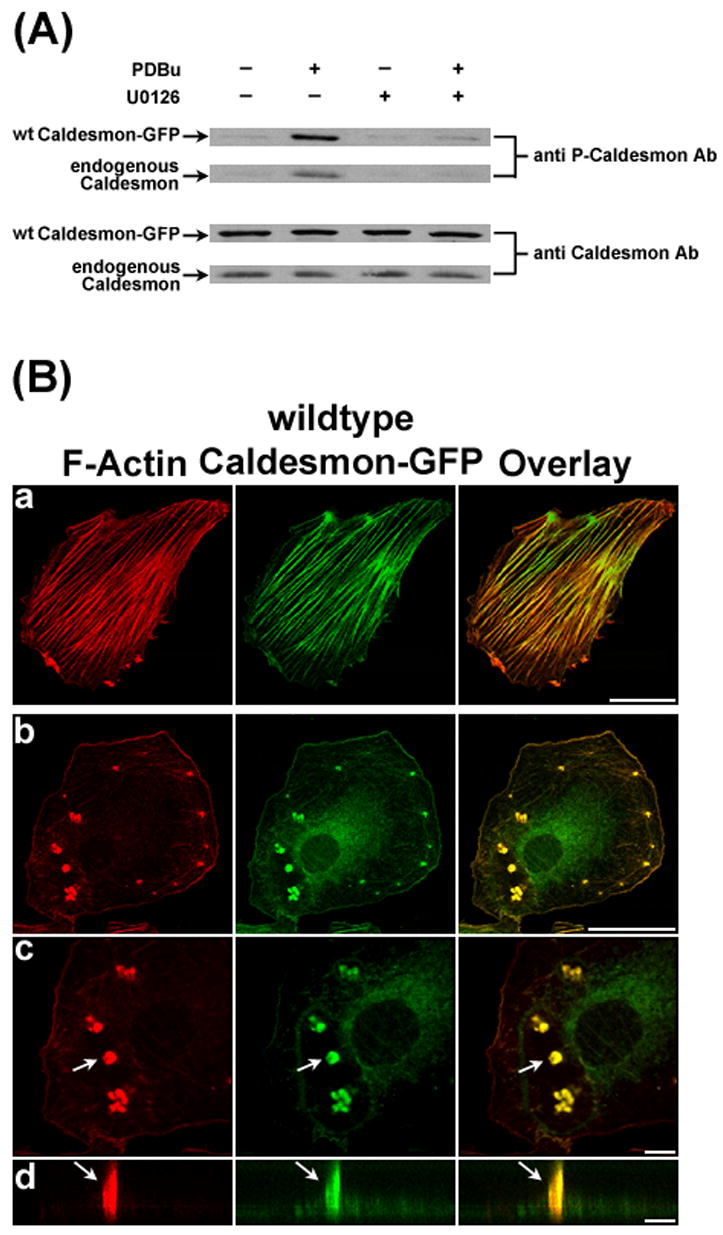
Overexpression of wild-type (wt) caldesmon-GFP induced the formation of relatively few but large podosomes in response to PDBu stimulation. Panel A shows the overexpression of wt caldesmon-GFP in A7r5 cells after 72 hours of transfection. Western blot analysis using an anti-caldesmon antibody demonstrated the overexpression of wt caldesmon-GFP (3rd row) together with the expression of endogenous caldesmon (4th row) in A7r5 cells. Anti-phospho-caldesmon labeling of the same blot showed that both wild-type caldesmon-GFP and endogenous caldesmon became phosphorylated in response to PDBu stimulation, and that U0126 inhibited phosphorylation of both molecules (1st and 2nd rows). Panel B shows the labeling of F-actin by Alexa 568-conjugated phalloidin and caldesmon-GFP fluorescence in unstimulated cells (row a) and PDBu-stimulated cells (rows b to d), respectively. Podosomes indicated by arrows were enlarged (row c), and then scanned along the orthogonal direction (row d) to illustrate the columnar structure of podosomes. Size bars represent 40 μm in rows a and b; and 8 μm in rows c and d. Z distances in panel B-d were amplified. Actual heights of podosomes were ~5 μm in this figure.
Overexpression of Phosphorylation-Deficient Caldesmon-GFP Induced the Formation of Relatively Small Podosomes
The following experiments were performed to investigate whether U0126-mediated inhibition of Erk-dependent caldesmon phosphorylation was the mechanism underlying the formation of interconnected actin-rich columns in U0126-treated A7r5 cells in response to PDBu stimulation. Accordingly, we designed a DNA construct for the overexpression of phosphorylation-deficient caldesmon-GFP mutant in A7r5 cells by modifying the two Erk phosphorylation sites, S497 and S527, at the C-terminus of l-caldesmon as shown in Fig. 6A and described by Kordowska et al. [25]. Substituting the S497 and S527 sites by alanine (S497A/S527A) created the phosphorylation-deficient caldesmon mutant. If inhibition of Erk-dependent caldesmon phosphorylation was the mechanism underlying the formation of interconnected actin-rich columns in U0126-induced A7r5 cells in response to PDBu stimulation, then overexpression of the phosphorylation-deficient (S497A/S527A) caldesmon-GFP should enable A7r5 cells to develop interconnected actin-rich columns in response to PDBu stimulation.
Figure 6.
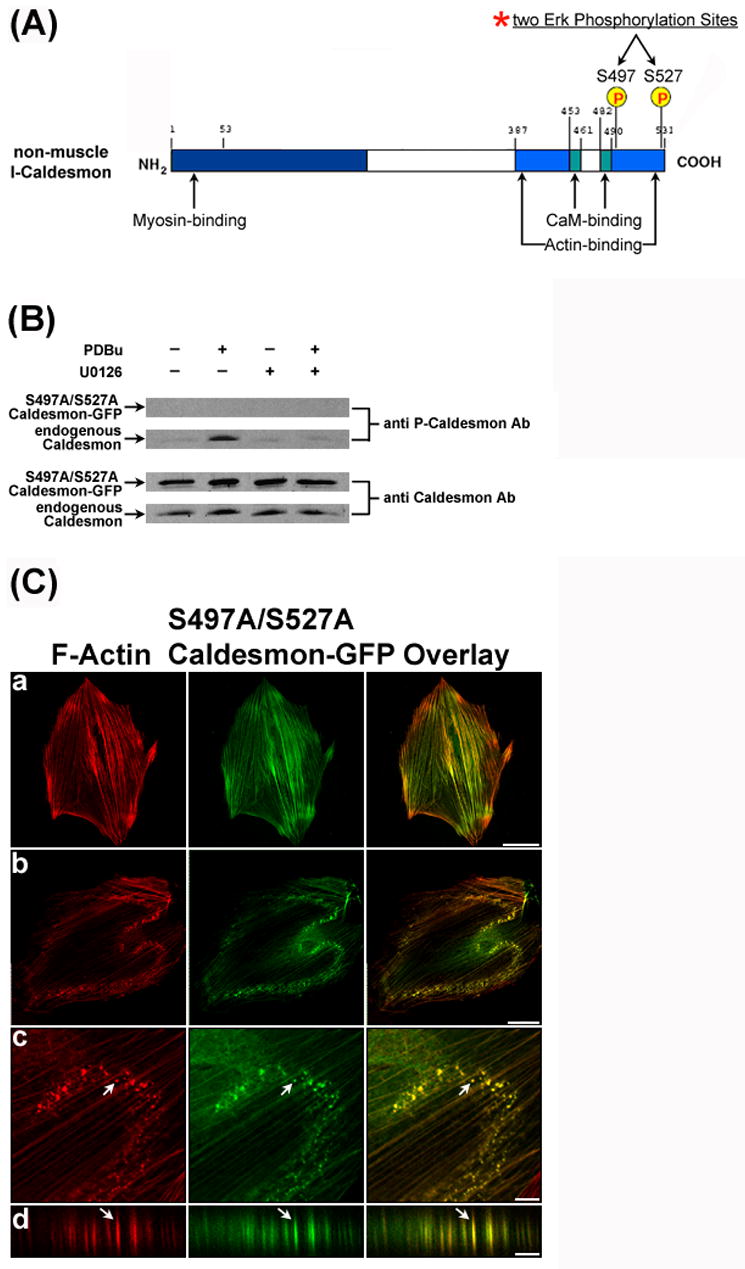
Overexpression of phosphorylation-deficient caldesmon induced the formation of relatively small podosomes in response to PDBu stimulation. Panel A shows the two Erk phosphorylation sites (S497 and S527) at the C-terminal of l-caldesmon that were mutated to alanine. Panel B shows overexpression of the S497A/S527A caldesmon-GFP mutant in A7r5 cells at 72 hours after transfection. Western blot analysis using an anti-caldesmon antibody demonstrated the overexpression of (S497A/S527A) caldesmon-GFP (3rd row) and endogenous caldesmon (4th row) in A7r5 cells. Anti-phospho-caldesmon labeling of the same blot showed that only endogenous caldesmon became phosphorylated in response to PDBu stimulation, and that U0126 inhibited its phosphorylation (2nd row). There was no detectable phosphorylation of S497A/S527A caldesmon-GFP mutant by the same anti-phospho-caldesmon antibody (1st row). Panel C shows the formation of relatively small podosomes in cells overexpressing (S497A/S527A) caldesmon-GFP upon PDBu stimulation. Rows a and b show the distribution of F-actin as labeled by Alexa 568-conjugated phalloidin and (S497A/S527A) caldesmon-GFP fluorescence in unstimulated and PDBu-stimulated cells, respectively. Podosomes indicated by arrows were enlarged (row c), and then scanned along the orthogonal direction (row d) to illustrate the columnar structure of podosomes. Size bars represent 40 μm in rows a and b; and 8 μm in rows c and d. Z distances in row d were amplified. Actual heights of podosomes were ~2 μm in panel C.
Fig. 6B demonstrated the overexpression of the S497A/S527A caldesmon-GFP (Fig. 6B, third row) together with endogenous caldesmon expression (Fig. 6B, fourth row) in A7r5 cells by Western blot analysis using an anti-caldesmon antibody. We have also labeled the same blots using an anti-phospho-caldesmon antibody to confirm that the (S497A/S527A) caldesmon-GFP mutant was indeed not phosphorylated in PDBu-stimulated cells (Fig. 6B, first row). Overexpression of wild-type or S497A/S527A caldesmon-GFP was accompanied by a small decrease in endogenous caldesmon as revealed by Western analysis using β-actin as an internal control (data not shown). Therefore, wild-type or S497A/S527A caldesmon-GFP was the dominant caldesmon species in the caldesmon-GFP overexpression experiments (Figs. 5A and 6B). We then investigated whether overexpressing the phosphorylation-deficient (S497A/S527A) caldesmon mutant would enable A7r5 cells to develop interconnected actin-rich columns in response to PDBu stimulation. Fig. 6C-a shows the incorporation of (S497A/S527A) caldesmon-GFP into actin stress fibers in unstimulated cells without obvious changes in the actin cytoskeletal structure. Upon PDBu stimulation, cells overexpressing (S497A/S527A) caldesmon-GFP did not develop interconnected actin-rich columns, but developed relatively small podosomes instead (Fig. 6C b–d), suggesting that inhibition of caldesmon phosphorylation was insufficient to induce the formation of interconnected actin-rich columns in PDBu-stimulated cells.
To ensure that cells overexpressing the (S497A/S527A) caldesmon-GFP mutant were capable of developing interconnected actin-rich columns under U0126 treatment and PDBu stimulation, we have treated cells overexpressing (S497A/S527A) caldesmon-GFP with U0126 followed by PDBu stimulation, and confirmed the development of interconnected actin-rich columns in these cells (data not shown). Similarly, cells overexpressing wild-type caldesmon-GFP were also capable of developing interconnected actin-rich columns in response to U0126 treatment and PDBu stimulation (data not shown). Therefore, results from the wild-type and phosphorylation-deficient caldesmon-GFP overexpression studies do not support the hypothesis that inhibition of caldesmon phosphorylation was the mechanism underlying U0126-induced formation of interconnected actin-rich columns. Instead, results from these studies suggest that caldesmon plays a role in the regulation of podosome size in A7r5 cells. We investigated this function of caldesmon further by live-imaging experiments as discussed in the following section.
Erk and Caldesmon Differentially Regulate the Life Time and Size of Podosomes
The following live-imaging experiments investigated the spatiotemporal dynamics of PDBu-stimulated podosomes and interconnected actin-rich columns in U0126-treated cells, and cells overexpressing wild-type caldesmon-GFP and phosphorylation-deficient (S497A/S527A) caldesmon-GFP by time-lapse phase-contrast and fluorescence microscopy.
Fig. 7 and Movies 1 to 6 (supplement) showed the spatiotemporal dynamics of podosomes in A7r5 cells during PDBu stimulation. Fig. 7A-c showed the time-lapse images of a single podosome in an untreated, untransfected cell. Analysis of the images indicated that podosomes in this cell had an average life-time of 10.5 ± 1.0 min (Fig. 8A), and an average size of ~1μm (Fig. 8B). Fig. 7B-c showed the time-lapse images of interconnected actin-rich columns in an U0126-treated cell. Analysis of the images indicated that the interconnected actin-rich columns in this cell had an average life-time of 46.8 ± 1.7 min (Fig. 8A) and an average size of ~13 μm (Fig. 8B) at 30 min after formation. These values were approximately 4.5 and 13-fold of the corresponding values in untreated cells (Fig. 8). Fig. 7C-c showed the time-lapse phase-contrast images of a large podosome in a cell overexpressing wild-type caldesmon-GFP. The corresponding time-lapse GFP-fluorescence images were shown in Fig. 7C-f. Analysis of the images indicated that large podosomes in this cell exhibited an average life-time of 26.6 ± 3.0 min (Fig. 8A) and an average size of ~6μm (Fig. 8B) at 30 min after formation. These values were approximately 2.5 and 6-fold of the corresponding values in untransfected cells (Fig. 8). Fig. 7D-c showed the time-lapse phase-contrast images of a single cell overexpressing phosphorylation-deficient (S497A/S527A) caldesmon-GFP. The corresponding time-lapse GFP-fluorescence images of this small podosome were shown in Fig. 7D-f. Analysis of the images indicated that podosomes in this cell had an average life-time of 3.9 ± 0.2 min (Fig. 8A) and an average size of ~0.5μm (Fig. 8B). These values were lower than the corresponding values in an untransfected cell by 63% and 50%, respectively (Fig. 8).
Figure 7.
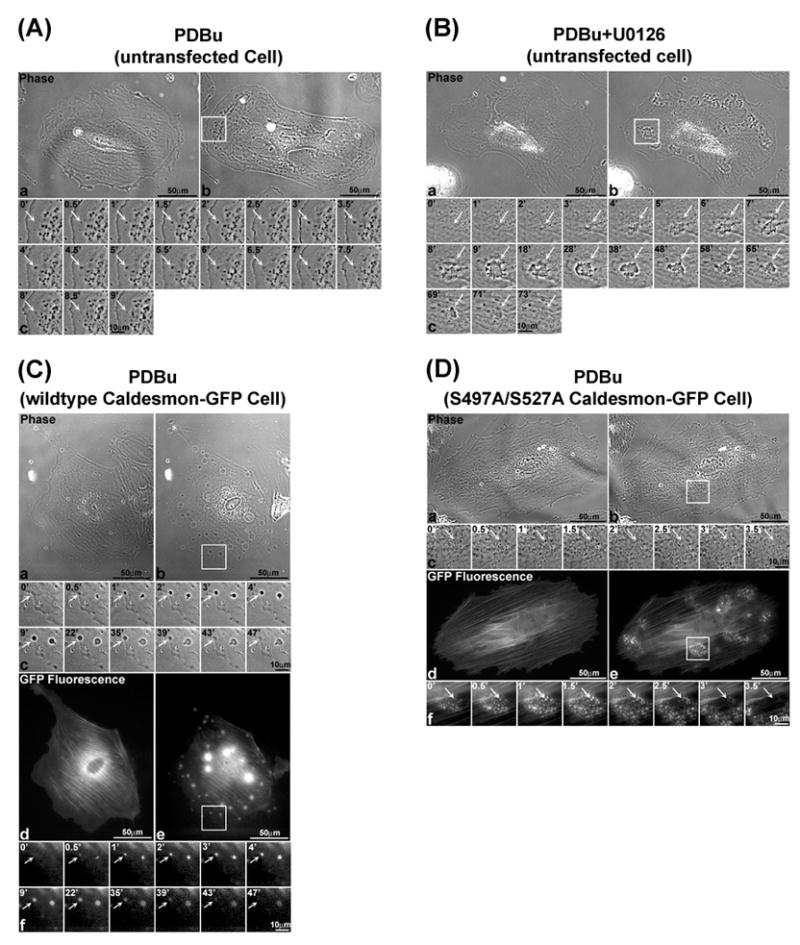
Erk1/2 and caldesmon differentially regulated the spatiotemporal dynamics of podosomes in live A7r5 cells during PDBu stimulation. Panel A shows the podosome dynamics in an untransfected cell during PDBu-stimulation as recorded by phase-contrast live-imaging. Panels A-a and A-b show the live images of a cell before and after PDBu stimulation. Panel A-c shows a podosome in this cell as indicated by an arrow from its first appearance to its disappearance over 9 min (B-c). Panel B shows the formation of interconnected actin-rich columns in an U0126-treated cell during PDBu stimulation as recorded by phase-contrast live-imaging. Panels B-a and B-b show the live images of an U0126-treated cell before and after PDBu stimulation. Panel A-c shows a group of interconnected actin-rich columns in this cell as indicated by an arrow from its first appearance to its disappearance over 73 min. Panel C shows podosome dynamics in a cell overexpressing wild-type caldesmon-GFP during PDBu stimulation. Panels C-a and C-d show the phase-contrast and GFP-fluorescence images of this cell before PDBu stimulation, respectively. Panels C-b and C-e show the phase-contrast and GFP-fluorescence images of this cell after PDBu stimulation, respectively. Panels C-c and C-f show the phase-contrast and GFP-fluorescence images of a podosome in this cell as indicated by an arrow from its first appearance to its disappearance over 47 min. Panel D shows podosome dynamics in a cell overexpressing the (S497A/S527A) caldesmon-GFP during PDBu stimulation. Panels D-a and D-d show the phase-contrast and GFP-fluorescence images of this cell before PDBu stimulation. Panels D-b and D-e show the phase-contrast and GFP-fluorescence images of this cell after PDBu stimulation, respectively. Panels D-c and D-f show the phase-contrast and GFP-fluorescence images of a podosome in this cell as indicated by an arrow from its first appearance to its disappearance over 3.5 min.
Fig. 8 summarizes the different life-times and sizes of podosomes and interconnected actin-rich columns in untreated, U0126-treated, and transfected cells overexpressing phosphorylation-deficient and wild-type caldesmon-GFP mutants. As shown in Figs. 8A and 8B, the cell overexpressing the phosphorylation-deficient (S497A/S527A) caldesmon-GFP mutant exhibited the shortest podosome life-time of 3.9 min together with the smallest podosome size of ~0.5 μm. In contrast, the U0126-treated cell exhibited the longest life-time of 47 min together with the largest size of ~13 μm for the formation of interconnected actin-rich columns. The cell overexpressing wild-type caldesmon exhibited intermediate values of podosome lifetime and podosome sizes. Plotting podosome size against podosome life time revealed a positive correlation between these two variables in A7r5 cells (Fig. 8C, symbols). Although the data shown in Fig. 8 were derived from a single cell, we have repeated the imaging experiments up to four times, and observed similar changes in podosome size and life time.
The data on the positive correlation between between podosome size and podosome life time as shown in Fig. 8C (symbols) suggested that a common mechanism could underlie the regulation of the two variables. Accordingly, we modeled the podosome dynamics using rate constants for the assembly and disassembly of podosomes (see Materials and Methods). The modeling results suggested that the rate constant for podosome disassembly (Koff) is the most important variable for explaining the data on the positive correlation between podosome size and life time (Figs. 8C and 8D), suggesting that podosome disassembly is the regulated variable in podosome dynamics.
Discussion
We tested the hypothesis that the MEK/Erk/caldesmon phosphorylation cascade regulates podosome dynamics in A7r5 cells during PKC activation by phorbol dibutyrate (PDBu). The first novel finding of this study was operation of the MEK/Erk/caldesmon phosphorylation cascade in PKC-mediated podosome formation in A7r5 cells. A7r5 cells have been used extensively as a model system for studying the mechanisms of podosome formation by several laboratories [3, 4, 9, 10, 11]. This is the first report that documents the operation of the MEK/Erk1/2/caldesmon phosphorylation cascade in PKC-mediated formation of podosomes in A7r5 vascular smooth muscle cells (Fig. 1). In unstimulated cells, phospho-MEK1/2 and phospho-Erk1/2 were differentially located in the nucleus and the perinuclear region, respectively (Figs. 1C and 1D). Upon PDBu stimulation, phospho-MEK1/2 and phospho-Erk1/2 translocated together to the nucleus and podosomes (Figs. 1C and 1D). It is generally recognized that MEK-dependent phosphorylation of Erk occurs in the cytoplasm prior to the translocation of phospho-Erk to the nucleus [32]. Therefore, the observed colocalization of phospho-MEK1/2 and phospho-Erk1/2 at the podosomes and nucleus after PDBu stimulation suggests the possibility that podosomes may serve as a cytoplasmic site for MEK-dependent Erk1/2 phosphorylation prior to the translocation of phospho-Erk1/2 to the nucleus. However, this suggestion does not exclude the existence of other cytoplasmic sites of Erk phosphorylation. This suggestion is supported by the observation that unphosphorylated Erk2 continued to translocate to the interconnected actin-rich columns upon PDBu stimulation when the MEK/Erk signaling pathway was inhibited by U0126, even though unphosphorylated Erk2 failed to translocate to the nucleus (Fig. 3). To determine the effect of disrupting the actin cytoskeleton on Erk translocation, we performed the cytochalasin D experiments on A7r5 cells. Results from the cytochalasin D experiments suggested that integrity of the actin cytoskeleton was essential for PDBu-stimulated formation of podosomes and translocation of Erk to the nucleus in A7r5 cells.
The second novel finding in this study was the formation of interconnected actin-rich columns in PDBu-stimulated A7r5 cells when MEK-dependent Erk phosphorylation was inhibited by U0126 (Fig. 2). Confocal imaging with Z-sectioning and three-dimensional image reconstruction of interconnected actin-rich columns revealed interconnecting actin-rich columns (Figs. 2D and 2E). To determine whether interconnected actin-rich columns were dorsal ruffles, we performed scanning electron microscopy experiments on A7r5 cells. In these experiments, platelet-derived growth factor (PDGF) stimulation was included as positive control because PDGF had been shown to stimulate the formation of dorsal ruffles in A7r5 cells [30]. Scanning electron microscopy of the dorsal surface of a PDGF-stimulated cell revealed a ridge populated by numerous small bumps on the dorsal surface (Fig. 2F-d), which were characteristic of dorsal ruffles [2]. In contrast, scanning electron microscopy of an U0126-treated cell revealed some smooth patches on the dorsal surface without the numerous small bumps associated with dorsal ruffles on the PDGF-stimulated cell (Fig. 2F-f). Therefore, results from the scanning electron microscopy experiments suggested that interconnected actin-rich columns and dorsal ruffles were distinct structures. It is also important to note that whereas Erk1/2 MAPK activation is an integral part of PDGF receptor signaling [33], Erk1/2 MAPK inhibition is necessary for the formation of interconnected actin-rich columns.
Confocal imaging of the interconnected actin-rich columns indicated the presence of podosome marker proteins such as α-actinin, vinculin, and MMP-2 at these columns (Fig. 4). The observed localization of MMP-2 at the podosomes and interconnected actin-rich columns in A7r5 vascular smooth muscle cells identifies this MMP subtype in podosome-mediated extracellular matrix breakdown in A7r5 vascular smooth muscle cells [3]. Podosomes are known to act as sites for concentrating MMPs for spatially-specific extracellular matrix degradation [46]. Therefore, the observed localization of MMP-2 at the podosomes is consistent with this function of podosomes. This finding is also consistent with the implication of MMP-2 in aging and angiotensin II-induced arterial remodeling [34, 35]. Furthermore, MMP-2 genetic deficiency has been shown to decrease vascular smooth muscle invasion in vitro, and decreased formation of intimal hyperplasia in vivo [36, 37]. It is noteworthy that both caldesmon and vinculin became integrated with F-actin in the interconnected actin-rich columns in PDBu-stimulated, U0126-treated cells (Fig. 4) instead of their typical location at the ring of podosomes in PDBu-stimulate, untreated cells (Figs. 3 and 4). A possible explanation for the observed integration of caldesmon with F-actin at the interconnected actin-rich columns was the successive recruitment of caldesmon and actin to the columns during its slow formation. However, the observed integration of vinculin with actin at the interconnected actin-rich columns was unexpected because vinculin is often associated with focal adhesions at the cell membrane. A possible explanation for this observation was the direct binding of vinculin to the Arp2/3 complex [38, 39]. The above comparisons suggest that the interconnected actin-rich columns may be novel structures that are distinct from podosomes and dorsal ruffles.
Live-imaging of the formation of interconnected actin-rich columns revealed the slow dynamics of these columns in comparison to the fast dynamics of podosomes in untreated cells (Fig. 7). Another subtle but distinguishing feature of interconnected actin-rich columns from podosomes was the integration of vinculin into the actin-rich columns relative to the peripheral localization of vinculin at the podosomes (Fig. 4). These findings have led us to hypothesize that interconnected actin-rich columns could arise from the growth of podosomes that were slow to disassemble when Erk1/2 phosphorylation was inhibited by U0126. The rationale for this hypothesis was that Erk1/2 activation has been shown to enhance the disassembly of focal adhesions, and MEK1/2 inhibition by U0126 has been shown to inhibit the disassembly of paxillin from focal adhesions [26]. Furthermore, active Erk has been found to target newly forming cell-matrix adhesions [40], and such targeting of phosphorylated Erk has been shown to be critical for chemotaxis of pancreatic carcinoma cells [41]. These findings have led us to hypothesize that phospho-Erk1/2-dependent enhancement of the disassembly of podosomes may contribute to the fast dynamics of podosomes. Accordingly, inhibition of Erk activation by U0126 would slow podosome disassembly, resulting in the formation of interconnected actin-rich columns. It is noteworthy that podosome clusters in the form of rosettes have been observed in many different cell types including macrophages, osteoclasts, fibroblasts, endothelial cells, and RSV-transformed BHK21 cells [42, 43, 44, 45, 46, 47]. To our knowledge, this is the first report of the formation of interconnected actin-rich columns in vascular smooth muscle cells. However, interconnected actin-rich columns in A7r5 cells differed in their appearance from rosettes in other cell types, so that they might not really be their equivalent in smooth muscle cells.
Since U0126 inhibited both Erk1/2 and caldesmon phosphorylation in A7r5 cells (Fig. 2), we investigated whether overexpression of a phosphorylation-deficient caldesmon mutant would induce the formation of interconnected actin-rich columns in A7r5 cells (Fig. 6). We found that cells overexpressing phosphorylation-deficient caldesmon mutant did not develop interconnected actin-rich columns in response to PDBu stimulation (Fig. 6). Instead, these cells developed smaller podosomes with faster dynamics (Figs. 7 and 8). This finding indicated that inhibition of caldesmon phosphorylation at the two Erk sites (S497 and S527) alone was insufficient to explain the effect of MEK inhibition by U0126 on the formation of interconnected actin-rich columns in A7r5 cells. Multiple molecules are known to regulate the assembly of focal adhesions [48, 49, 50]. Similarly, Erk1/2-dependent phosphorylation of multiple molecules at the podosomes may be involved in the disassembly of podosomes so that inhibition of caldesmon phosphorylation alone is insufficient to retard the normal disassembly of podosomes. U0126 also decreased the percentage of cells forming podosomes. U0126 treatment was expected to increase the amount of unphosphorylated caldesmon which is known to be more potent than phosphorylated caldesmon in stabilizing actin filaments [14, 18]. Therefore, this finding is consistent with the finding of Eves et al. [10] that caldesmon overexpression suppressed PDBu-stimulated podosome formation in A7r5 vascular smooth muscle cells.
The third novel finding in this study was the role of caldesmon in the regulation of podosome life-time and size in A7r5 cells. Podosomes are known to be dynamic structures [5]. To our knowledge, this is the first report of the modulation of podosome size and life time in A7r5 cells. By live-imaging, we observed a variety of podosome dynamics ranging from the small and fast podosomes in cells overexpressing the phosphorylation-deficient caldesmon mutant to the large and slow interconnected actin-rich columns in U0126-treated cells. As shown in Figs. 7A and 8, untransfected and untreated A7r5 cells exhibited podosomes with an average size of ~1 μm and an average life-time of ~10 min in response to PDBu stimulation. For comparison, cells overexpressing the phosphorylation-deficient caldesmon-GFP developed small and fast podosomes with an average size of ~0.5 μm and an average life-time of ~4 min in response to PDBu stimulation (Figs. 7D and 8). It is noteworthy that Kordowska et al. [25] found that the phosphorylation-deficient caldesmon mutant stabilized actin stress fibers against disassembly in RAF cells treated with phorbol ester. However, RAF cells do not form podosomes and may not possess the regulatory proteins for podosome formation. Therefore, it is difficult to extrapolate from findings derived from RAF cells to A7r5 cells. Cells overexpressing wild-type caldesmon-GFP developed relatively few but large podosomes with an average size of ~6 μm and an average life-time of 27 min (Figs. 7 and 8). This finding is consistent with the findings of Eves et al. [10] that overexpression of l-caldesmon decreased the average number of podosomes per cell in PDBu-stimulated A7r5 cells. A novel finding in this study was that cells overexpressing wild-type caldesmon developed relatively large and slow podosomes in response to PDBu stimulation (Figs. 5 and 7). Altogether, the phosphorylation-deficient and wild-type caldesmon-GFP overexpression studies suggest differential roles of unphosphorylated and phosphorylated caldesmon in the modulation of podosome size and life time in A7r5 cells.
Plotting the values of podosome size against the values of podosome life-time derived from the live-imaging experiments revealed a positive correlation between these two variables (Fig. 8). Using a minimal model of podosome dynamics, we illustrated the hypothesis that modulation of the rate of podosome disassembly could be a major mechanism underlying the parallel changes in the size and life time of podosomes. Erk1/2 and caldesmon are complex molecules because Erk1/2 has multiple targets, and caldesmon has multiple phosphorylation sites. We have focused on the Erk1/2-caldesmon system in this study because this system has a well documented role in the regulation of vascular smooth muscle contraction. Results from this study have showed that pharmacologic and genetic perturbations of Erk1/2 and caldesmon lead to different changes in the morphology, size, and lifetime of podosomes. These findings suggest that Erk1/2 and caldesmon differentially modulate PKC-mediated formation and/or dynamics of podosomes in A7r5 vascular smooth muscle cells.
Supplementary Material
Acknowledgments
This study was supported by National Heart, Lung, and Blood Institute Grant HL-52714 (to C.-M. H). We thank Dr. David M. Helfman for his generous gift of the caldesmon-GFP cDNA construct.
Footnotes
Publisher's Disclaimer: This is a PDF file of an unedited manuscript that has been accepted for publication. As a service to our customers we are providing this early version of the manuscript. The manuscript will undergo copyediting, typesetting, and review of the resulting proof before it is published in its final citable form. Please note that during the production process errors may be discovered which could affect the content, and all legal disclaimers that apply to the journal pertain.
References
- 1.Newby AC. Dual role of matrix metalloproteinases (Matrixins) in intimal thickening and atherosclerotic plaque rupture. Physiol Rev. 2005;85:1–31. doi: 10.1152/physrev.00048.2003. [DOI] [PubMed] [Google Scholar]
- 2.Buccione R, Orth JD, McNiven MA. Foot and mouth: podosomes, invadopodia and circular dorsal ruffles. Nat Rev Mol Cell Biol. 2004;5:647–657. doi: 10.1038/nrm1436. [DOI] [PubMed] [Google Scholar]
- 3.Burgstaller G, Gimona M. Podosome-mediated matrix resorption and cell motility in vascular smooth muscle cells. Am J Physiol Heart Circ Physiol. 2005;288:3001–3005. doi: 10.1152/ajpheart.01002.2004. [DOI] [PubMed] [Google Scholar]
- 4.Hai CM, Hahne P, Harrington EO, Gimona M. Conventional protein kinase C mediates phorbol-dibutyrate-induced cytoskeletal remodeling in A7r5 smooth muscle cells. Exp Cell Res. 2002;280:64–74. doi: 10.1006/excr.2002.5592. [DOI] [PubMed] [Google Scholar]
- 5.Linder S, Kopp P. Podosomes at a glance. J Cell Sc. 2005;118:2079–2082. doi: 10.1242/jcs.02390. [DOI] [PubMed] [Google Scholar]
- 6.Moreau V, Tatin F, Varon C, Genot E. Actin can reorganize into podosomes in aortic endothelial cells, a process controlled by Cdc42 and RhoA. 2003;23:6809–6822. doi: 10.1128/MCB.23.19.6809-6822.2003. [DOI] [PMC free article] [PubMed] [Google Scholar]
- 7.Osiak AE, Zenner G, Linder S. Subconfluent endothelial cells form podosomes downstream of cytokine and RhoGTPase signaling. Exp Cell Res. 2005;307:342–353. doi: 10.1016/j.yexcr.2005.03.035. [DOI] [PubMed] [Google Scholar]
- 8.Lener T, Burgstaller G, Crimaldi L, Lach S, Gimona M. Matrix-degrading podosomes in smooth muscle cells. Eur J Cell Biol. 2006;85:183–189. doi: 10.1016/j.ejcb.2005.08.001. [DOI] [PubMed] [Google Scholar]
- 9.Brandt D, Gimona M, Hillmann M, Haller H, Mischak H. Protein kinase C induces actin reorganization via a src- and rho-dependent pathway. J Biol Chem. 2002;277:20903–20910. doi: 10.1074/jbc.M200946200. [DOI] [PubMed] [Google Scholar]
- 10.Eves R, Webb BA, Zhou S, Mak AS. Caldesmon is an integral component of podosomes in smooth muscle cells. J Cell Sc. 2006;119:1691–1702. doi: 10.1242/jcs.02881. [DOI] [PubMed] [Google Scholar]
- 11.Kaverina I, Stradal TEB, Gimona M. Podosome formation in cultured A7r5 vascular smooth muscle cells requires Arp1/2-dependent de novo actin polymerization at discrete microdomains. J Cell Sc. 2003;116:4915–4924. doi: 10.1242/jcs.00818. [DOI] [PubMed] [Google Scholar]
- 12.Gatesman A, Walker VG, Baisden JM, Weed SA, Flynn DC. Protein kinase Cα activates c-Src and induces podosome formation via AFAP110. Mol Cell Biol. 2004;24:7578–7597. doi: 10.1128/MCB.24.17.7578-7597.2004. [DOI] [PMC free article] [PubMed] [Google Scholar]
- 13.Larsson C. Protein kinase C and the regulation of the actin cytoskeleton. Cell Signal. 2006;18:276–284. doi: 10.1016/j.cellsig.2005.07.010. [DOI] [PubMed] [Google Scholar]
- 14.Morgan KG, Gangopadhyay SS. Invited Review: Cross-bridge regulation by thin filament-associated proteins. J Appl Physiol. 2001;91:953–962. doi: 10.1152/jappl.2001.91.2.953. [DOI] [PubMed] [Google Scholar]
- 15.Wang CL. Caldesmon and smooth-muscle regulation. Cell Biochem Biophys. 2001;35:275–288. doi: 10.1385/cbb:35:3:275. [DOI] [PubMed] [Google Scholar]
- 16.Dabrowska R, Hinssen H, Galazkiewicz B, Nowak E. Modulation of gelsolin-induced actin filament severing by caldesmon and tropomyosin and the effect of these proteins on the actin activation of myosin Mg2+-ATPase activity. Biochem J. 1996;315:753–759. doi: 10.1042/bj3150753. [DOI] [PMC free article] [PubMed] [Google Scholar]
- 17.Dabrowska R, Kulikova N, Gagola M. Nonmuscle caldesmon: its distribution and involvement in various cellular processes. Protoplasma. 2004;224:1–13. doi: 10.1007/s00709-004-0057-3. [DOI] [PubMed] [Google Scholar]
- 18.Hai CM, Gu Z. Caldesmon phosphorylation in actin cytoskeletal remodeling. Eur J Cell Biol. 2006;85:305–309. doi: 10.1016/j.ejcb.2005.08.008. [DOI] [PubMed] [Google Scholar]
- 19.Ishikawa R, Yamashiro S, Matsumura F. Annealing of gelsolin-severed actin fragments by tropomyosin in the presence of Ca2+: potentiation of the annealing process by caldesmon. J Biol Chem. 1989;264:16764–16770. [PubMed] [Google Scholar]
- 20.Chellaiah M, Kizer N, Silva M, Alvarez U, Kwiatkowski D, Hruska KA. Gelsolin deficiency blocks podosome assembly and produces increased bone mass and strength. J Cell Biol. 2000;148:665–678. doi: 10.1083/jcb.148.4.665. [DOI] [PMC free article] [PubMed] [Google Scholar]
- 21.Mizutani K, Miki H, He H, Maruta H, Takenawa T. Essential role of neural Wiskott-Aldrich Syndrome Protein in podosome formation and degradation of extracellular matrix in src-transformed fibroblasts. Cancer Res. 2002;62:669–674. [PubMed] [Google Scholar]
- 22.Tanaka J, Watanabe T, Nakamura N, Sobue K. Morphological and biochemical analyses of contractile proteins (actin, myosin, caldesmon, and tropomyosin) in normal and transformed cells. J Cell Sc. 1993;104:595–606. doi: 10.1242/jcs.104.2.595. [DOI] [PubMed] [Google Scholar]
- 23.Foster DB, Huang R, Hatch V, Craig R, Graceffa P, Lehman W, Wang CLA. Modes of caldesmon binding to actin: sites of caldesmon contact and modulation of interactions by phosphorylation. J Biol Chem. 2004;279:53387–53394. doi: 10.1074/jbc.M410109200. [DOI] [PubMed] [Google Scholar]
- 24.Huang R, Li L, Guo H, Wang CLA. Caldesmon binding to actin is regulated by calmodulin and phosphorylation via different mechanisms. Biochem. 2003;42:2513–2523. doi: 10.1021/bi0268605. [DOI] [PubMed] [Google Scholar]
- 25.Kordowska J, Hetrick T, Adam LP, Wang CL. Phosphorylated l-cadesmon is involved in disassembly of actin stress fibers and postmitotic spreading. Exp Cell Res. 2006;312:95–110. doi: 10.1016/j.yexcr.2005.09.021. [DOI] [PubMed] [Google Scholar]
- 26.Webb DJ, Donais K, Whitmore LA, Thomas SM, Turner CE, Parsons JT, Horwitz AF. FAK-Src signaling through paxillin, ERK and MLCK regulates adhesion disassembly. Nature Cell Biol. 2004;6:154–161. doi: 10.1038/ncb1094. [DOI] [PubMed] [Google Scholar]
- 27.Helfman DM, Levy ET, Berthier C, Shtutman M, Riveline D, Grosheva I, Lachish-Zalait A, Elbaum M, Bershadsky AD. Caldesmon inhibits nonmuscle cell contractility and interferes with the formation of focal adhesions. Mol Biol Cell. 1999;10:3097–3112. doi: 10.1091/mbc.10.10.3097. [DOI] [PMC free article] [PubMed] [Google Scholar]
- 28.D’Angelo G, Graceffa P, Wang CLA, Wrangle J, Adam LP. Mammal-specific, ERK-dependent, caldesmon phosphorylation in smooth muscle. Quantitation using novel anti-phosphopeptide antibodies. J Biol Chem. 1999;274:30115–21. doi: 10.1074/jbc.274.42.30115. [DOI] [PubMed] [Google Scholar]
- 29.Franklin MT, Wang CL, Adam LP. Stretch-dependent activation and desensitization of mitogen-activated protein kinase in carotid arteries. Am J Physiol. 1997;273:C1819–27. doi: 10.1152/ajpcell.1997.273.6.C1819. [DOI] [PubMed] [Google Scholar]
- 30.Goicoechea S, Arneman D, Disanza A, Garcia-Mata R, Scita G, Otey CA. Palladin binds to Eps8 and enhances the formation of dorsal ruffles and podosomes in vascular smooth muscle cells. J Cell Sc. 2006;119:3316–3324. doi: 10.1242/jcs.03076. [DOI] [PubMed] [Google Scholar]
- 31.Mor A, Philips MR. Compartmentalized Ras/MAPK Signaling. Annu Rev Immunol. 2006;24:771–800. doi: 10.1146/annurev.immunol.24.021605.090723. [DOI] [PubMed] [Google Scholar]
- 32.Torii S, Nakayama K, Yamamoto T, Nishida E. Regulatory mechanisms and function of ERK MAP kinases. J Biochem. 2004;136:557–561. doi: 10.1093/jb/mvh159. [DOI] [PubMed] [Google Scholar]
- 33.Yu J, Ustach C, Kim HRC. Platelet-derived growth factor signaling and human cancer. J Biochem Mol Biol. 2003;36:49–59. doi: 10.5483/bmbrep.2003.36.1.049. [DOI] [PubMed] [Google Scholar]
- 34.Wang M, Takagi G, Asai K, Resuello RG, Natividad FF, Vatner DE, Vatner SF, Lakatta EG. Aging increases aortic MMP-2 activity and angiotensin II in nonhuman primates. Hypertension. 2003;41:1308–1316. doi: 10.1161/01.HYP.0000073843.56046.45. [DOI] [PubMed] [Google Scholar]
- 35.Wang M, Zhang J, Spinetti G, Jiang LQ, Monticone R, Zhao D, Cheng L, Krawczyk M, Talan M, Pintus G, Lakatta EG. Angiotensin II activates matrix metalloproteinase type II and mimics age-associated carotid arterial remodeling in young rats. Am J Pathol. 2005;167:1429–1442. doi: 10.1016/S0002-9440(10)61229-1. [DOI] [PMC free article] [PubMed] [Google Scholar]
- 36.Johnson C, Galis ZS. Matrix metalloproteinase-2 and -9 differentially regulate smooth muscle cell migration and cell-mediated collagen organization. Arterioscler Thromb Vasc Biol. 2004;24:54–60. doi: 10.1161/01.ATV.0000100402.69997.C3. [DOI] [PubMed] [Google Scholar]
- 37.Kuzuya M, Kanda S, Sasaki T, Tamaya-Mori N, Cheng XW, Itoh T, Itohara S, Iguchi A. Deficiency of gelatinase A suppresses smooth muscle cell invasion and development of experimental intimal hyperplasis. Circulation. 2003;108:1375–1381. doi: 10.1161/01.CIR.0000086463.15540.3C. [DOI] [PubMed] [Google Scholar]
- 38.Bailly M. Connecting cell adhesion to the actin polymerization machinery: vinculin as the missing link? Trends Cell Biol. 2003;13:163–165. doi: 10.1016/s0962-8924(03)00030-8. [DOI] [PubMed] [Google Scholar]
- 39.DeMali KS, Barlow CA, Burridge K. Recruitment of the Arp2/3 complex to vinculin: couopling membrane protrusion to matrix adhesion. J Cell Biol. 2002;159:881–891. doi: 10.1083/jcb.200206043. [DOI] [PMC free article] [PubMed] [Google Scholar]
- 40.Fincham VJ, James M, Frame MC, Winder SJ. Active ERK/MAP kinase is targeted to newly forming cell-matrix adhesions by integrin engagement and v-Src. EMBO J. 2000;12:2911–2923. doi: 10.1093/emboj/19.12.2911. [DOI] [PMC free article] [PubMed] [Google Scholar]
- 41.Stahle M, Veit C, Bachfischer U, Schierling K, Skripczynski B, Hall A, Gierschik P, Giehl K. Mechanisms in LPA-induced tumor cell migration: critical role of phosphorylated ERK. J Cell Sc. 2003;116:3835–3846. doi: 10.1242/jcs.00679. [DOI] [PubMed] [Google Scholar]
- 42.Collin O, Tacqui P, Stephanou A, Usson Y, Clement-Lacroix J, Planus E. Spatiotemporal dynamics of actin-rich adhesion microdomains: influence of substrate flexibility. J Cell Sc. 2006;119:1914–1925. doi: 10.1242/jcs.02838. [DOI] [PubMed] [Google Scholar]
- 43.Destaing O, Saltel F, Geminard JC, Jurdic P, Bard F. Podosomes display actin turnover and dynamic self-organization in osteoclasts expressing actin-green fluorescent protein. Mol Biol Cell. 2003;14:407–416. doi: 10.1091/mbc.E02-07-0389. [DOI] [PMC free article] [PubMed] [Google Scholar]
- 44.Evans JG, Correia I, Krasavina O, Watson N, Matsudaira P. Macrophage podosomes assemble at the leading lamella by growth and fragmentation. J Cell Biol. 2003;161:697–705. doi: 10.1083/jcb.200212037. [DOI] [PMC free article] [PubMed] [Google Scholar]
- 45.Ochoa GC, Slepnew VI, Neff L, Ringstad N, Takei K, Daniell L, Kim W, Cao H, McNiven M, Baron R, De Camilli P. A functional link between dynamin and the actin cytoskeleton at podosomes. J Cell Biol. 2000;150:377–389. doi: 10.1083/jcb.150.2.377. [DOI] [PMC free article] [PubMed] [Google Scholar]
- 46.Varon C, Tatin F, Moreau V, Van Obberghen-Schilling E, Fernandez-Sauze S, Reuzeau E, Kramer I, Genot E. Transforming growth factor β induces rosettes of podosomes in primary aortic endothelial cells. Mol Cell Biol. 2006;26:3582–3594. doi: 10.1128/MCB.26.9.3582-3594.2006. [DOI] [PMC free article] [PubMed] [Google Scholar]
- 47.Wheeler AP, Smith SD, Ridley AJ. CSF-1 and PI3-kinase regulate podosome distribution and assembly in macrophages. Cell Motility Cytoskeleton. 2006;63:132–140. doi: 10.1002/cm.20111. [DOI] [PubMed] [Google Scholar]
- 48.Coll JL, Ben-Zeev A, Ezzell RM, Fernandez JLR, Baribault H, Oshima RG, Adamson ED. Targeted disruption of vinculin genes in F9 and embryonic stem cells changes cell morphology, adhesion, and locomotion. Proc Natl Acad Sci USA. 1995;92:9161–9165. doi: 10.1073/pnas.92.20.9161. [DOI] [PMC free article] [PubMed] [Google Scholar]
- 49.Llic D, Furuta Y, Kanazawa S, Takeda N, Sobue K, Nakatsuji N, Nomura S, Fujimoto J, Okada M, Yamamoto T, Aizawa S. Reduced cell motility and enhanced focal adhesion contact formation in cells from FAK-deficient mice. Nature. 1995;377:539–544. doi: 10.1038/377539a0. [DOI] [PubMed] [Google Scholar]
- 50.Wade R, Bohl J, Pol SV. Paxillin null embryonic stem cells are impaired in cell spreading and tyrosine phosphorylation of focal adhesion kinase. Oncogene. 2002;21:96–107. doi: 10.1038/sj.onc.1205013. [DOI] [PubMed] [Google Scholar]
Associated Data
This section collects any data citations, data availability statements, or supplementary materials included in this article.