

Abstract
The tail-withdrawal circuit of Aplysia provides a useful model system for investigating synaptic dynamics. Sensory neurons within the circuit manifest several forms of synaptic plasticity. Here, we developed a model of the circuit and investigated the ways in which depression (DEP) and potentiation (POT) contributed to information processing. DEP limited the amount of motor neuron activity that could be elicited by the monosynaptic pathway alone. POT within the monosynaptic pathway did not compensate for DEP. There was, however, a synergistic interaction between POT and the polysynaptic pathway. This synergism extended the dynamic range of the network, and the interplay between DEP and POT made the circuit responded preferentially to long-duration, low-frequency inputs.
Keywords: Synaptic Depression, Post-tetanic Potentiation, Information Processing
1. Introduction
A basic tenet of neuroscience is that the capabilities of the nervous system arise from the organization of neurons into networks or circuits. To investigate the ways in which neural circuits function, several model systems have been developed. These model systems, each with unique advantages, range from mammals to invertebrates. One such model system is the marine mollusk Aplysia. By virtue of its relatively simple nervous system and its amenability to analyses at molecular, synaptic, circuit and behavioral levels, Aplysia is a valuable model system for cellular analyses of neural circuits, the relationship of neural circuits to behavior and the ways in which neuronal properties are modified by learning and memory. The present study examines the ways in which short-term, homosynaptic plasticity influence activity in the neural network that underlies the tail-withdrawal reflex of Aplysia.
Previously, a computational model was used to assess the relative contributions of mono- and polysynaptic pathways to the tail-withdrawal reflex [16]. The results suggested that the monosynaptic pathway from sensory neurons (SNs) to motor neurons (MNs) could not account for the empirical observation that brief stimuli (e.g., a 100 ms, mild electrical shock) to the tail elicit long-duration (a second or more) responses in MNs [11,13,14, see Fig. 6B]. Rather, the polysynaptic pathway from SNs to interneurons (Pl17s) to MNs primarily determined the duration of a response and converted an amplitude-encoded input into an amplitude- and duration-encoded output. Although the model provided important insights into functional role of Pl17, several key biophysical properties of the SNs were not considered. For example the SNs co-express several forms of short-term, homosynaptic plasticity, including depression (DEP) and potentiation (POT) [10,15]. A subsequent study [10] considered the role of DEP in the monosynaptic pathway, but did not examine the functional implications of the co-expression of DEP and POT nor did it examine the interplay between synaptic plasticity and the slow, feedforward excitation that is mediated by Pl17. The goal of the present study was to extend these models by including both DEP and POT and investigating the ways in which interactions among these two forms of plasticity and feedforward excitation contribute to temporal information processing in the tail-withdrawal neural circuit.
Fig. 6.
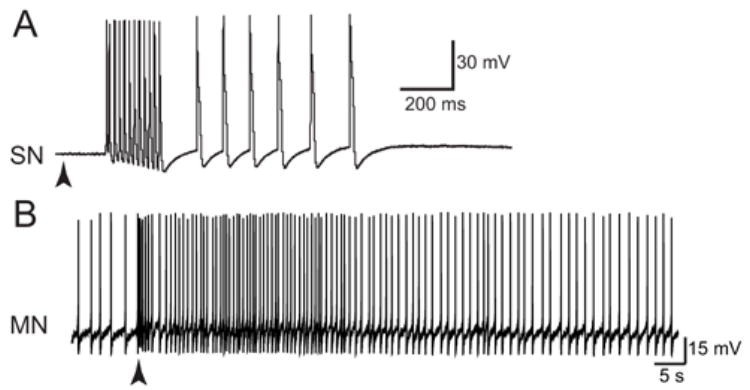
Responses of SNs and MNs to brief stimulus of the tail. shock. A: The response of a tail SN to a brief (200 ms) electrical shock (100 VAC) to the tail (arrowhead) in a semi-intact preparation. The initial burst of SN spikes was followed by an afterdischarge. (Modified from Phares et al. 2003, with permission from The Society for Neuroscience © 2003.) B: The response of a tail MN to a brief (100 ms) electrical shock (100 VAC) of the tail. Note spontaneous activity prior to stimulus. (Antzoulatos and Byrne, unpublished observation)
2. Methods
The model included four SNs that made fast, increase-conductance excitatory connections with two Pl17s and a MN (see Fig. 2B). Pl17 made an excitatory connection with the MN that included both fast, increase-conductance and slow, decrease-conductance components (Fig. 1B) [3]. All cells were modeled with Hodgkin-Huxley type equations. A first-order, forward Euler method was used to integrate the ordinary differential equations and the integration time step was fixed at 5 μs. Simulations were performed with the neurosimulator SNNAP [1,2,17]. The input files for this model are available at the SNNAP and ModelDB web sites.
Fig. 2.
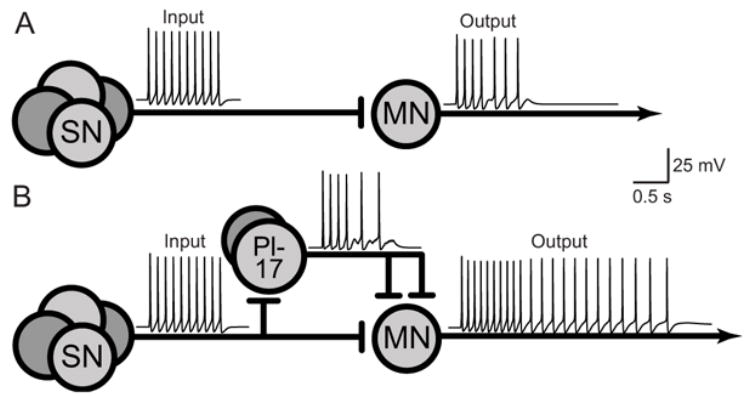
Slow, feedforward excitation converted amplitude-encoded inputs into duration- and amplitude-encoded outputs. A: Response of the monosynaptic pathway alone. B: Response of the combined mono- and polysynaptic pathways to an identical input.
Fig. 1.
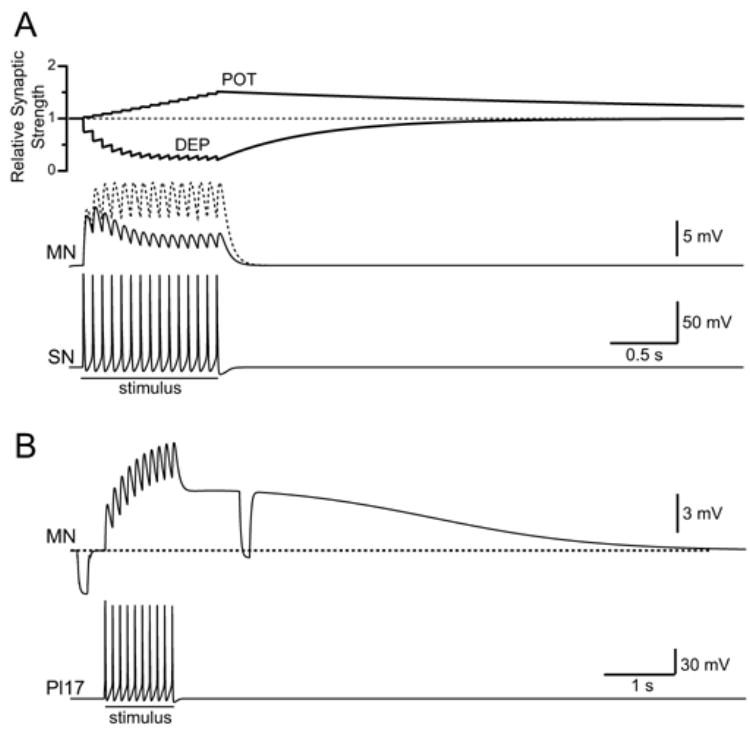
Synaptic dynamics. The MN was hyperpolarized to −90 mV to prevent spiking. A: A 1 s, 15 Hz train of spikes in a single SN elicited EPSPs in the MN. (Pl17 also was hyperpolarized to prevent spiking and its contribution to PSP.) In the absence of plasticity (dashed trace), the amplitudes of the EPSPs were constant during the stimulus. In the presence of DEP and POT (solid trace), the amplitudes of the EPSPs decreased during the stimulus. B: Activity in a single Pl17 elicited a multi-component EPSP in the MN. Two identical, hyperpolarizing current pulses were injected into the MN to illustrate the decrease in membrane conductance during the slow component of the EPSP.
DEP and POT were incorporated into the SN-to-Pl17 and SN-to-MN connections (Fig. 1A). It is not known how DEP and POT interact in SNs. However, studies in other systems found that assuming a multiplicative interaction between similar forms of plasticity adequately describe synaptic dynamics [4–9,12]. Thus, a multiplicative interaction was used in the present study and the synaptic responses of the SNs (ISN_syn) were determined by:
where GSN_syn is the maximum conductance of the synaptic connection, A(t) is a time-dependent function (e.g., an alpha function) that defines the time course of the PSP, DEP(t) and POT(t) are functions that describe the dynamics of depression and potentiation, respectively, Vm is the membrane potential of the postsynaptic cell and Esyn is the equilibrium potential of the synapse. DEP(t) was described by a simple, first-order decay in availability of transmitter that dependents on whether or not an action potential is present:
dDEP/dt=−DEP/τd_DEP while the presynaptic membrane potential is >0 mV, otherwise
dDEP/dt=(1−DEP)/τr_DEP while the presynaptic membrane potential is <0 mV
where τd_DEP (10 ms) is the time constant for the development of DEP(t) during the action potential and τr_DEP (700 ms) is the time constant for the recovery from DEP(t). POT(t) was described by similar functions:
dPOT/dt=POT/τd_POT while the presynaptic membrane potential is >0 mV, otherwise
dPOT/dt=(1-POT)/τr_POT while the presynaptic membrane potential is <0 mV
where τd_POT = 100 ms and τr_POT = 5 s. (The initial values for DEP(t) and POT(t) were 1.) The duration of the SN spike at 0 mV was 3 ms. Thus, each action potential in a SN triggered small, incremental changes in DEP and POT (Fig. 1A). Values for the parameters that define DEP and POT were selected to qualitatively match empirical observations. For example, during a 1 s, 10 Hz burst, EPSPs at sensorimotor connections depress to ~25% of their initial value and this depression reaches a steady state approximately half way through the burst (see Fig. 2B of [10]). Thus, parameters were selected for DEP(t) that produced ~75% depression during a 1 s, 10 Hz train of EPSPs and this depression reached a steady state approximately half way through the burst. Similarly, a brief burst of presynaptic activity (e.g., 8–10 spikes at 25 Hz) induces a potentiation that initially increases the amplitude of sensorimotor EPSPs ~50% and this potentiation decays over the course of several minutes (see Fig. 1B of [15]). Thus, parameters were selected for POT(t) that produced an initial enhancement of release of ~50% following during a 1 s, 20 Hz train of EPSPs and this potentiation decayed relatively slowly. The absolute rate of decay of POT was not a critical feature of the model. Rather, is was critical that the decay of POT was slow relative to the overall duration of the input stimulus and substantial slower the kinetics of DEP (see below). The combination of DEP and POT produced a synaptic profile that closely resembled empirical observations at SN-to-MN connections (compare Fig. 1A to Fig. 2A of [10]). Finally, the potential for synaptic plasticity has yet to be examined in Pl17. Thus, the model of Pl17 synapses did not include plasticity.
3. Results
Incorporating DEP and POT did not alter the conclusions from previous studies [10,16]. In the absence of Pl17, a 1 s, 10 Hz train of spikes in the SNs elicited a brief response in the MN (Fig. 2A). Because of DEP, there were fewer spikes in the output than in the input. In the presence of Pl17, an identical input elicited a prolonged output that contained more spikes than the input. Empirical observations (see below; see Fig. 4B of [11], Fig. 9A of [13], Figs. 8 and 9 of [14]) indicate that brief (0.1 – 0.8 s) electrical shocks of the tail can elicit bursts of activity in MN that can last several seconds. Thus, the simulated prolonged response in the MN qualitatively resembled empirical observations. This amplification of the input was mediated by the slow component of the Pl17-to-MN EPSP.
Fig. 4.
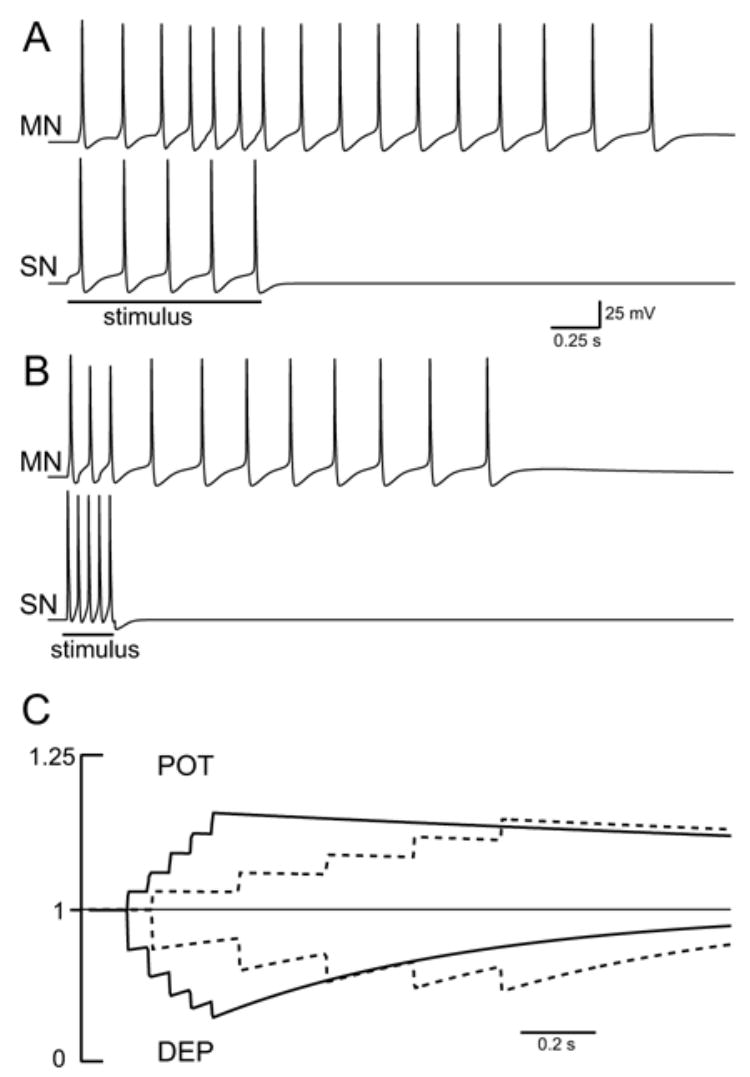
The circuit responded preferentially to prolonged, low-frequency inputs. A: Five input spikes were evenly distributed over 1 s. B: Five input spikes were compressed into a 0.25 s train. C: Development of DEP and POT during the two stimulus trains. Both stimulus trains produced similar levels of POT, but the brief, high-frequency stimulus produced greater levels of DEP.
3.1. Input/Output (I/O) Relationship of the Model
To examine the ways in which the co-expression of DEP and POT interacted with feedforward excitation, the I/O relationship of the circuit was measured under various conditions (Fig. 3). Inputs to the circuit were 1 s trains of spikes in the SNs. Spikes were stimulated in the SNs at frequencies ranging from 2 to 20 Hz. Unless otherwise noted, the four SNs spiked asynchronously. The output of the circuit was measured as the number of spikes elicited in the MN (Fig. 3B) and the duration of spike activity in the MN (Fig. 3A).
Fig. 3.
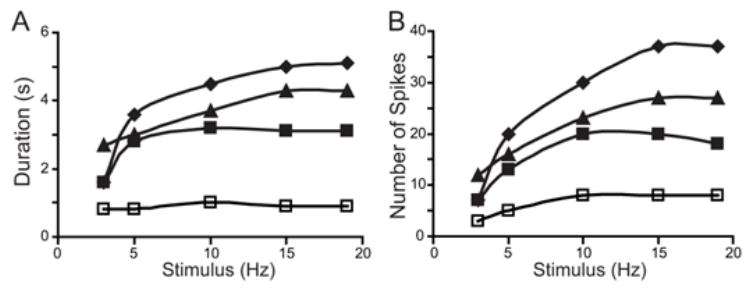
Input/output (I/O) relationship of the circuit. The inputs to the circuit were brief (1 s) constant frequency (2 to 20 Hz) trains of action potentials elicited in the four SNs and the output of the circuit was measured as the number of spikes elicited in the MN and overall duration of activity in the MN. The I/O relationship of the circuit was measured under several conditions: 1) When Pl17 was removed from the circuit (□); 2) When Pl17 was included in the circuit, but synaptic plasticity was removed (◆); 3) When the actions of Pl17 were combined with only DEP (■); and 4) When the actions of Pl17 were combined with the co-expression of DEP and POT (▲). A: Duration of spike activity in the MN. B: The number of spikes elicited in the MN.
When Pl17 was removed from the circuit, the amplitude and duration of the output never exceeded that of the input. When Pl17 was included in the circuit, but synaptic plasticity was removed, both the duration and amplitude of the output were substantially enhanced. In addition, feedforward excitation enhanced the dynamic range of the I/O relationship. When the actions of Pl17 were combined with DEP alone, the amplitude, duration and dynamic range of the I/O relationship were reduced. Co-expression of DEP and POT partially restored the amplitude, duration and dynamic range of the I/O relationship, particularly at the higher input frequencies. The efficacy of the SN synapses was determined by the balance between DEP and POT. This balance was dynamic and was influenced by several factors such the frequency of stimulation and the duration of the stimulus (see below).
3.2. Temporal Information Processing
The temporal organization of the input affected the amplitude and duration of the output. For example, five input spikes that were organized as a 1 s, 5 Hz input elicited a 3 s train of 16 spikes the MN (Fig. 4A). If, however, the five input spikes were compressed into a 0.25 s, 20 Hz input, the output was reduced to a 2.3 s train of 11 spikes (Fig. 4B). The differential response of the network to low- versus high-frequency stimuli resulted from three factors. First, the slow rate of decay of POT allowed POT to reach similar levels during both stimuli (Fig. 4C). Second, the brief, high-frequency produced a greater level of DEP (Fig. 4C). Thus, the low- versus high-frequency stimuli produced similar levels of POT but different levels of DEP. As the ratio of DEP to POT changed so did the synaptic strength. Because of the rapid development of DEP, the response of the circuit to high-frequency inputs was dampened and the circuit preferentially responded to prolonged, low-frequency inputs. This preferential response to low-frequency inputs was retained even if the kinetics of DEP and POT were doubled or halved, which suggested that the properties of the model were fairly robust. Third, small differences in synaptic strength were amplified by the feedforward excitation. The low-frequency stimulus elicited an additional spike in Pl17 (not shown), which in turn, lead to an enhancement of MN response (see below).
Plasticity also played a role in detected the degree to which spikes in a low frequency input were synchronized (Fig. 5). For example, if the four SNs were each stimulated at 5 Hz for 1 s and were made to fire asynchronously, this asynchronous input elicited a 3 s train of 16 spikes in the MN (Fig. 5A). However, if the four SNs were made to fire synchronously, the 1 s, 5 Hz input elicited a 3.4 s train of 18 spikes in the MN (Fig. 5B). This difference resulted from insufficient temporal summation among subthreshold EPSPs, particularly at the SN-to-Pl17 connection (note the subthreshold EPSPs in Pl17, Fig. 5A). The synchronous input was able to elicit an additional spike in Pl17, and the additional spike in Pl17 increased the amplitude and duration of the output. Thus, feedforward excitation amplified small differences in the input.
Fig. 5.
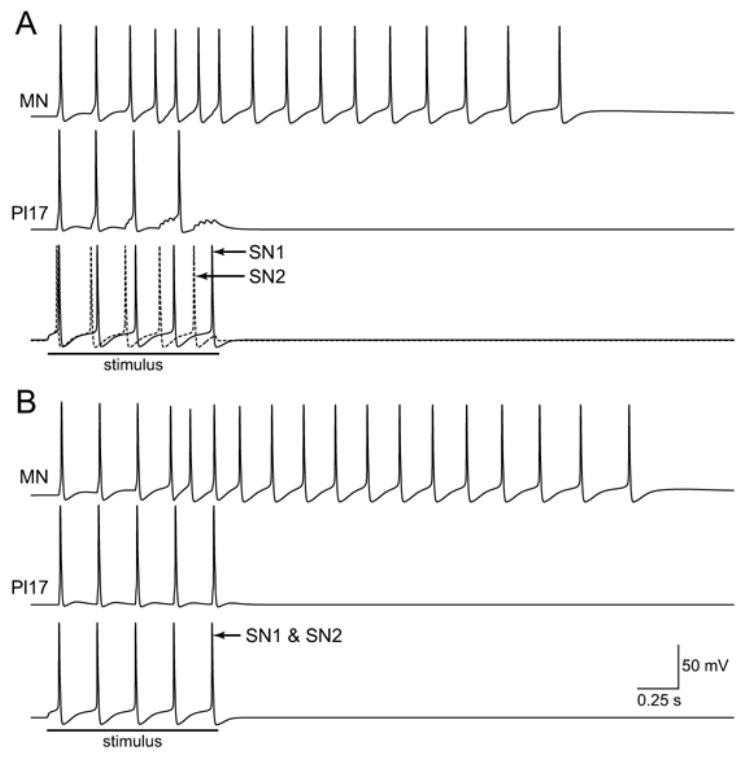
The circuit could detect synchrony within low-frequency inputs. A: The four SNs were made to fire asynchronously. The active of two SNs is illustrated. B: The four SNs were made to fire synchronously. The voltage traces of the two SNs overlap.
Not all temporal information in the input affected the output. For example, the circuit could not distinguish between a tonic stimulus of 8 Hz for 1 s and a patterned stimulus in which 8 spikes were arranged as 4 pairs of spikes at 20 Hz distributed over 1 s (not shown). The tonic and patterned inputs produced identical levels of plasticity, and thus, they produced outputs with identical amplitudes and durations. Whether temporal information in the input affected the output was determined by the interactions among DEP, POT and Pl17 (see below).
3.3. Simulated Responses to a Mild Tail Shock
Empirical studies that examine the tail-withdrawal reflex predominantly use a brief, electrical stimulus to elicit the behavior. This stimulus produces a biphasic response in the SNs (Fig. 6A). Initially, the SNs fire a brief high-frequency burst of spikes that is followed by low frequency train of spikes that outlasts the stimulus. Brief, electrical stimulation of the tail also produces a multi-phasic and long-lasting response in MN (Fig. 6B). An initial, brief (~1 s) burst of high-frequency spiking is followed by prolonged period of low-frequency spike activity.
To examine the response of the model to a simulated tail shock, the SNs were stimulated for 3 s. During the first 0.5 s of the stimulus, the SNs were made to fire at 20 Hz. During the remaining 2.5 s of the stimulus, the SNs were made to fire at 3 Hz (Fig. 7A). This biphasic input elicited a 5 s train of 34 spikes in the MN. Although the intensity and duration of the empirically observed MN response (Fig. 6B) was greater than the simulated response (Fig. 7A), the model qualitatively reproduced the empirical observation that the tail-withdrawal circuit converts an amplitude-encoded input into an amplitude- and duration-encoded output. To determine whether the temporal organization of simulated tail shock affected the output, the simulation was repeated but the SNs were stimulated for 3 s at a constant frequency of 6 Hz. This tonic input contained an identical number of input spikes as the simulated tail shock, but the tonic stimulus elicited a greater response in the MN (Fig. 7B). The tonic stimulus elicited a 6.3 s train of 42 spikes in the MN.
Fig. 7.
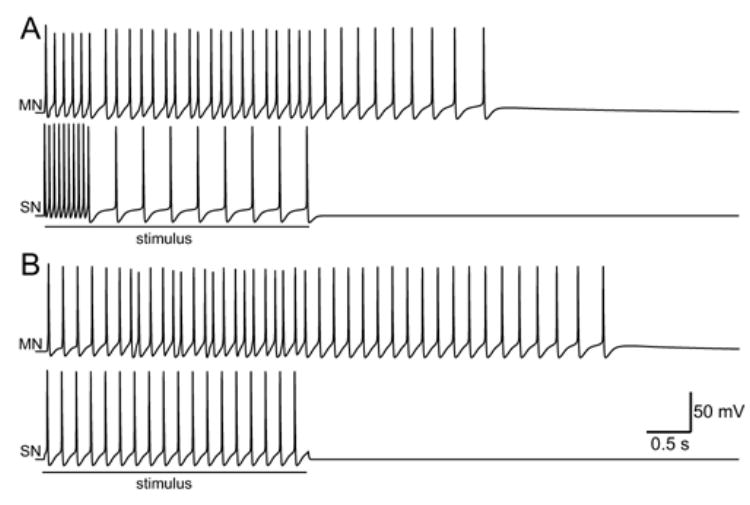
Response to a simulated tail shock. A: A tail shock was simulated by firing the SNs in a brief, high-frequency burst followed by prolonged, low-frequency train of spikes. B: An identical number of spikes in the SNs were elicited at a constant frequency.
The differences between the responses to the simulated tail shock and tonic input resulted, in part, from the kinetics of DEP versus POT. Each action potential in a SN elicited an equal, incremental increase in POT, which decayed very slowly (see Fig. 1A). Because of its slow kinetics, POT integrated an input over long periods of time and the level of POT represented the average frequency of the input rather than specific details of the temporal pattern. Thus, POT reached comparable peak values during the two inputs. In contrast, DEP had faster kinetics and responded differently to high- versus low-frequency inputs. During high-frequency bursts of presynaptic activity, DEP accumulated rapidly and reached lower values than during low-frequency presynaptic activity. Thus, the balance between DEP and POT was different for the simulated tail shock as compared to the tonic input. In addition, the slow, feedforward excitation amplified this difference. The tonic stimulus elicited more spikes in Pl17 than did the simulated tail shock and the increase in Pl17 activity prolonged and amplified the response in the MN.
4. Discussion
The present study examined the functional implications of the co-expression of multiple forms of plasticity at synapses and their interplay with slow, feedforward excitation. The results indicated that slow, feedforward excitation had two effects. First, it transformed an amplitude-encoded input into a duration- and amplitude-encoded output, and second, it amplified small changes in the strength of SN synapses. In addition, the results indicated that slower forms of synaptic plasticity (e.g., POT) essentially integrated the temporal features of input stimuli over time. Thus, the development of POT represented the average frequency of the input stimulus rather than its specific temporal organization. Conversely, because of its faster kinetics, DEP reduced the responsiveness of the circuit to brief, high-frequency inputs. Such inputs generated greater levels of DEP, as compared to equal numbers of input spikes at lower frequencies. Thus, the combination of DEP and POT ‘tuned’ the circuit such that it responded preferentially to prolonged, low-frequency inputs. Finally, there was a synergistic interaction between POT and slow, feedforward excitation. As different patterns of stimulation shifted the balance between DEP and POT, shifts toward increasing POT and lessening DEP were amplified by the feedforward excitation, which in turn enhanced the response of the MN.
Acknowledgments
The authors wish to thank Drs. E. Antzoulatos and G. Phares for helpful comments and discussions during the preparation of this manuscript. The authors also wish to thank Dr. Antzoulatos for providing the empirical data in Fig. 6. This work was supported by National Institutes of Health grant R01RR11626.
Biographies
Douglas A. Baxter received the Ph.D. degree in zoology from The University of Texas at Austin in 1981. He conducted postdoctoral training in the laboratories of D. Johnston at Baylor College of Medicine and J.H. Brown at the City of Hope’s Beckman Research Institute. Currently, Dr. Baxter is an Professor in the Department of Neurobiology and Anatomy at The University of Texas Medical School at Houston. His research uses a combination of computational and experimental approaches to investigate the neural basis of behavior and behavioral modification.

John H. Byrne received the Ph.D. degree in bioengineering from the Polytechnic Institute of Brooklyn in 1973. He conducted his postdoctoral training at the College of Physicians and Surgeons at Columbia University in the laboratory of E.R. Kandel. Dr. Byrne is currently the Professor, June and Virgil Wagner Distinguished Chair, and Chairman of the Department of Neurobiology and Anatomy, and he is the Director of the Neuroscience Research Center at The University of Texas Medical School at Houston. His research focuses on elucidating the cellular and molecular processes that underlie learning and memory.

Footnotes
Publisher's Disclaimer: This is a PDF file of an unedited manuscript that has been accepted for publication. As a service to our customers we are providing this early version of the manuscript. The manuscript will undergo copyediting, typesetting, and review of the resulting proof before it is published in its final citable form. Please note that during the production process errors may be discovered which could affect the content, and all legal disclaimers that apply to the journal pertain.
References
- 1.Av-Ron E, Byrne JH, Baxter DA. Teaching basic principles of neuroscience with computer simulations. J Undergrad Neurosci Edu. 2006;4:A40–A52. [PMC free article] [PubMed] [Google Scholar]
- 2.Baxter DA, Byrne JH. Simulator for neural networks and action potentials (SNNAP): Description and application. In: Crasto C, editor. Methods in Molecular Biology: Bioinformatics. Totowa, N.J: Humana Press; 2007. in press. [DOI] [PubMed] [Google Scholar]
- 3.Cleary LJ, Byrne JH. Identification and characterization of a multifunction neuron contribution to defensive arousal in Aplysia. J Neurophysiol. 1993;70:1767–1776. doi: 10.1152/jn.1993.70.5.1767. [DOI] [PubMed] [Google Scholar]
- 4.Dittman JS, Kreitzer AC, Regehr WG. Interplay between facilitation, depression and residual calcium at three presynaptic terminals. J Neurosci. 2000;20:1374–1385. doi: 10.1523/JNEUROSCI.20-04-01374.2000. [DOI] [PMC free article] [PubMed] [Google Scholar]
- 5.Fisher SA, Fischer TM, Carew TJ. Multiple overlapping processes underlying short-term synaptic enhancement. Trends Neurosci. 1997;20:170–177. doi: 10.1016/s0166-2236(96)01001-6. [DOI] [PubMed] [Google Scholar]
- 6.Hempel CM, Hartmen KH, Wang XJ, Turrigiano GG, Nelson SB. Multiple forms of short-term plasticity at excitatory synapses in rat medial prefrontal cortex. J Neurophysiol. 2000;83:3031–3041. doi: 10.1152/jn.2000.83.5.3031. [DOI] [PubMed] [Google Scholar]
- 7.Kalkstein JM, Magleby KL. Augmentation increases vesicular release probability in the presence of masking depression at the frog neuromuscular junction. J Neurosci. 2004;24:11391–11403. doi: 10.1523/JNEUROSCI.2756-04.2004. [DOI] [PMC free article] [PubMed] [Google Scholar]
- 8.Lewis JE, Maler L. Dynamics of electrosensory feedback: short-term plasticity and inhibition in a parallel fiber pathway. J Neurophysiol. 2002;88:1695–1706. doi: 10.1152/jn.2002.88.4.1695. [DOI] [PubMed] [Google Scholar]
- 9.Lewis JE, Maler L. Synaptic dynamics on different time scales in a parallel fiber feedback pathway of the weakly electric fish. J Neurophysiol. 2004;91:1064–1070. doi: 10.1152/jn.00856.2003. [DOI] [PubMed] [Google Scholar]
- 10.Phares GA, Antzoulatos EG, Baxter DA, Byrne JH. Burst-induced synaptic depression and its modulation contribute to information transfer at Aplysia sensorimotor synapses: empirical and computational analyses. J Neurosci. 2003;23:8392–8401. doi: 10.1523/JNEUROSCI.23-23-08392.2003. [DOI] [PMC free article] [PubMed] [Google Scholar]
- 11.Stopfer M, Carew TJ. Heterosynaptic facilitation of tail sensory neuron synaptic transmission during habitution in tail-induced tail and siphon withdrawal reflexes of Aplysia. J Neurosci. 1996;16:4933–4948. doi: 10.1523/JNEUROSCI.16-16-04933.1996. [DOI] [PMC free article] [PubMed] [Google Scholar]
- 12.Varela JA, Sen K, Gibson J, Fost J, Abbott LF, Nelson SB. A quantitiative description of short-term plasticity at excitatory synapses in layer 2/3 of rat primary visual cortex. J Neurosci. 1997;17:7926–7940. doi: 10.1523/JNEUROSCI.17-20-07926.1997. [DOI] [PMC free article] [PubMed] [Google Scholar]
- 13.Walters ET, Byrne JH, Carew TJ, Kandel ER. Mechanoafferent neurons innervating tail of Aplysia. I. Response properties and synaptic connections. J Neurophysiol. 1983;50:1522–1542. doi: 10.1152/jn.1983.50.6.1522. [DOI] [PubMed] [Google Scholar]
- 14.Walters ET, Byrne JH, Carew TJ, Kandel ER. Mechanoafferent neurons innervating tail of Aplysia. II. Modulation by sensitizing stimulation. J Neurophysiol. 1983;50:1543–1559. doi: 10.1152/jn.1983.50.6.1543. [DOI] [PubMed] [Google Scholar]
- 15.Walters ET, Byrne JH. Post-tetanic potentiation in Aplysia sensory neurons. Brain Res. 1984;293:377–380. doi: 10.1016/0006-8993(84)91247-2. [DOI] [PubMed] [Google Scholar]
- 16.White JA, Ziv I, Cleary LJ, Baxter DA, Byrne JH. The role of interneurons in controlling the tail-withdrawal reflex in Aplysia: A network model. J Neurophysiol. 1993;70:1777–1786. doi: 10.1152/jn.1993.70.5.1777. [DOI] [PubMed] [Google Scholar]
- 17.Ziv I, Baxter DA, Byrne JH. Simulator for neural networks and action potentials: Description and application. J Neurophysiol. 1994;71:294–308. doi: 10.1152/jn.1994.71.1.294. [DOI] [PubMed] [Google Scholar]