

Abstract
Geographic information system (GIS) analysis is an emerging tool for public health intervention planning. Connect to Protect, a researcher–community collaboration working in 15 cities to reduce HIV infection among youths, developed GIS databases of local health, crime, and demographic data to evaluate the geographic epidemiology of sexually transmitted infections and HIV risk among adolescents.
We describe the process and problems of data acquisition, analysis, and mapping in the development of structural interventions, demonstrating how program planners can use this technology to inform and improve planning decisions.
The Connect to Protect project’s experience suggests strategies for incorporating public data and GIS technology into the next generation of public health interventions.
THE CONNECT TO PROTECT project is a collaboration between researchers and communities to reduce HIV infection among youths. The project supports community mobilization and structural changes that promote HIV risk reduction in 15 cities across the United States and in Puerto Rico.1 To focus limited project resources most effectively, Connect to Protect staff at each site developed a geographic information system (GIS) database comprising local health, crime, and census data. They used this system to generate maps to evaluate the geographic epidemiology of sexually transmitted infection (STI) and HIV risk for youths (defined here as those aged 12 to 24 years) in their respective cities. We present the lessons learned.
GEOGRAPHIC INFORMATION SYSTEMS AND HIV PREVENTION
Despite advances in HIV prevention and behavioral interventions, infection rates and numbers of new cases of HIV among adolescents continue to increase.2 As a result, public health researchers are increasingly shifting their focus from models of disease etiology that focus exclusively on individual risk factors (e.g., condom use, number of sexual partners) to models that also consider the complex and powerful effects of the sociophysical environment.3–5 A number of studies have observed that prevalence and incidence of STIs and HIV tend to cluster in geographically defined hyperendemic areas, or “cores.”6–13 These areas are often characterized by high levels of racial/ethnic segregation, low socioeconomic status, and high rates of homicide and other criminal activities.14
GISs support the integration and analysis of large quantities of information from disparate sources. In addition, the maps produced with GIS software offer a unique method for visualizing an array of community characteristics, communicating them to nontechnical audiences, and incorporating them into a planning process.15,16 These systems have been used for health research and policymaking in a variety of areas, including the surveillance and monitoring of environmental and biological disease agents, to describe and analyze infectious and chronic disease health outcomes, and to evaluate health care access and utilization.17,18 Connect to Protect projects in each city used their GIS-produced maps to determine a neighborhood and population of focus, recruit appropriate community partners for the focus population and neighborhood, examine geographic and neighborhood characteristics that may contribute to HIV infection rates, and garner community support for the project’s objectives.19,20
LIMITATIONS OF DATA FOR GEOGRAPHIC INFORMATION SYSTEMS
Structural, organizational, and technical barriers limit the usefulness and accessibility of public data. Federal, state, and local governmental agencies routinely collect and analyze a wide assortment of data to support their various missions, but they often view dissemination of these data as a “passive” service (i.e., the data are available, but people must ask for them).21,22 The utility of surveillance data can be limited by quality, suitability, and format.16 Age, completeness, and validity are important considerations for determining the quality of data. Where there are few documented cases, privacy and confidentiality restrictions may limit access to epidemiological data or may determine the temporal or spatial scale at which the data are available. Because of the relatively low numbers of reported cases of HIV/AIDS among those aged 12 to 24 years in some of the project’s cities, many health departments were reluctant to release actual case numbers for small geographic regions, such as census blocks or zip codes, and instead provided ranges for number of cases (0, 1–5, 5–10); the difficulty of representing small numbers of cases graphically has challenged other public health GIS projects.23 There may also be problems with compatibility of formats or information-sharing policies among agencies.18
Within the same city or county, the reporting and management of data on STIs, HIV/AIDS, and crime can differ by temporal or spatial scale. In making comparisons between cities, we have found no standard quality assurance practices implemented by health departments; reported addresses or zip codes may not be accurate, and some data sets have large percentages of missing ethnicity or geographic data. Despite these limitations, a wealth of publicly available information exists that could be integrated and analyzed with a GIS database to support the tailoring and implementation of evidence-based interventions and structural changes designed to prevent HIV transmission. Moreover, objectives for improving public health infrastructure listed in the Healthy People 2010 plan include increasing (1) public access to information and surveillance data, (2) use of geocoding in health data systems, and (3) the amount of data available for all population groups.24
FEASIBILITY IN COMMUNITY SETTINGS
A range of GIS software now incorporates relatively intuitive graphical user interfaces.16 In addition, numerous training courses are available nationwide for those eager to learn and apply this technology. The expense of GIS software may be a barrier for community implementation; the most commonly used GIS software packages, MapInfo Professional version 9.0 (MapInfo Corp, Troy, NY) and ArcView version 9.2 (ESRI, Redlands, Calif), cost $1500 per user license. The World Health Organization has been developing an accessible mapping system based on ArcView data standards.25 Free mapping programs are available, but they may require more technical skill and often do not afford formal technical support.26 Several cities—for example, Baltimore, Md27—have also made interactive GIS mapping systems available to the public for crime data and other neighborhood indicators. Although some research on creating GISs with community input has demonstrated the acceptability of a GIS to experienced computer users,28 there has been no previous attempt to evaluate the capacity of nontechnical staff to obtain and incorporate a range of data types into a coherent GIS-based analysis.
CONNECT TO PROTECT GOALS AND METHODOLOGY
The Adolescent Medicine Trials Network for HIV/AIDS Interventions (ATN), which supports Connect to Protect, was initiated in March 2001 to implement clinical, biological, and behavioral research studies of youths living with HIV or at risk for HIV infection. The National Institute of Child Health and Human Development funded ATN sites in 15 cities in 7 states, the District of Columbia, and Puerto Rico from 2001 to 2006. The Connect to Protect project, the primary HIV-prevention research protocol of the ATN, was being implemented at all ATN sites from 2001 to 2006. Connect to Protect is managed by a National Coordinating Center1 based at Johns Hopkins University School of Medicine. Each Connect to Protect site is based at a major public health and medical research institution.
A complete description of the Connect to Protect project has been described elsewhere.1 In brief, Connect to Protect is based on the theory that structural factors affect youths’ risk of HIV infection and are an appropriate target for intervention. In preparation for planning structural interventions, data elements shown to be correlated with youths’ risk of HIV infection, or that may contribute to that risk, were collected from local, state, or other sources and combined to determine aggregate risk. Additional data that indicated unprotected sexual intercourse and transmission of STIs among young people were also collected. HIV disproportionately affects low-income people in the United States, so indicators of socioeconomic status such as percentage of the population living below the federal poverty line, percentage of owner-occupied households, and percentage of female-headed households were analyzed. Homicide data were also requested. Sites could also include other data points that they found to be relevant to local HIV risk among youths, including rates of pregnancy, other infectious diseases, and arrest.
To collect the data necessary for this report, Connect to Protect coordinators and National Coordinating Center staff analyzed materials from the first phase of the project. Each site was required to submit copies of key memos and data summaries, which were made available to site workers, Connect to Protect coordinators, and National Coordinating Center staff. Project archives examined by the authors included checklists of completed required maps (to determine which sites were made able to complete which required components), data acquisition report forms (detailing the types and format of data received), geographic summary memos (in which each site determined 1 to 3 zip codes or neighborhoods of highest risk for HIV transmission among youths), and all maps produced for each site. To collect additional detail on the process of data acquisition, all site coordinators completed an 8-page written survey.
Project Data Collection Requirements and Mapping Training
The first phase of Connect to Protect focused on gathering site-specific epidemiological data, entering it into GIS software (Map-Info Professional version 7.0), and producing maps to determine neighborhoods where youths at highest risk for HIV/ AIDS resided. Phase I began in March 2002 for 5 sites and in December 2002 for the remaining 10 sites. The 15 Connect to Protect site coordinators came from a range of academic and social service backgrounds, including public health, social work, psychology, and sociology. None had prior experience with GIS.
The National Coordinating Center employed a mapping and epidemiology specialist who traveled to each site and trained coordinators. The 2-day (14-hour) training period was composed of interactive activities through which coordinators learned to download base maps, import and export data, calculate disease rates and other risk factors, create thematic maps, geocode database information, and modify presentation layouts. The mapping specialist was available for consultation throughout the data collection and mapping phases of the project, and coordinators received 1 to 20 hours of technical assistance (in addition to the 14-hour training period) during the preparation of their maps. A project with North Carolina health department staff indicates that GIS training is most effective when it is based on a project, is relevant to an organizational mission, and is provided with ongoing technical assistance, conclusions supported by the Connect to Protect experience.29
To build their GIS databases, participating cities were directed to collect legally reportable morbidity data for the years 1998 to 2002 of gonorrhea, syphilis, HIV, and AIDS cases among individuals aged 12 to 24 years. Sites were instructed to obtain data grouped by gender, race, and year, and at the most specific level of geography available (i.e., census block group was preferable to census tract, which was preferable to zip code–level data), and to map rates of disease rather than numbers of cases. Sites were also required to collect data on homicides for the same time period. Sources of data were local and state public health departments, police departments, and the US Census Bureau. The National Coordinating Center compiled data on the 2000 US census using CensuSmart 2000 (Geolytics Inc, East Brunswick, NJ). These data were used for the population denominators used to calculate youth-specific disease rates and to map measures of socioeconomic status, including percentages of residents with household incomes below the poverty level, owner-occupied dwellings, female-headed households, and high school graduates. Sites obtained electronic base maps showing the boundaries of zip codes, counties, and cities from the US Census Bureau30 and then matched disease, crime, and demographic data to those geographic areas.
The maps that the sites were required to produce as part of Phase I of the Connect to Protect Project included those showing rates of gonorrhea, syphilis, HIV, and AIDS among people aged 12 to 24 years and, whenever possible, maps showing rates broken down by gender and ethnicity. A map showing a summary of homicides was also required.
Sites calculated incidence or prevalence rates of disease using multiyear averages of counts of cases per geographic area (most sites used zip code as the basic geographic unit of analysis) and dividing the averages by the youth population from 2000 census data for that geographic area. Using various methods (standard deviation, clinically significant infection rates, and so on), sites decided what data range was most appropriate for the maps; they also decided what type of formatting and presentation (color, scale) would be most useful in presenting the data to researchers and community members. Sites also produced overlay maps that combined 1 or more risk factors—for example, a map showing census block–level poverty rates with highlighted areas of high STI incidence.
Data Collection Process
The data collection process lasted from 2 months (2 sites) to 2 years (1 site), with an average of 7.33 months. The sources of each type of data, and the formats in which they were presented, are shown in Table 1 ▶. The characteristics of the data obtained are summarized in Table 2 ▶.
TABLE 1—
Percentages of Data Type, by Data Source and Collection Format: Connect to Protect Project, 2001–2006
| Type of Data, % | |||
| STI (Gonorrhea, Syphilis) | HIV/AIDS | Homicide | |
| Data source | |||
| City | 33 | 33 | 73 |
| County | 26 | 26 | 6 |
| State | 33 | 40 | 20 |
| Research institution | 6 | 6 | |
| Local nongovernmental source | 6 | ||
| Data formata | |||
| Microsoft Excelb | 86 | 73 | 33 |
| Other database output (e.g., Microsoft Office Accessb) | 6 | 6 | 13 |
| Hard copy | 13 | 26 | 13 |
| Map (ArcView shapefile) | 6 | ||
| Obtained from Web sitesc | 20 | ||
Note. STI = sexually transmitted infection.
aFormat in which data was given to sites from the various sources.
bMicrosoft Excel and Microsoft Office Access (Microsoft Corp, Redmond, Wash).
cData were not directly given to a Connect to Protect site by an individual from one of the sources listed; instead, a Connect to Protect site downloaded or copied data from the source’s Web site.
TABLE 2—
Characteristics of Data Obtained, by Data Type: Connect to Protect Project, 2001–2006
| Data Collection Characteristics | Gonorrhea, % | Syphilis, % | AIDS, % | HIV,a % | Homicide, % |
| Year | |||||
| 1997 | 13 | 6 | 6 | 6 | . . . |
| 1998 | 26 | 26 | 46 | 20 | 13 |
| 1999 | 73 | 66 | 87 | 53 | 60 |
| 2000 | 100 | 100 | 93 | 73 | 80 |
| 2001 | 93 | 93 | 100 | 73 | 80 |
| 2002 | 46 | 53 | 60 | 40 | 40 |
| Collection Schedule | |||||
| Cumulative | 26 | 33 | 60 | 40 | 6 |
| Year by Year | 73 | 66 | 40 | 34 | 73 |
| Age groupb | |||||
| 0–30 | . . . | . . . | 6 | 6 | . . . |
| 10–24 | 26 | 26 | 6 | 13 | . . . |
| 10–29 | . . . | . . . | 13 | . . . | . . . |
| 12–24 | 66 | 66 | 53 | 46 | . . . |
| 13–24 | 6 | 6 | 13 | . . . | . . . |
| 13–29 | . . . | . . . | 13 | 13 | . . . |
| Geographic Area | |||||
| CBG or census tract | 13 | 20 | 6 | . . . | 6 |
| Zip code | 60 | 60 | 73 | 66 | 20 |
| Neighborhood | 26 | 26 | 20 | 6 | 20 |
| Geocoded/address | 13 | 13 | . . . | . . . | 13 |
| Municipality | 6 | 6 | 6 | 6 | 6 |
| Police District | . . . | . . . | . . . | . . . | 46 |
| Race/Ethnicityc | |||||
| African American | 73 | 73 | 73 | 66 | 26 |
| Latino | 53 | 53 | 53 | 53 | 26 |
| White | 73 | 73 | 73 | 66 | 26 |
| Asian/Pacific Islander | 40 | 40 | 40 | 26 | . . . |
| Collection Method | |||||
| Case by case | 33 | 26 | 20 | 13 | 26 |
| Aggregate | 66 | 73 | 80 | 66 | 73 |
Note. CBG = census block group. Percentages are the percentage of total number of sites (n = 15) for which data are applicable.
a Twenty-six percent of sites were unable to obtain data on HIV.
bHomicide data were not broken down by specific age group, but 26% of data included some information regarding age.
c Twenty-six percent of sites were unable to obtain data on race/ethnicity.
Sites encountered varying levels of responsiveness from local public health departments and criminal justice sources. Connect to Protect staff had to navigate multiple layers of city or county bureaucracy to obtain data. Several jurisdictions placed stringent limits on how and with whom data could be shared, preventing project staff from sharing key data with community members and other researchers and requiring project staff to sign data-use agreements. Personal connections proved invaluable in obtaining data quickly, as did flexibility in acceptable formats and aggregation levels in which data were received.
Sites accessed disease data through city, county, or state public health departments. Almost all sites received disease data in electronic form and were able to manipulate it and upload it directly into the mapping software. Homicide data were more difficult to obtain, and multiple sites obtained data from local or state criminal justice Web sites; the National Coordinating Center encouraged them to use governmental sources for data whenever possible. Not all sites were able to obtain HIV data. Despite the federal requirement that all state and local health departments report HIV data to the Centers for Disease Control and Prevention, not all jurisdictions had fully implemented their HIV reporting systems or were able to provide these data. Six sites did not collect HIV information, and 2 sites were able to obtain data from public HIV testing programs but not data on all HIV tests performed in their area. Missing data from these 8 sites are excluded from the percentages presented in Table 2 ▶.
The time period for which data were available ranged from 1 year (for syphilis [1 site], HIV [1 site], AIDS [1 site], and crime [several sites]) to 5 years (several sites for multiple types of data). Most sites were able to obtain health and crime data broken down into individual years. Year-by-year data were more available for gonorrhea (73%) and syphilis (66%) than for HIV (40%) or AIDS cases (40%); in many cases, health departments were unwilling to release year-by-year data because of the small number of reported cases among people aged 12 to 24 years.
The age range available to sites varied, but all sites were able to obtain STI or HIV/AIDS case data that approximated that of data for people aged 12 to 24 years, the project’s defined “youth” population. Releasing aggregate data was one strategy health departments used to address confidentiality concerns; another was to release ranges of cases (e.g., 1–5) for geographic units with low total numbers.
The data’s level of geographic specificity varied considerably, from geocoded data to the municipality (county) level in Puerto Rico. Most common was the zip code, which was the level at which most sites (60%) mapped disease rates and cases. Some sites were able to create point maps (a mapped representation that includes a point for each reported instance) for crime data (Figure 1 ▶), but no site requested disease data at the individual address level because of privacy concerns. One site’s local public health department created a slightly offset point map of individual STI cases for the project, but it did not release individual address–level data to Connect to Protect staff. Ethnicity data were available for most public health data at most sites, but the specific ethnicities for which data were available varied by location. Some sites were unable to obtain ethnic-specific data for morbidity calculations, usually because a large percentage of records were missing information on race and ethnicity. All sites where these data were available obtained information at least for White, Latino, and African American populations.
FIGURE 1—
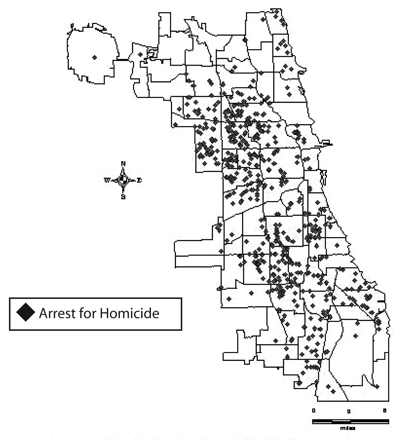
Reported arrests (N = 975) for homicide among youths aged 12 to 24 years, by community area: Chicago, Ill, 1999–2001.
Source. Data obtained from the Chicago Police Department. Map courtesy of Connect to Protect Chicago. Note. Each red marker indicates a single arrest.
Challenges of the Data Collection Process
Although sites had originally planned to obtain data based on small geographic units (i.e., census block group or census tract), few health departments were able to provide this level of precision. Most health departments reported some data that were undefined by geographic level (e.g., at 1 site, between 5% and 35% of different types of data were reported without geographic identifiers). Many sites were unable to create disease rate maps for ethnic subpopulations of youths because of missing race/ethnicity data or disparities between census race/ethnicity definitions and the ways in which health departments collect and store these data. Sites attempted to verify all data through ongoing discussions with key staff at source agencies (usually epidemiologists), because in many cases there were no alternate sources with which to triangulate results. Another limitation for GIS analysis is the need for local, on-the-ground knowledge to supplement mapped findings; specific geographic features of local sites may not always be apparent from mapped data. Especially in communities where data are available only for relatively large geographic areas (e.g., zip codes), the variation within these areas, although not visible on the maps, may be significant.
Maps, Data Summaries, and Intervention Planning
Each site was able to produce the required maps for the project protocol for all data obtained. Figures 1 ▶ and 2 ▶ give examples of the required maps. To transform data into appropriate formats for mapping, sites received assistance from the mapping specialist. The specialist also provided support on layout decisions and design of maps.
FIGURE 2—
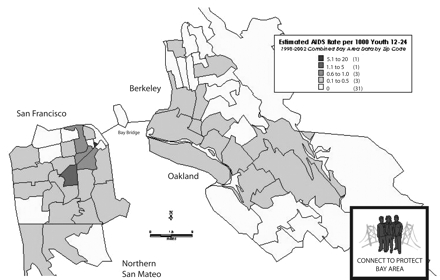
Estimated AIDS rate (per 1000) among youths 12 to 24 years, by zip code: San Francisco Bay Area, Calif, 1998–2002.
Note. The total number of AIDS cases reported from 1998 to 2002 was 199. The average AIDS rate per zip code for the area was 0.135 per 1000.
All sites completed a geographic summary memo detailing their determination of which neighborhoods were the highest-risk environments for youths’ acquisition of HIV, as indicated by the rates of HIV, STIs, poverty, and homicide. As part of this process, sites convened community members and other research staff to discuss the significance of the maps, and each site determined its own process for using mapped data. All sites found it necessary to apply their knowledge of local geography to the data portrayed in the epidemiological profile maps. Each site also determined the youth population of focus (e.g., young men who have sex with men, young African American women) most at risk in their target geographic area through analysis of the mapped data as well as interviews with local service providers. This determination was used to guide each city’s recruitment of community partners, who develop and advocate for structural changes. Connect to Protect staff reported that without the mapped data, they would have been more likely to fall back on “received wisdom” about which groups of youths and which neighborhoods would be suitable targets for structural intervention.
DISCUSSION
This aspect of the Connect to Protect project has demonstrated the accessibility and utility of publicly available data for program planning and for assessing STI, HIV/AIDS, and homicide risk in 15 cities across the United States and in Puerto Rico. By applying a GIS, nontechnical staff were able to create and analyze maps of disease rates, homicide data, and demographic indicators that supported innovative community-level analysis of HIV risk among youths. The use of GIS technology was a relatively inexpensive way for a large amount of data to be analyzed and presented in a comprehensible format to multiple audiences. By linking layers of data showing factors that contribute to risk for HIV infection, local staff created a multifaceted understanding of neighborhoods and communities where intervention might have the most impact on the progress of the epidemic.
In these 15 communities, the visible representation of the epidemiology of risk informed discussions with local community leaders and youths, as well as ongoing planning for HIV prevention interventions. Data were obtained in a reasonably timely manner in most cases and were usually available in formats that could be easily incorporated into a GIS. Sites were able to create maps with small enough geographic areas of focus (zip code) to provide useful information for project planning. Project staff’s ongoing relationships with local health experts allowed them to confirm the accuracy of their mapping; these relationships will facilitate future access to data for program evaluation and needs assessment activities. Although most sites did not construct composite maps incorporating multiple types of information (i.e., using algorithms to calculate an index of composite risk for each neighborhood and then mapping the results), GIS software makes it possible to do so.
The Connect to Protect project demonstrates that researchers, community service providers, and advocates may benefit from collecting publicly available data and using a GIS for community-level needs assessment, program planning, and program evaluation. Organizations or researchers embarking on a GIS analysis project can refer to the Connect to Protect experience to anticipate potential problems regarding data availability, data quality, training needs, and data interpretation. Community providers may need technical assistance to help them use these data effectively and translate them into easily understood maps; however, the potential benefits of this process are substantial. Mapped data are often visually striking and easily understood by a range of stakeholders, from community members to researchers and policymakers.
Maps produced by Connect to Protect staff were used both to support decisionmaking and to spark community discussion about collecting and accurately reporting data. Similar processes could be useful in analyzing other health issues that have community-level risk components. Areas for further research include studying the feasibility of making complex mapping technology available to a wider range of users and assessing the usefulness of mapped data in evaluating a program’s impact over longer periods of time. GIS technology has the potential to play a critical role in determining how to target resources for HIV prevention and in communicating complex public health data to multiple audiences.
Acknowledgments
This work was conducted during the first project period of the Adolescent Medicine Trials Network for HIV/AIDS Interventions (ATN I). The ATN I was funded by the National Institutes of Health (grant U01 HD40533).
The following ATN I sites participated in this study: University of South Florida: Patricia Emmanuel, Diane Straub, Shannon Cho, Georgette King, Mellita Mills, and Chodaesessie Morgan; Childrens Hospital of Los Angeles: Marvin Belzer, Miguel Martinez, Veronica Montenegro, Ana Quiran, Angele Santiago, and Gabriela Segura; Children’s Hospital National Medical Center: Lawrence D’Angelo, William Barnes, Bendu Cooper, and Cassandra McFerson; the Children’s Hospital of Philadelphia: Bret Rudy, Antonio Cardoso, and Marné Castillo; John H. Stroger Jr. Hospital and the CORE Center: Jaime Martinez, and Zephyr Beason; University of Puerto Rico: Irma Febo, Ileana Blasini, Ibrahim Ramos-Pomales, and Carmen Rivera-Torres; Montefiore Medical Center: Donna Futterman, Sharon S. Kim, Lissette Marrero, Stephen Stafford, and Carol Tobkes; Mount Sinai Medical Center: Linda Levin, Meg Jones, Christopher Moore, and Kelly Sykes; University of California at San Francisco: Barbara Moscicki, Coco Auerswald, and Kevin Sniecinski; Tulane University Health Sciences Center: Sue Ellen Abdalian, Lisa Doyle, Trimika Fernandez, and Sybil Schroeder; University of Maryland: Ligia Peralta, Bethany Griffin Deeds, Sandra Hipszer, Maria Metcalf, and Kalima Young; University of Miami School of Medicine: Lawrence Friedman, Angie Lee, Kenia Sanchez, Benjamin Quiles, and Shirleta Reid; Children’s Diagnostic and Treatment Center: Ana Puga, Dianne Batchelder, Jamie Blood, Pam Ford, and Jessica Roy; Children’s Hospital Boston: Cathryn Samples, Wanda Allen, Lisa Heughan, and Judith Palmer-Castor; University of California at San Diego: Stephen Spector, Rolando Viani, Stephanie Lehman, and Mauricio Perez.
The authors also acknowledge Connect to Protect’s National Coordinating Center at Johns Hopkins School of Medicine and DePaul University’s Quality Assurance Team, including staff members and consultants Nancy Willard, Suzanne Maman, Marizaida Sánchez-Cesáreo, Matthew Bowdy, Rachel Lynch, Audrey Bangi, Mimi Doll, Jason Johnson, Danish Meherally, Grisel
Robles, and Leah Neubauer. We also thank the ATN Data and Operations Center (Westat Inc), including Jim Korelitz, Barbara Driver,
Lori Perez, Rick Mitchell, Stephanie Sierkierka, and Dina Monte, and individuals from the ATN Coordinating Center at the University of Alabama, Birmingham, including Craig Wilson, MD, Cindy Partlow, MEd, Marcia Berck, and Pam Gore.
Human Participant Protection This study was approved by the institutional review boards of all participating Adolescent Medicine Trials Network for HIV/AIDS Interventions sites.
Peer Reviewed
Contributors C.G. Geanuracos and S.D. Cunningham developed the GIS-focused secondary analyses, synthesized them, and led the writing. G. Weiss, D. Forte, and L. M. Henry Reid assisted with the study and analyses. J. M. Ellen originated and supervised the Connect to Protect project and suggested a detailed analysis of the GIS component. All authors helped to conceptualize ideas, interpret findings, and write and review draft components of the article.
References
- 1.Ziff MA, Harper GW, Chutuape KS, et al. Laying the foundation for Connect to Protect: a multi-site community mobilization intervention to reduce HIV/AIDS incidence and prevalence among urban youth. J Urban Health. 2006;83(3):506–522. [DOI] [PMC free article] [PubMed] [Google Scholar]
- 2.HIV/AIDS Surveillance Report, 2004. Atlanta, Ga: Centers for Disease Control and Prevention; 2005.
- 3.Thomas JC, Clark M, Robinson J, Monnett M, Kilmarx PH, Peterman TA. The social ecology of syphilis. Soc Sci Med. 1999;48:1081–1094. [DOI] [PubMed] [Google Scholar]
- 4.Aral SO, Holmes KK, Padian NS, Cates W Jr. Overview: individual and population approaches to the epidemiology and prevention of sexually transmitted diseases and human immunodeficiency virus infection. J Infect Dis. 1996; 174(suppl 2):S127–S133. [DOI] [PubMed] [Google Scholar]
- 5.Ross MW, Henry D, Freeman A, Caughy M, Dawson AG. Environmental influences on safer sex in young gay men: a situational presentation approach to measuring influence on sexual health. Arch Sex Behav. 2004;33: 249–257. [DOI] [PubMed] [Google Scholar]
- 6.Hamers FF, Peterman TA, Zaidi AA, Ransom RL, Wroten JE, Witte JJ. Syphilis and gonorrhea in Miami: similar clustering, different trends. Am J Public Health. 1995;85: 1104–1108. [DOI] [PMC free article] [PubMed] [Google Scholar]
- 7.Becker KM, Glass GE, Brathwaite W, Zenilman JM. Geographic epidemiology of gonorrhea in Baltimore, Maryland, using a geographic information system. Am J Epidemiol. 1998;147: 709–716. [DOI] [PubMed] [Google Scholar]
- 8.Zenilman JM, Glass G, Shields T, Jenkins PR, Gaydos JC, McKee KT Jr. Geographic epidemiology of gonorrhea and chlamydia on a large military installation: application of a GIS system. Sex Transm Infect. 2002;78:40–44. [DOI] [PMC free article] [PubMed] [Google Scholar]
- 9.Zenilman JM, Ellish N, Fresia A, Glass G. The geography of sexual partnerships in Baltimore: applications of core theory dynamics using a geographic information system. Sex Transm Dis. 1999;26:75–81. [DOI] [PubMed] [Google Scholar]
- 10.Winter AJ, Sriskandabalan P, Wade AAH, Cummins C, Barker P. Sociodemography of genital Chlamydia trachomatis in Coventry, UK, 1992–6. Sex Transm Infect. 2000;76: 103–109. [DOI] [PMC free article] [PubMed] [Google Scholar]
- 11.Shahmanesh M, Gayed S, Ashcroft M, et al. Geomapping of chlamydia and gonorrhoea in Birmingham. Sex Transm Infect. 2000;76:268–272. [DOI] [PMC free article] [PubMed] [Google Scholar]
- 12.Weir SS, Pailman C, Mhalela X, et al. From people to places: focusing AIDS prevention efforts where it matters most. AIDS. 2003;17: 895–903. [DOI] [PubMed] [Google Scholar]
- 13.Potterat JJ, Rothenberg RB, Wood-house DE, Muth JB, Pratts CI, Fogle JS. Gonorrhea as a social disease. Sex Transm Dis. 1985;12:25–32. [DOI] [PubMed] [Google Scholar]
- 14.Ellen JM. The next generation of HIV prevention for adolescent females in the United States: linking behavioral and epidemiologic sciences to reduce incidence of HIV. J Urban Health. 2003; 80(4):iii40–iii49. [DOI] [PMC free article] [PubMed] [Google Scholar]
- 15.Nobre FF, Braga AL, Pinheiro RS, Lopes JAS. GIS Epi: a simple geographical information system to support public health surveillance and epidemiological investigations. Comput Methods Programs Biomed. 1997;53: 33–45. [DOI] [PubMed] [Google Scholar]
- 16.Boulos MNK, Roudsari AV, Carson ER. Health geomatics: an enabling suite of technologies in health and healthcare. J Biomed Inf. 2001;34: 195–219. [DOI] [PubMed] [Google Scholar]
- 17.Cromley EK. GIS and disease. Annu Rev Public Health. 2003;24:7–24. [DOI] [PubMed] [Google Scholar]
- 18.McLafferty SL. GIS and health care. Annu Rev Public Health. 2003;24: 25–42. [DOI] [PubMed] [Google Scholar]
- 19.Blankenship KM, Bray SJ, Nerson MH. Structural interventions in public health. AIDS. 2000;14(suppl 1): S11–S21. [DOI] [PubMed] [Google Scholar]
- 20.Sumartojo E. Structural factors in HIV prevention: concepts, examples, and implications for research. AIDS. 2000;13(suppl 1):S3–S10. [DOI] [PubMed] [Google Scholar]
- 21.Korte GB. The GIS Book. 5th ed. Clifton Park, NY: OnWord Press; 2001.
- 22.Krieger N, Waterman PD, Chen JT, Soobader MJ, Subramanian SV. Monitoring socioeconomic inequalities in sexually transmitted infections, tuberculosis, and violence: geocoding and choice of area-based socioeconomic measures—The Public Health Disparities Geocoding Project (US). Public Health Rep. 2003; 118:240–260. [DOI] [PMC free article] [PubMed] [Google Scholar]
- 23.Grigg M, Alfred B, Keller C, Steele J. Implementation of an Internet-based geographic information system: the Florida experience. J Public Health Manage Pract. 2006;12:139–145. [DOI] [PubMed] [Google Scholar]
- 24.Healthy People 2010. Washington, DC: US Department of Health and Human Services; 2000.
- 25.World Health Organization. Public health mapping and GIS. Available at: http://www.who.int/health_mapping/tools/en. Accessed August 1, 2007.
- 26.FreeGIS Project Web site. Available at: http://freegis.org. Accessed August 1, 2007.
- 27.Baltimore city map. Available at: http://maps.baltimorecity.gov/imap. Accessed August 1, 2007.
- 28.Buckeridge DL, Mason R, Robertson A, et al. Making health data maps: a case study of a community/university research collaboration. Soc Sci Med. 2002;55:1189–1206. [DOI] [PubMed] [Google Scholar]
- 29.Miranda ML, Silva JM, Galeano MA, et al. Building geographic information system capacity in local health departments: lessons from a North Carolina project. Am J Public Health. 2005; 95:2180–2185. [DOI] [PMC free article] [PubMed] [Google Scholar]
- 30.US Census Bureau. Cartographic boundary files. Available at: http://www.census.gov/geo/www/cob/bdy_files.html. Accessed August 6, 2007.