

Abstract
Objectives. We investigated changes in socioeconomic inequalities in cancer mortality rates among men in France between 1968 and 1996.
Methods. We used a representative sample of 1% of the French population and studied 4 periods (1968–1974, 1975–1981, 1982–1988, and 1990–1996). Causes of death were obtained by direct linkage with the French national death registry. The socioeconomic position of men aged 35 to 59 years was measured by using the occupational class reported at the time of the census at the beginning of each period. Analyses were conducted for all cancers and specifically for lung, upper aerodigestive tract, esophageal, colorectal, and other cancers.
Results. In all analyses, we observed socioeconomic inequalities during the 4 periods considered; the inequalities increased between the first and the last period. Most of the total increase occurred between 1968 and 1981, and inequalities remained stable thereafter. Inequalities were larger when men out of the labor force were included in the analysis. The strongest increase in socioeconomic inequalities over time was observed for upper aerodigestive tract cancer.
Conclusions. Although cancer mortality rates have decreased, substantial socioeconomic inequalities in cancer mortality among men remain.
Changes over time in socioeconomic inequalities in mortality rates by cause of death among men have been examined principally in northern Europe, the United States, and the United Kingdom.1–7 In France, changes over time in socioeconomic inequalities in cause-specific mortality rates have not been examined extensively,8,9 and little is known regarding cancer mortality rates. The study of cancer mortality rates is of special interest in France because cancer rather than cardiovascular disease is the leading cause of premature mortality (before the age of 65 years). A comparative study found that cancer mortality contributed to approximately 40% of socioeconomic inequalities in total mortality in France, Italy, and Switzerland, compared with fewer than 20% in the United Kingdom and northern Europe.10 A comparative study including Italy, the United Kingdom, and northern European countries and focusing on time trends in socioeconomic inequalities in mortality rates found that trends in socioeconomic inequalities in cardiovascular mortality rates accounted for a large part of the change in the socioeconomic inequalities in all-cause mortality rates in all countries except Italy.11
In addition, mortality rates by cancer site have been investigated in a few studies, but none of them have included data for France. Most of them have considered lung cancer2–4,6,7,12 and less often colorectal cancers separately.6,12 Few results are available on prostate6 and stomach cancer.4
For lung cancer mortality rates, socioeconomic inequalities are observed in all countries; in France, large inequalities are also observed for non–lung cancer mortality rates.10 This is principally attributable to upper aerodigestive tract (UADT) cancers, which in France are both frequent and unequally distributed among social classes.13
The situation in France is specific with regard to cancer mortality rates, with large socioeconomic inequalities in lung cancer and non–lung cancer mortality rates. Investigating changes in socioeconomic inequalities in cancer mortality rates by cancer site in this context may provide leads to identify factors associated with cancer incidence and survival, as well as to formulate prevention strategies.
We describe changes in socioeconomic inequalities in cancer mortality among French men between 1968 and 1996.
METHODS
In 1968, the French National Statistics Institute created a longitudinal population study (the permanent demographic samples), which represented roughly 1% of the French population. The sample includes all persons born on any 1 of 4 specific calendar dates in any year and is regularly updated to include new subjects with any of these birthdays (births and immigrants). Data are updated at each successive census (1968, 1975, 1982, 1990). The institute supervises the keeping of vital records, and thus vital status is also systematically monitored for demographic sample subjects.14 Causes of death for our study were obtained by linkage with the French national death registry (Institut National de la Sarté et de la Recherche Médicale–Centre d’Epidémiologie sur les Causes Médicales de Décès [INSERM-CepiDc; National French Institute for Health and Medical Research, Department of Epidemiology on Medical Causes of Death]).
We studied 4 cohorts (1968–1974, 1975–1981, 1982–1988, and 1990–1996; 1989 was excluded to avoid overlap between 2 consecutive periods). Each cohort began in the year of a census and included all men who responded to the census and who were aged 35 to 59 years at that time. Each cohort was followed for up to 7 years. If the men were still aged between 35 to 59 years at the end of the follow-up period, they were included in the successive cohort. Men not born in metropolitan France (approximately 15% at each census), including foreigners who died abroad, were excluded because their vital status was not adequately recorded. Men for whom data were inconsistent (fewer than 50 at each census) were also excluded. Overall, 10187 men were excluded in 1968, 11159 in 1975, 12542 in 1982, and 14238 in 1990. The cause of death was identified for slightly more than 95% of those who died in the 1968 to 1974 period and approximately 98% of the deaths for the later time periods.
Measures
The analysis was conducted for overall cancer mortality and for the following cancer sites: lung (International Classification of Diseases, Injuries and Causes of Death, Ninth Revision [ICD-9]15 code 162), UADT (ICD-9 140–149, 161, 160.8), esophagus (ICD-9 150), colon-rectum (ICD-9 153–154), and other cancers (ICD-9 150–159, 160 [except 160.8], 163–239). The latter category could not be further divided because of the small number of deaths in each period for specific cancer sites. During the study period, lung cancer accounted for 24% of all cancer deaths, UADT cancers for 21%, esophageal cancer for 8%, and colorectal cancers for 6%.
Socioeconomic status was measured by occupational class as reported at the time of the census. Men who failed to report their occupational class (fewer than 0.5% in 1968, 1975, and 1982; fewer than 2% in 1990) were excluded from the analysis. The final analysis concerned 59563 men in 1968, 61778 men in 1975, 65723 men in 1982, and 72841 men in 1990. Occupational class was coded according to the 7-class collapsed version of the classification developed by Erikson, Goldthorpe, and Portecarero (EGP codes)16: I–II (professionals), III (routine nonmanual workers), IVa–IVb (self-employed workers), IVc (farmers), V–VI (skilled workers), VIIa (unskilled workers), VIIb (agricultural laborers). No EGP code was assigned to those not in the labor force (i.e., those not working for reasons of health or choice: the retired, disabled, ill, and so on). Unemployed job seekers were classified according to the occupational class they reported in the census.
Statistical Analysis
We conducted 2 sets of analyses: (1) an analysis limited to those in the labor force (using the 7-class collapsed version of EGP)> and (2) an analysis of all participants, considering those not in the labor force as an additional category at the bottom of the social scale (using 7-class collapsed version of EGP plus 1 category called “not in the labor force”).
Comparisons over time, as well as the interpretation of the results, are complicated by the possibility that the distribution of occupational classes in the population may change over time—that is, that some groups may grow larger whereas others become more marginal. The use of the relative index of inequality (RII) as a measure of socioeconomic inequalities overcomes this problem.17–19 The calculation of the RII is based on a ranking variable for the socioeconomic position. For each educational group, this new socioeconomic index corresponds to the relative position of that group in the social hierarchy, that is, to the proportion of the population with a higher social status. Therefore, this is a continuous index with a value of 0 for someone at the top of the social scale and 1 for a person at the bottom. The values 0 and 1 correspond not to the highest and lowest categories but to the extremes of these categories and represent extreme, possibly hypothetical, situations.
To obtain the RII, a Cox regression model was used to regress mortality on this new socioeconomic index. In all Cox regression models, age was used as the timescale variable. The RII can be interpreted as the ratio of mortality rates of those with the lowest to those with the highest socioeconomic status. The larger the RII, the greater the degree of inequality across the socioeconomic hierarchy. In contrast to relative risk between extreme groups of the social range, the RII is estimated with the full distribution and provides a continuous measure of socioeconomic inequalities, which is used to compute the RII, that simultaneously take into account the size and relative position of each social group.
Mortality rates adjusted for age by direct standardization, with the total male person-years for the period 1968 to 1996 used as the standard, were also calculated. Age-adjusted mortality rates are presented only for professionals, skilled and unskilled workers, and men not in the labor force.
RESULTS
The distribution of the population according to occupational class changed substantially between 1968 and 1990 (Table 1 ▶). The proportion of men employed in agricultural occupations decreased strongly, and that of professionals increased substantially. The proportion of manual workers remained relatively stable, but the fraction of unskilled workers within that group decreased. The proportion of men not in the labor force increased over time.
TABLE 1—
Occupational Class Distribution Among Men, by Study Period: France, 1968–1996
| Occupational Class | 1968–1974, no. (%) | 1975–1981, no. (%) | 1982–1988,a no. (%) | 1990–1996, no. (%) |
| Total labor force | 59 563 (92.9) | 61 778 (93.8) | 65 723 (91.1) | 72 841 (90.6) |
| Professionals | 11 762 (19.8) | 14 419 (23.3) | 18 052 (27.5) | 24 406 (33.5) |
| Routine nonmanual workers | 4474 (7.5) | 4592 (7.4) | 4968 (7.6) | 4416 (6.1) |
| Self-employed | 6049 (10.2) | 5864 (9.5) | 6150 (9.3) | 6674 (9.1) |
| Farmers | 8138 (13.6) | 6886 (11.2) | 5890 (8.9) | 4272 (5.9) |
| Skilled workers | 12 036 (20.2) | 14 426 (23.4) | 15 298 (23.3) | 17 205 (23.6) |
| Unskilled workers | 10 904 (18.3) | 10 448 (16.9) | 8588 (13.1) | 8277 (11.4) |
| Agricultural laborers | 1992 (3.3) | 1310 (2.1) | 940 (1.4) | 724 (1.0) |
| Not in the labor force | 4208 (7.1) | 3833 (6.2) | 5837 (8.9) | 6867 (9.4) |
a1989 was excluded as a study year to avoid overlap between 2 consecutive study periods.
RIIs are reported in Table 2 ▶. Inequalities for all-cancer mortality increased substantially between 1968 and 1974 and between 1975 and 1981 among all men and remained relatively stable after 1982. Among labor force participants, a similar increase in inequalities was observed at the beginning of the period; then the RII decreased between the second and the third period, although confidence intervals overlapped, and remained stable thereafter. Similar results were observed for lung cancer.
TABLE 2—
Relative Indices of Inequality (RIIs) and 95% Confidence Intervals (CIs) for Different Cancer Sites, by Study Period: France, 1968–1996
| 1968–1974 | 1975–1981 | 1982–1988a | 1990–1996 | |||||
| Cancers | Deaths, No. | RII (95% CI) | Deaths, No. | RII (95% CI) | Deaths, No. | RII (95% CI) | Deaths, No. | RII (95% CI) |
| All cancers | ||||||||
| All menb | 944 | 1.96 (1.58, 2.45) | 1168 | 3.75 (3.05, 4.62) | 1625 | 3.65 (3.05, 4.36) | 1457 | 3.90 (3.22, 4.73) |
| Men in the labor forcec | 803 | 1.88 (1.47, 2.41) | 994 | 3.62 (2.88, 4.55) | 1237 | 2.61 (2.13, 3.20) | 1036 | 2.64 (2.12, 3.31) |
| Lung cancer | ||||||||
| All menb | 168 | 1.64 (0.98, 2.75) | 272 | 3.67 (2.39, 5.62) | 435 | 3.45 (2.45, 4.86) | 391 | 3.86 (2.66, 5.60) |
| Men in the labor forcec | 143 | 1.59 (0.88, 2.85) | 238 | 4.42 (2.76, 7.09) | 331 | 2.64 (1.78, 3.93) | 278 | 2.62 (1.71, 4.04) |
| UADT cancer | ||||||||
| All menb | 174 | 4.04 (2.35, 6.93) | 264 | 10.76 (6.66, 17.40) | 358 | 11.06 (7.26, 16.87) | 282 | 18.75 (11.23, 31.30) |
| Men in the labor forcec | 140 | 2.88 (1.58, 5.25) | 212 | 8.93 (5.26, 15.18) | 258 | 7.18 (4.47, 11.55) | 180 | 8.51 (4.81, 15.07) |
| Esophageal cancer | ||||||||
| All menb | 92 | 3.97 (1.91, 8.27) | 105 | 5.63 (2.75, 11.53) | 135 | 11.28 (5.66, 22.46) | 108 | 7.16 (3.39, 15.11) |
| Men in the labor forcec | 83 | 6.99 (3.06, 15.93) | 92 | 5.95 (2.74, 12.94) | 94 | 6.79 (3.10, 14.86) | 74 | 4.79 (2.03, 11.29) |
| Colorectal cancerd | ||||||||
| All menb | 74 | 1.39 (0.64, 3.03) | 75 | 2.59 (1.17, 5.72) | 79 | 3.54 (1.58, 7.89) | 95 | 3.01 (1.43, 6.31) |
| Men in the labor forcec | 70 | 2.53 (1.08, 5.92) | 66 | 3.13 (1.29, 7.57) | 58 | 2.07 (0.81, 5.28) | 71 | 2.48 (1.06, 5.82) |
| Other cancers | ||||||||
| All menb | 436 | 1.43 (1.04, 1.98) | 452 | 2.18 (1.58, 3.02) | 618 | 1.79 (1.36, 2.36) | 582 | 1.99 (1.49, 2.66) |
| Men in the labor forcec | 367 | 1.17 (0.81, 1.69) | 386 | 1.90 (1.33, 2.72) | 496 | 1.40 (1.02, 1.92) | 434 | 1.56 (1.11, 2.20) |
Note. UADT = upper aerodigestive tract.
a1989 was excluded as a study year to avoid overlap between 2 consecutive study periods.
bOccupational class in 8 categories: 7 categories for men in the labor force according to the occupation reported in the census and 1 category for those not in the labor force, with unemployed men classified according to their last occupation.
cOccupational class in 7 categories according to the occupation reported in the census.
dAgricultural laborers were grouped with farmers in the analyses.
Inequalities were much higher for UADT and esophageal cancers. For all men, the RII for UADT cancers increased almost 3 times from the first (1968–1974) to the second (1975–1981) period, and then it remained relatively stable. The increase observed among all men in the last period may have been attributable to random variation, because confidence intervals overlapped. The RII was generally lower for cancers of the esophagus than for cancers of the UADT and showed no clear increase or decrease throughout the period, because of wide and overlapping confidence intervals.
For colorectal and other cancers, the pattern was similar to that observed for all cancers. RIIs greater than 1, although sometimes not statistically significant, were observed for all periods.
Age-adjusted mortality rates are presented in Figure 1 ▶. Among all men, for total cancer and for most of the cancer sites, mortality rates increased from 1968 to the end of the 1980s, after which a small decline in rates was observed. For colorectal cancers among all men, however, rates were stable over the study period. Mortality rates remained globally stable for professionals. Among men in the labor force, the widening of socioeconomic inequalities in the early part of the study period resulted mainly from an increase in mortality rates among unskilled workers. There was a slight decrease in mortality rates between the 1982 to 1988 period and the 1990 to 1996 period for professionals and unskilled workers. However, except for colorectal cancers, no such decrease was observed among men not in the labor force, for whom mortality rates increased until the end of the 1980s and then stabilized, except for UADT and colorectal cancers.
FIGURE 1—
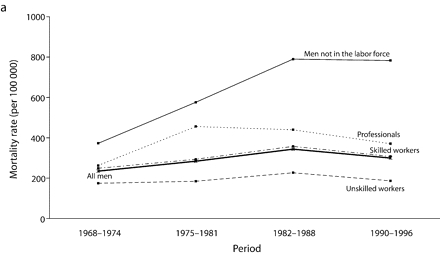
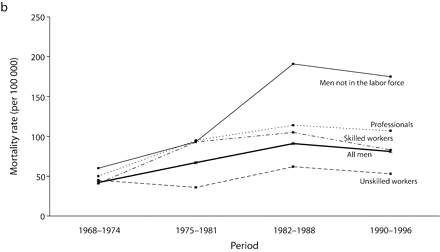
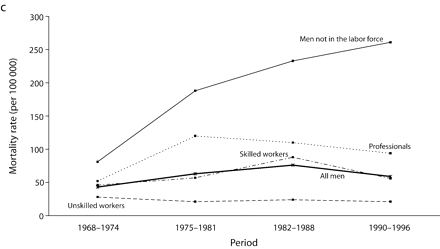
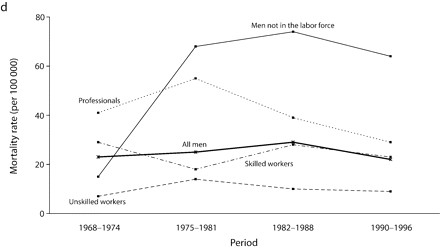
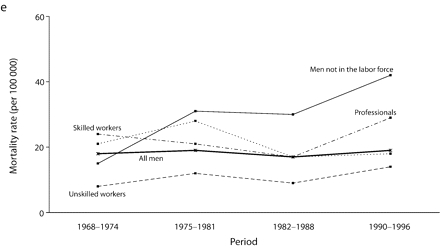
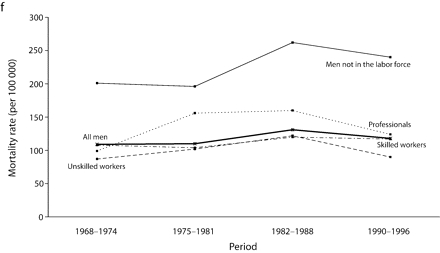
Age-adjusted mortality rates (per 100 000 male person-years) for selected occupational classes for each period for (a) all cancers, (b) lung cancer, (c) upper aerodigestive tract cancers, (d) esophageal cancer, (e) colorectal cancer, and (f) other cancers.
Note. Mortality rates are adjusted for age by direct standardization, with the use of the total male person-years for the period 1968 to 1996 as the standard.
For all cancers among all men, although the gap between professionals and inactive men widened throughout the period, the RII, which takes into account the experience of the whole population and adjusts for changes in the distribution of socioeconomic groups, remained relatively stable from the beginning of the 1980s.
DISCUSSION
This study details changes in socioeconomic inequalities in cancer mortality rates among French men between 1968 and 1996. We observed an increase in socioeconomic inequalities for all cancers and for each cancer site considered (lung, UADT, esophagus, colon-rectum, and other cancers). Most of the total increase occurred between 1968 and 1981, and inequalities remained stable thereafter. Inequalities were larger when men out of the labor force were included in the analysis.
Several studies have examined trends in socioeconomic inequalities in cancer mortality in other countries.1–5,7,20–22 Comparison with these studies is hampered by several methodological issues because they covered different periods and different age categories and used different socioeconomic indicators and different measures for the magnitude of socioeconomic inequalities. In several studies, area-based measures of socioeconomic position were used.3,5,7,12,21 When individual information was available, the population was often classified in only 2 or 3 broad groups.2,4,22 Most studies used mortality rates and the relative decrease in each socioeconomic group or rate ratios to measure socioeconomic inequalities, whereas we used the RII, a measure of inequalities that adjusts for changes in the distribution of the population over socioeconomic groups.
Despite these discrepancies, the general picture that emerges from previous studies is that socioeconomic inequalities in cancer mortality rates have increased over time among men. Inequalities have increased even though most studies show that overall cancer mortality rates have been decreasing; this decrease is most notable in the highest socioeconomic categories.3,7,21,22 In our study, the widening of socioeconomic inequalities at the beginning of the study period was mainly attributable to an increase in mortality rates among the lowest social classes. A decline between the last 2 time periods in our study in mortality rates was observed in all socioeconomic groups, resulting in socioeconomic inequalities of similar magnitude during those 2 periods.
Studies in other countries have mainly reported an increase in socioeconomic inequalities for lung cancer,1–4,6,7,12,21 although a Finnish study, covering the period 1980 to 1995, showed a decrease.6,22 A study conducted in the United States between 1950 and 1998 found that the positive gradient (that is, higher mortality rates among men with higher socioeconomic status) observed in the 1950s diminished over time and reversed in the 1970s, and socioeconomic inequalities in mortality rates are now increasing.12
Trends in socioeconomic inequalities in UADT and esophageal cancer mortality have not been studied previously. Studies on colorectal cancer have observed the emergence of higher mortality rates among men with lower socioeconomic status at the end of the 1980s, whereas no social differences6 or higher mortality rates among men with higher socioeconomic status12 were observed earlier.
Interpreting the Findings
Changes in socioeconomic inequalities in cancer mortality rates may be partially explained by changes in the social distribution of risk factors. In France, alcohol- or smoking-related cancers account for a large share of socioeconomic inequalities in cancer mortality rates in men. The recent decrease in mortality rates is probably linked to the continuous decrease in alcohol and tobacco consumption observed in France since 1960.23,24 However, among French men, alcohol and tobacco consumption is highest among men of lower socioeconomic status. Differences in these behaviors between men in and out of the labor force and among men in the labor force, increased between 1982 and 1990, especially in alcohol consumption. Given the latency period between exposure to carcinogens and the onset of cancer, these fairly recent changes may not account for the trends observed in the present study, but it is reasonable to assume that the trends we observed continue trends that began earlier.
Furthermore, our data suggest that social disparities in cancer mortality rates in men will probably persist in the near future. Differences in trends between lung, UADT, and esophageal cancer may be partly attributable to differences in risk factors or in the strength of associations. Smoking is the main cause of lung cancer, and both smoking and alcohol consumption are important risk factors for UADT and esophageal cancers. The strongest association with alcohol consumption was found for cancers of the pharynx and oral cavity, and a stronger increase was observed in social differences in alcohol consumption than in tobacco consumption.25 This may partially explain why socioeconomic inequalities for UADT cancers were the largest and showed the strongest increase over time. Variations for other risk factors, such as diet or occupational exposures, must also be taken into account. Trend data on socioeconomic differences in these factors are unfortunately not available in France.
Socioeconomic inequalities were also observed in 5-year survival rates,26–28 and past studies generally found larger inequalities in survival rates for types of cancer with a better prognosis.29 For the cancer sites investigated in our study, the survival rate was highest for colorectal and UADT cancers. Several factors related to survival (in particular, health care access and use) could then also partly explain our results. This could explain why, among alcohol- or tobacco-related cancers, inequalities observed for UADT cancers were the largest. Although in France access to health care and cancer treatment is universal, a recent study of lung cancer showed that individuals who were not employed were 3 times more likely to abstain from treatment.30 Studies reported lower screening rates among people with low socioeconomic status.31 Thus, social disparities in participation in screening programs (in particular for colorectal cancers) could also contribute to socioeconomic inequalities in cancer survival rates.
Time trends in social disparities in health care access and use could also partly explain the trends observed in socioeconomic inequalities. Unfortunately, no information is available in France on these trends. But the quality of medical treatment has greatly improved since 1968, and this could have widened socioeconomic inequalities in cancer survival (because those individuals with higher socioeconomic status were more likely to take advantage of such improvements in medical treatment). In addition, the probability of health-based selection to and from employment (i.e., that inidviduals with poorer health are more likely to go out of the labor force, or if already out, are less likely to find a new job) certainly increased over the study period, and this may also explain part of the trends.32 These 2 effects may be more important for cancers with a relatively good prognosis than for those with a poor prognosis.
Strengths and Limitations
The analyses are based on a large representative sample, with an individual matching between socioeconomic data and cause-specific mortality data. The results therefore do not suffer from the numerator and denominator bias inherent in studies in which information on occupational class for the living and the deceased population is obtained from different sources.33 Our results are restricted to men born in metropolitan France. Very little is known about socioeconomic inequalities in cancer mortality rates among migrants, and thus it is difficult to say what the results in the whole population living in France would have been. Changes in the classification of the cause of death and in coding practices may have had some effects on the observed time trends and may also partly explain differences between France and other countries. Among death certificates with a mention of cancer, cancer was more often selected as the underlying cause of death in France than in other countries.34 On the other hand, ICD coding changes had little effect on mortality trends for specific cancer sites.35
Socioeconomic inequalities were studied among all men and among men in the labor force. The inclusion of men not in the labor force as an additional category in the analyses conducted among all men may be questionable. The economically inactive are not an occupational class in the strict sense, and they are not homogeneous. However, most of them come from lower occupational classes. Since they also have higher mortality rates, their exclusion led to an underestimation of mortality inequalities by occupational class. On the other hand, their inclusion as a single class at the lowest position in the social hierarchy is likely to result in an overestimation of socioeconomic inequalities. Despite these limitations, the RII calculated in this way among all men is a summary measure of inequalities in the whole population, which takes into account changes in the proportion of economically inactive men over time. The comparison of the RIIs among all men and among men in the labor force allows a more complete description of socioeconomic inequalities in cancer mortality rates and their variation over time.
Conclusions
This study shows that, even if mortality rates are decreasing, substantial inequalities in cancer mortality rates among men in the labor force persist and are even higher when men not in the labor force are considered. This underscores the need for public health policies targeted toward the lower socioeconomic groups. The strongest increase in socioeconomic inequalities over time observed for UADT cancers suggests that special attention should be paid to the prevention and treatment of this group of cancers. Because alcohol consumption is strongly related to both UADT cancer risk and social class, programs aiming to reduce alcohol abuse may be especially useful in reducing socioeconomic inequalities for these cancers. In general, the relative part of risk factors, access to health care and use of health care, in these inequalities has not yet been determined.
Acknowledgments
This study was partially supported by a grant from a joint Mission de la Recherche–Centre National de la Recherche Scientifique (Reasearch Center–National Center for Scientific Research)–Institute National del la Santé et de la Recherche Médical (INSERM) project (grant ASE02040JSA).
Members of the Evolution des Inégalités Sociales par Causes Médicales de Décès group are Jean-François Chastang, Annette Leclerc, Danièle Luce, and Gwenn Menvielle, INSERM U687, Saint-Maurice; Béatrice Geoffroy-Perez and Ellen Imbernon, Institut de Veille Sanitaire DST, Saint-Maurice; Christine Couet and Isabelle Robert-Bobée, INSEE, Paris; Marie-Josèphe Saurel-Cubizolles, INSERM U149, Villejuif; and Eric Jougla, INSERM CepiDc, Le Vésinet.
Human Participant Protection This study was conducted in accordance with legislation and regulations concerning epidemiological studies in France. It received the approval of France’s national ethics committee (Commission Informatique et Liberté).
Peer Reviewed
Contributors G. Menvielle conducted the analyses and wrote the article. A. Leclerc originated the study. J.-F. Chastang and M. Melchior assisted with the analyses. D. Luce contributed to the interpretation of the analyses and to writing the article.
References
- 1.Marang-van de Mheen P, Davey Smith G, Hart CL, Gunning-Schepers LJ. Socioeconomic differentials in mortality among men within Great Britain: time trends and contributory causes. J Epidemiol Community Health. 1998;52:214–218. [DOI] [PMC free article] [PubMed] [Google Scholar]
- 2.Marmot MG, McDowall ME. Mortality decline and widening socioeconomic inequalities. Lancet. 1986;2: 274–276. [DOI] [PubMed] [Google Scholar]
- 3.McLoone P, Boddy FA. Deprivation and mortality in Scotland, 1981 and 1991. BMJ. 1994;309:1465–1470. [DOI] [PMC free article] [PubMed] [Google Scholar]
- 4.Regidor E, Gutierrez-Fisac JL, Rodriguez C. Increased socioeconomic differences in mortality in eight Spanish provinces. Soc Sci Med. 1995;41:801–807. [DOI] [PubMed] [Google Scholar]
- 5.Singh GK, Miller BA, Hankey BF, Feuer EJ, Pickle LW. Changing area socioeconomic patterns in U.S. cancer mortality, 1950–1998: part I–all cancers among men. J Natl Cancer Inst. 2002;94:904–915. [DOI] [PubMed] [Google Scholar]
- 6.Steenland K, Henley J, Thun M. All-cause and cause-specific death rates by educational status for two million people in two American Cancer Society cohorts, 1959–1996. Am J Epidemiol. 2002;156:11–21. [DOI] [PubMed] [Google Scholar]
- 7.Turrell G, Mathers C. Socioeconomic inequalities in all-cause and specific-cause mortality in Australia: 1985–1987 and 1995–1997. Int J Epidemiol. 2001; 30:231–239. [DOI] [PubMed] [Google Scholar]
- 8.Lang T, Ducimetiere P. Premature cardiovascular mortality in France: divergent evolution between social categories from 1970 to 1990. Int J Epidemiol. 1995; 24:331–339. [DOI] [PubMed] [Google Scholar]
- 9.Leclerc A, Chastang JF, Menvielle G, Luce D, EDISC group. Socioeconomic inequalities in premature mortality in France: did they widen in the last decades? Soc Sci Med. 2006;62:2035–2045. [DOI] [PubMed] [Google Scholar]
- 10.Kunst AE, Groenhof F, Mackenbach JP, Health EW. Occupational class and cause specific mortality in middle aged men in 11 European countries: comparison of population based studies. EU Working Group on Socioeconomic Inequalities in Health. BMJ. 1998;316: 1636–1642. [DOI] [PMC free article] [PubMed] [Google Scholar]
- 11.Mackenbach JP, Bos V, Andersen O, et al. Widening socioeconomic inequalities in mortality in six Western European countries. Int J Epidemiol. 2003;32:830–837. [DOI] [PubMed] [Google Scholar]
- 12.Singh GK, Miller BA, Hankey BF. Changing area socioeconomic patterns in U.S. cancer mortality, 1950–1998: part II–lung and colorectal cancers. J Natl Cancer Inst. 2002;94:916–925. [DOI] [PubMed] [Google Scholar]
- 13.Menvielle G, Luce D, Geoffroy-Perez B, Chastang JF, Leclerc A, EDISC group. Socioeconomic inequalities and cancer mortality in France. 1975–1990. Cancer Causes Control. 2005;16:501–513. [DOI] [PubMed] [Google Scholar]
- 14.Rouault D. The Echantillon Démograhique Permanent: a French equivalent to the Longitudinal Study. Update—News from the LS User Group. January 1994:5–13.
- 15.International Classification of Diseases, Injuries and Causes of Death, Ninth Revision. Geneva, Switzerland: World Health Organization; 1977.
- 16.Erikson R, Goldthorpe J. The Constant Flux. Oxford, England: Clarendon Press; 1992.
- 17.Mackenbach JP, Kunst AE. Measuring the magnitude of socio-economic inequalities in health: an overview of available measures illustrated with two examples from Europe. Soc Sci Med. 1997;44:757–771. [DOI] [PubMed] [Google Scholar]
- 18.Pamuk E. Social class inequality in mortality from 1921 to 1972 in England and Wales. Popul Stud. 1985; 39:17–31. [DOI] [PubMed] [Google Scholar]
- 19.Davey Smith G, Hart C, Hole D, et al. Education and occupational social class: which is the more important indicator of mortality risk? J Epidemiol Community Health. 1998;52:153–160. [DOI] [PMC free article] [PubMed] [Google Scholar]
- 20.Steenland K, Hu S, Walker J. All-cause and cause-specific mortality by socioeconomic status among employed persons in 27 US states, 1984–1997. Am J Public Health. 2004;94:1037–1042. [DOI] [PMC free article] [PubMed] [Google Scholar]
- 21.Michelozzi P, Perucci CA, Forastiere F, Fusco D, Ancona C, Dell’Orco V. Inequality in health: socioeconomic differentials in mortality in Rome, 1990–95. J Epidemiol Community Health. 1999;53:687–693. [DOI] [PMC free article] [PubMed] [Google Scholar]
- 22.Valkonen T, Martikainen P, Jalovaara M, Koskinen S, Martelin T, Makela P. Changes in socioeconomic inequalities in mortality during an economic boom and recession among middle-aged men and women in Finland. Eur J Public Health. 2000;10:274–280. [Google Scholar]
- 23.Besson D. Boissons alcoolisées: 40 ans de baisse de consommation [Decrease in alcohol consumption during the last 40 years]. INSEE Première. 2004;966.
- 24.Hill C, Laplanche A. Tabagisme et mortalité: aspects épidémiologiques [Smoking and mortality: epidemiological aspects]. Bulletin Hebdomadaire d’Epidémiologie. 2003;22–23:98–100. [Google Scholar]
- 25.Zeka A, Gore R, Kriebel D. Effects of alcohol and tobacco on aerodigestive cancer risks: a meta-regression analysis. Cancer Causes Control. 2003;14:897–906. [DOI] [PubMed] [Google Scholar]
- 26.Auvinen A, Karjalainen S. Possible explanations for social class differences in cancer patient survival. IARC Sci Publ. 1997;138:377–397. [PubMed] [Google Scholar]
- 27.Auvinen A, Karjalainen S, Pukkala E. Social class and cancer patient survival in Finland. Am J Epidemiol. 1995;142:1089–1102. [DOI] [PubMed] [Google Scholar]
- 28.Desoubeaux N, Herbert C, Launoy G, Maurel J, Gignoux M. Social environment and prognosis of colo-rectal cancer patients: a French population-based study. Int J Cancer. 1997;73:317–322. [DOI] [PubMed] [Google Scholar]
- 29.Kogevinas M, Marmot MG, Fox AJ, Goldblatt PO. Socioeconomic differences in cancer survival. J Epidemiol Community Health. 1991;45:216–219. [DOI] [PMC free article] [PubMed] [Google Scholar]
- 30.Madelaine J, Guizard AV, Lefevre H, Lecarpentier MM, Launoy G. Diagnostic, traitement et pronostic des cancers bronchiques dans le département de la Manche (1997–1999) en fonction du statut socio-économique du malade [Diagnosis, treatment, and prognosis of lung cancer in the Manche (France) (1997–1999) according to patients socioeconomic characteristics]. Rev Epidemiol Sante Publique. 2002;50:383–392. [PubMed] [Google Scholar]
- 31.Singh SM, Paszat LF, Li C, He J, Vinden C, Rabeneck L. Association of socioeconomic status and receipt of colorectal cancer investigations: a population-based retrospective cohort study. CMAJ. 2004;171:461–465. [DOI] [PMC free article] [PubMed] [Google Scholar]
- 32.Virtanen P, Liukkonen V, Vahtera J, Kivimaki M, Koskenvuo M. Health inequalities in the workforce: the labour market core-periphery structure. Int J Epidemiol. 2003;32:1015–1021. [DOI] [PubMed] [Google Scholar]
- 33.Kunst AE, Groenhof F, Borgan JK, et al. Socioeconomic inequalities in mortality. Methodological problems illustrated with three examples from Europe. Rev Epidemiol Sante Publique. 1998;46:467–479. [PubMed] [Google Scholar]
- 34.Percy C, Muir C. The international comparability of cancer mortality data. Results of an international death certificate study. Am J Epidemiol. 1989;129:934–946. [DOI] [PubMed] [Google Scholar]
- 35.Janssen F, Kunst AE. ICD coding changes and discontinuities in trends in cause-specific mortality in six European countries, 1950–99. Bull World Health Organ. 2004;82:904–913. [PMC free article] [PubMed] [Google Scholar]