

Abstract
Objectives. We sought to project future impacts of climate change on summer heat-related premature deaths in the New York City metropolitan region.
Methods. Current and future climates were simulated over the northeastern United States with a global-to-regional climate modeling system. Summer heat-related premature deaths in the 1990s and 2050s were estimated by using a range of scenarios and approaches to modeling acclimatization (e.g., increased use of air conditioning, gradual physiological adaptation).
Results. Projected regional increases in heat-related premature mortality by the 2050s ranged from 47% to 95%, with a mean 70% increase compared with the 1990s. Acclimatization effects reduced regional increases in summer heat-related premature mortality by about 25%. Local impacts varied considerably across the region, with urban counties showing greater numbers of deaths and smaller percentage increases than less-urbanized counties.
Conclusions. Although considerable uncertainty exists in climate forecasts and future health vulnerability, the range of projections we developed suggests that by midcentury, acclimatization may not completely mitigate the effects of climate change in the New York City metropolitan region, which would result in an overall net increase in heat-related premature mortality.
Although a large body of retrospective studies1–7 provides evidence of acute associations between daily temperatures and premature deaths from many causes, additional tools are needed to anticipate the future effects of climate change on ambient temperatures and associated mortality. Over the 20th century, the average annual temperature in the United States increased by 1°F.8 Temperatures in the 31-county metropolitan region centered around New York City have exceeded those national trends, with a 2°F warming trend between 1900 and 1997.9 Recent trends in anthropogenic emissions and their modeled impacts on global climate strongly suggest that both emissions and warming trends will continue to affect atmospheric processes into the 21st century.10 Annual average temperatures for the region in the 2050s have been projected to rise by 2.5°F to 6.5°F, with summer temperature increases of 2.7°F to 7.6°F.9
Cities such as New York may be at particular risk from climate change because the urban heat island further augments regional temperature increases.11 Urban heat islands are created when human-made surfaces in cities made of concrete, asphalt, metal, and stone absorb incident sunlight during the day, which is re-radiated as heat, especially at night. This, along with few trees and vegetation to provide cooling, produces an overall effect of urban areas tending to have higher surface and near-surface air temperatures than surrounding suburban and rural areas.12 Some communities in densely populated urban centers are among those most vulnerable to heat.5,13–15 The diverse urban population of New York includes millions of residents 65 years and older or residents with cardiovascular or respiratory illness, risk factors that increase vulnerability to summer heat stress.1
Several recent studies have used climate models to project future heat-related mortality impacts of global warming, usually at relatively coarse spatial scales. A global climate model applied in the United Kingdom projected a 250% increase in annual heat-related deaths by the 2050s across 4 greenhouse gas scenarios.16 With a high-emission-change scenario in 6 temperate Australian cities, a 75% increase in annual heat-related mortality among people 65 years and older by 2050 was projected.17 A study in Portugal projected that summer heat-related deaths in Lisbon may increase by up to 6 times by the 2050s.18 A regional impacts study of California concluded that by the latter decades of the 21st century, summer heat-related mortality could be 2 to 7 times greater than it is now, even after taking possible heat acclimatization (e.g., increased use of air conditioning, gradual physiological adaptation) into account.19
General circulation models are global scale models that take into account the dynamics of physical processes in the atmosphere and oceans but at relatively coarse resolution. Hence, one cannot realistically use these models to address the need for locally relevant projections of the potential effects of global warming on public health. One approach to address this limitation is dynamical downscaling, in which the general circulation model outputs are used as initial and boundary conditions for finer-scale simulations by regional climate models. We used such a system, developed by the New York Climate and Health Project,20 to project daily mean temperatures at local scales for the 2050s and to evaluate potential impacts of climate change on summer heat-related mortality in the New York City metropolitan region.
METHODS
Climate Modeling
Meteorological fields were simulated on a 36-km grid over the study region for the 1990s and 2050s by coupling the Fifth-Generation National Center for Atmospheric Research/Penn State Mesoscale Model (MM5)21 to the Goddard Institute for Space Studies (GISS) 4° × 5° resolution Global Atmosphere–Ocean Model (which produced the GISS–MM5 linked model system).22–24 To evaluate the GISS–MM5 model system, 108-km and 36-km grid resolution model outputs for the eastern United States in 5 summers of the 1990s were compared with 0.5° × 0.5° gridded observations for the same period. The model successfully captured the spatial patterns of observed summer temperatures.25
The Intergovernmental Panel on Climate Change has defined a range of possible future trends in greenhouse gas emissions that are based on alternative assumptions about changes in the economy, technology, demographics, and energy use.26 We selected 2 of the Intergovernmental Panel on Climate Change greenhouse gas scenarios, A2 and B2, which represent relatively high and low greenhouse gas growth projections, respectively. The A2 scenario assumes rapid human population growth, relatively weak environmental concerns, and a lack of aggressive greenhouse gas regulation, whereas the B2 scenario assumes more-moderate population growth and increased concerns about environmental sustainability. The A2 and B2 scenarios thus offer a range of possible future climate-related futures, and we used both to model daily climate in the 1990s and 2050s. The GISS–MM5 regional climate simulations were performed for 3-month “time-slices” for the summer months of June, July, and August within 5 consecutive mid-decade years (i.e., 1993–1997) of the 1990s and 2050s. The decision to model only 5 summers in each decade was based largely on computational constraints.
Mortality Risk Assessment
Projected summer mortality impacts were estimated by using modeled mean temperatures for each of the 31 counties of the study area. Although several health outcomes have been associated with heat exposures,27–31 mortality is the most severe potential outcome of climate change–related heat stress and figures most prominently in cost–benefit analyses.32 Daily mortality impacts within each county were computed as
 |
(1) |
where H is daily heat-related deaths, P is the county population, M is the baseline county summer daily nonaccidental mortality rate (per 100 000 population), and ERC is the exposure–risk coefficient of mortality for a given change in same-day mean temperature exposure, as follows:
 |
(2) |
where b is the parameter estimate that reflects a 13.05% change in nonaccidental causes of mortality per 10°F change in daily mean temperature above a local threshold temperature of 73.54°F (F. Curriero, Johns Hopkins Bloomberg School of Public Health, written communication, January 2003) for New York City, derived from a study of 11 eastern United States cities for the period 1973 through 1994,4 and ΔTave is the difference between daily mean temperature (Tave ) exposure and the threshold temperature for days with Tave above the threshold value.
For the 1990s and 2050s in each county, we projected daily heat-related premature deaths on 460 simulation days that represented 5 middecadal (years 3 through 7 of each decade) “summers” (June 1 through August 31; 92 days/summer × 5 summers). Four different risk estimates were computed, which corresponded to the A2 and B2 scenarios for the 2050s and 2 alternative approaches to simulate possible effects of future heat acclimatization. One approach assumed there will be no acclimatization and, thus, that the regional population response to heat stress over the coming century will be the same as that previously derived for the 1973–1994 New York City population.3,4 The second approach assumed that the regional population will partially “acclimatize” to warming temperatures through such measures as increased use of air conditioning, heat alerts, and cooling shelters, as well as by gradual physiological adaptation. We modeled this acclimatization by using a heat exposure–mortality response function4 derived from 2 US cities with current observed temperatures similar to those projected for the 2050s in the New York region (2050s A2 summer daily Tave = 76.7°F). Two cities had observed 1973–1994 mean summer temperatures3 within approximately 1°F of the projected 2050s temperatures for the study region: Washington, DC (mean 1973–1994 summer daily Tave = 75.7°F), and Atlanta, Ga (mean 1973–1994 summer daily Tave = 77.8°F). We calculated the mean value for the exposure–response function and temperature threshold from these 2 cities4 and applied the results in the heat–mortality risk assessment.
Population totals for each of the 31 counties in the New York City metropolitan region, based on data obtained from the US Census 2000 survey,33 were held constant throughout the modeling period. Baseline (1990s) mortality rates for all ages and for International Classification of Diseases, Ninth Revision (ICD-9), codes from 0 to 799.9,34 which excluded deaths attributable to external causes, were computed as described in a separate paper,35 applying county-specific scaling factors to arrive at summer seasonal daily mortality rates, and were held constant over the analysis period.
Temperature Exposure Estimation
The characterization of daily mean temperatures (Tave in °F) in the study area involved the combination of observed data from the 1990s with GISS–MM5 simulated conditions for the 1990s and 2050s. Weather station observations from June 1 to August 31 in each of 5 baseline years (1993–1997) were obtained from the National Climatic Data Center36 for 16 meteorological monitoring sites that reported daily data. Model simulations of summer daily Tave in the 1990s and 2050s were produced from the coupled GISS–MM5 model at a 36-km grid resolution, as described previously. Observed and modeled temperatures were interpolated to each county’s geographic centroid, based on inverse distance-weighted interpolation of values from the centers of 3 nearest stations or grid cells.
Temperature exposures in future decades were estimated by adjusting 1990s observed temperatures with interdecadal differences derived from the GISS–MM5 model, an approach that assumes that model bias does not vary from one decade to the next. We first calculated monthly differences between future simulated temperatures in each decade and 1990s simulated temperatures. For example, the mean simulated temperature for the 5 Julys of the 1990s in a particular county was computed. This value was then subtracted from the mean simulated county temperature for the 5 Julys of the 2050s. This was done for each summer month of the decade, which produced decade-specific monthly differences in temperatures that resulted from climate change. Note that in the climate impacts field these differences are referred to as “anomalies.”
A more intuitive term, climate-induced difference, can be applied, where climate-induced difference is the month-, decade-, and county-specific difference calculated by subtracting the 1990s mean model-simulated temperature from the corresponding values for simulated future decades. To estimate temperature exposures in future decades, the month- and decade-specific climate-induced differences were added to the daily 1990s observations for each county.
RESULTS
At the county level, increases in summer heat-related premature mortality were projected across the entire study area by mid-century under the A2 and B2 climate change scenarios with and without acclimatization as described in Table 1 ▶. The last column in Table 1 ▶ shows the mean percentage change among all 4 variants: A2 and B2, and nonacclimatized and acclimatized projections for each county. Projected 2050s changes in heat-related mortality range from a 38% to a 208% increase, with a mean 70% increase compared with the 1990s. Table 2 ▶ summarizes the regional changes in mean regional summer daily Tave and mortality for the A2 and B2 scenarios, relative to the 1990s. The B2 scenario projected a regional increase of 2.9°F in a typical 2050s summer, whereas A2 temperature increases were larger (3.8°F).
TABLE 1—
Projected Summer County-Level Mean Daily Temperatures (°F) and Associated Heat-Related Premature Mortality in the 1990s Versus the 2050s Under a Changing Climate: New York City Metropolitan Region
| 1990s | 2050s A2 a | 2050s B2b | ||||||||||
| County | State | Population, Census 200033 | Mortalityc | Taved | Heat- Related Premature Deathse | Tave | Heat- Related Premature Deaths (Percentage Change)f | With Acclimatization,g Heat-Related Premature Deaths (Percentage Change) | Tave | Heat- Related Premature Deaths (Percentage Change) | With Acclimatization, Heat-Related Premature Deaths (Percentage Change) | Mean Percentage Increase in Heat-Related Premature Mortalityh |
| Fairfield | Conn | 882 567 | 2.03 | 72.0 | 30 | 75.8 | 72 (137) | 63 (110) | 74.7 | 58 (91) | 51 (67) | 101 |
| Litchfield | Conn | 182 193 | 1.99 | 68.1 | 2 | 72.0 | 6 (295) | 5 (166) | 71.0 | 5 (201) | 4 (170) | 208 |
| New Haven | Conn | 824 008 | 2.27 | 72.0 | 34 | 75.7 | 75 (122) | 65 (91) | 75.7 | 76 (124) | 66 (95) | 108 |
| Bergen | NJ | 884 118 | 2.16 | 76.7 | 99 | 80.7 | 173 (75) | 147 (49) | 79.7 | 154 (55) | 131 (33) | 53 |
| Essex | NJ | 793 633 | 2.44 | 76.7 | 100 | 80.6 | 174 (74) | 148 (48) | 79.7 | 157 (57) | 134 (34) | 53 |
| Hudson | NJ | 608 975 | 2.25 | 76.2 | 63 | 79.9 | 112 (77) | 95 (51) | 79.3 | 103 (64) | 88 (40) | 58 |
| Hunterdon | NJ | 121 989 | 1.45 | 71.4 | 3 | 75.5 | 7 (151) | 6 (108) | 74.4 | 6 (104) | 5 (78) | 110 |
| Mercer | NJ | 350 761 | 2.12 | 72.6 | 17 | 76.6 | 37 (124) | 32 (90) | 75.5 | 31 (86) | 27 (61) | 90 |
| Middlesex | NJ | 750 162 | 1.89 | 73.0 | 33 | 76.7 | 71 (114) | 62 (87) | 74.9 | 51 (55) | 45 (35) | 73 |
| Monmouth | NJ | 615 301 | 2.14 | 74.2 | 41 | 77.6 | 77 (88) | 66 (62) | 77.6 | 78 (89) | 67 (63) | 75 |
| Morris | NJ | 470 212 | 1.75 | 73.1 | 19 | 77.0 | 42 (126) | 37 (93) | 76.4 | 39 (107) | 33 (79) | 101 |
| Ocean | NJ | 510 916 | 3.31 | 72.0 | 33 | 75.7 | 74 (122) | 64 (94) | 75.3 | 69 (109) | 60 (81) | 101 |
| Passaic | NJ | 489 049 | 2.16 | 74.3 | 33 | 78.2 | 67 (104) | 57 (73) | 77.4 | 60 (83) | 51 (57) | 79 |
| Somerset | NJ | 297 490 | 1.63 | 73.4 | 13 | 77.4 | 27 (118) | 24 (82) | 75.5 | 20 (56) | 17 (35) | 73 |
| Sussex | NJ | 144 166 | 1.61 | 71.1 | 3 | 75.1 | 8 (185) | 7 (134) | 74.5 | 7 (160) | 6 (128) | 152 |
| Union | NJ | 522 541 | 2.29 | 76.7 | 62 | 80.6 | 107 (73) | 91 (47) | 79.2 | 90 (45) | 77 (24) | 47 |
| Warren | NJ | 102 437 | 2.13 | 70.6 | 2 | 74.7 | 7 (187) | 6 (211) | 74.0 | 6 (153) | 6 (122) | 168 |
| Bronx | NY | 1 332 650 | 2.37 | 75.6 | 128 | 79.4 | 241 (89) | 206 (61) | 78.5 | 212 (67) | 182 (43) | 65 |
| Dutchess | NY | 280 150 | 1.96 | 69.3 | 4 | 73.3 | 13 (242) | 11 (184) | 72.6 | 11 (198) | 10 (164) | 197 |
| Kings | NY | 2 465 326 | 2.22 | 75.1 | 200 | 78.7 | 371 (86) | 319 (59) | 77.9 | 330 (65) | 284 (42) | 63 |
| Nassau | NY | 1 334 544 | 2.11 | 71.7 | 54 | 75.4 | 115 (114) | 100 (85) | 74.7 | 101 (89) | 88 (64) | 88 |
| New York | NY | 1 537 195 | 2.25 | 75.7 | 146 | 79.5 | 268 (83) | 229 (57) | 78.6 | 238 (63) | 204 (39) | 61 |
| Orange | NY | 341 367 | 1.86 | 70.8 | 7 | 74.8 | 20 (204) | 17 (150) | 74.1 | 17 (162) | 15 (131) | 161 |
| Putnam | NY | 95 745 | 1.50 | 70.6 | 2 | 74.6 | 4 (195) | 4 (96) | 72.9 | 3 (101) | 3 (178) | 118 |
| Queens | NY | 2 229 379 | 2.18 | 74.8 | 164 | 78.5 | 320 (95) | 275 (68) | 77.8 | 289 (76) | 249 (52) | 72 |
| Richmond | NY | 443 728 | 2.09 | 76.7 | 48 | 80.2 | 79 (65) | 67 (40) | 78.6 | 64 (33) | 55 (14) | 38 |
| Rockland | NY | 286 753 | 1.72 | 70.8 | 6 | 74.8 | 17 (174) | 15 (144) | 73.7 | 14 (121) | 12 (94) | 133 |
| Suffolk | NY | 1 419 369 | 1.96 | 71.4 | 44 | 74.8 | 95 (115) | 83 (89) | 72.8 | 64 (43) | 56 (25) | 68 |
| Sullivan | NY | 73 966 | 2.58 | 70.8 | 2 | 74.8 | 6 (202) | 5 (164) | 74.0 | 5 (160) | 5 (129) | 164 |
| Ulster | NY | 177 749 | 2.21 | 70.4 | 4 | 74.4 | 11 (211) | 10 (150) | 73.6 | 10 (163) | 8 (132) | 164 |
| Westchester | NY | 923 459 | 2.09 | 70.8 | 24 | 74.8 | 66 (174) | 57 (139) | 73.9 | 55 (128) | 48 (101) | 136 |
aA2 scenario assumed rapid human population growth, relatively weak environmental concerns, and a lack of aggressive greenhouse gas regulations.
bB2 scenario assumed more-moderate population growth and increased concerns about environmental sustainability, with more aggressive greenhouse gas regulations, compared with A2.
c1990s (1990–1999) reference period summer daily mortality rate from nonaccidental causes of death, per 100 000 population.
dMean daily temperature in °F for typical decadal summer (June, July, August), from observations for 1990s and from our climate model simulations for 2050s.
eCentral effect estimate for heat-related premature mortality in a typical decadal summer season per county.
fPercentage change in central estimate of heat-related mortality in a typical decadal summer, relative to the 1990s.
gApplies mean heat mortality threshold temperature and percentage change in mortality per 10°F from Washington, DC, and Atlanta, Ga.
hMean of percentage increase values from 4 preceding scenario and assumption combinations.
TABLE 2—
Projected Summer Regional Mean Daily Temperatures (°F) and Associated Heat-Related Premature Mortality, Aggregated Across the New York City Metropolitan Region, in the 1990s Versus the 2050s
| Year, Scenario, Assumptions | Mean Summer Daily Temperature (SD)a | Total Regional Heat-Related Premature Deaths |
| 1990s | 72.9 (5.68) | 1418 |
| 2050s A2b | 76.7 (5.51) | 2764 |
| 2050s A2 with acclimatization | 76.7 (5.51) | 2376 |
| 2050s B2c | 75.8 (5.67) | 2421 |
| 2050s B2 with acclimatization | 75.8 (5.67) | 2087 |
aMean county-specific decadal summer daily temperature in °F (mean SD). Note that the same summer daily temperature simulations were applied in mortality risk assessments with and without acclimatization assumptions.
bA2 scenario assumed rapid human population growth, relatively weak environmental concerns, and a lack of aggressive greenhouse gas regulations.
cB2 scenario assumed more-moderate population growth and increased concerns about environmental sustainability, with more aggressive greenhouse gas regulations, compared with A2.
Figure 1 ▶ graphically summarizes the regionally aggregated percentage changes in summer heat mortality across the 4 risk assessment variants listed in Table 2 ▶. Without acclimatization, regional heat-related mortality was projected to approximately double (95% increase) under the A2 scenario, from 1418 in the 1990s to 2376 in the 2050s. When acclimatization was included, a more modest increase (68%) was projected. Similar results under the B2 scenario (71% increase under nonacclimatized B2; 47% increase under acclimatized B2) suggested that the regional effect of acclimatization could be to reduce relative increases in summer heat-related premature mortality by about 25%.
FIGURE 1—
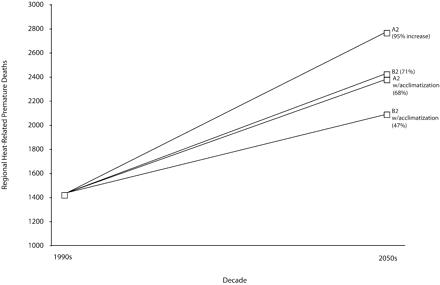
A comparison of regional estimated 1990s summer heat-related deaths versus mortality projected for each future decade, including both A2 and B2 scenarios for 2050s, and both acclimatized and nonacclimatized approaches: New York City metropolitan region.
Note. A2 scenario assumed rapid human population growth, relatively weak environmental concerns, and a lack of aggressive greenhouse gas regulations. B2 scenario assumed more-moderate population growth and increased concerns about environmental sustainability, with more aggressive greenhouse gas regulations, compared with A2.
Local impacts varied geographically across the region, as shown in Figure 2 ▶. Although current and projected future mean daily summer temperatures were found to be highest in and around the urban core counties (Table 1 ▶), higher percentage increases in heat-related mortality were seen in nonurban counties. In some relatively rural counties, such as Dutchess and Ulster in New York, among the coolest regionally in the 1990s, projected warming by midcentury suggested relatively large percentage increases in heat-related mortality impacts by midcentury. By contrast, the urban counties of New York City started with relatively warm summers in the 1990s and had relatively smaller percentage increases in projected mortality.
FIGURE 2—
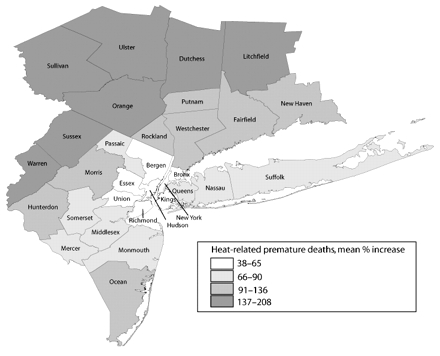
Map showing spatial variations in county-specific mean increases in heat-related premature mortality from the 1990s to the 2050s: New York City metropolitan region.
DISCUSSION
By using a global-to-regional climate modeling system, we found that the impacts of projected rising temperatures on local heat-related mortality may increase in both urban and nonurban counties surrounding New York City over the 21st century. The 36-km resolution GISS–MM5 model system provided a means to discern local patterns of potential climate impacts in future decades. This capability is especially important in a metropolitan region such as New York, where strong spatial gradients in population, demographics, and land use lead to corresponding gradients in temperature (i.e., the urban heat island), which puts specific populations within the city at greater risk than others. As our work illustrates, those counties currently experiencing the hottest summers are the highly urbanized counties in and around New York City, which also have the greatest population density, thus exposing millions of residents to periodic summer heat stress, which results in relatively high numbers of heat-related premature deaths.
The relatively large percentage of households who live in poverty or in older residential neighborhoods in New York City where multifamily rental buildings often do not have air conditioning may enhance urban population vulnerability to heat stress. Although temperatures are projected to warm considerably in the urban core by the 2050s, our global-to-regional model results suggest that the greatest incremental increases in mean daily temperatures will occur in the nonurban counties well beyond the city limits of the 5 boroughs of New York City. Figure 2 ▶ shows that counties now considered largely rural to the north, west, and southwest of the city could experience slightly greater incremental increases in mean daily temperatures by the 2050s and larger proportional increases in heat-related mortality. This analysis ignores the potential synergistic effects of a growing urban heat island because of suburban sprawl, but it also assumes that vulnerability is identical for suburban and urban residents, both of which are likely incorrect. However, it does suggest that heat stress may be more than an “urban issue” as the century advances. Information is sparse on the prevalence of residential air conditioner use in specific nonurban counties. Therefore, it is challenging to gauge the degree to which urban versus nonurban households may benefit from different levels of access to this important adaptive mechanism.
Overall, the results of this study are consistent with those of previous studies that have applied climate model projections in mortality assessments. A doubling in summer heat-related premature mortality relative to current levels falls within the range of values for the 2050s suggested for other cities in the United States19,37 and Europe.18 This is notable because these different studies applied regional climate models and general circulation models in different regions of the world and for different human populations. This convergence of results lends credence to projected heat-related impacts of climate change.
Future acclimatization to rising temperatures and resulting heat stress is likely to reduce the heat mortality impacts.38,39 Although there is currently no consensus on how to model this effect, we examined the issue by using an approach37 that involved deriving a heat–mortality response function for use in future mortality projections from 2 present-day cities that had temperatures similar to those projected for the city of interest in the future. The acclimatized assumptions for the 2050s yielded mortality increases about 25% smaller relative to the nonacclimatized results for each scenario, similar to the 20% to 25% acclimatization effects from another recent US study.19 However, the potential impacts of acclimatization remain highly uncertain and are likely to vary substantially in different regions and for different population subgroups.
We assumed that population remained constant at 1990s levels in our projections of future health impacts. Any increase in total population density or in the proportion of vulnerable subpopulations would tend to increase the absolute number of heat-related deaths projected for the future. With the aging of the baby boomers (those born in the decade after World War II, 1945–1955), the proportion of the US population aged 65 years and older is expected to increase until 2020.40 People aged 65 years and older have been found in many different settings to be among those most vulnerable to heat stress.1,13,15,41,42 Thus, it can be argued that the population-constant method provides a conservative projection of possible future climate-related changes in temperature-related mortality.
Because of computational resource constraints, only summer months were simulated by GISS–MM5 in the main mortality risk assessment and possible early season (i.e., April–May) mortality impacts from extreme heat were not included. It has been suggested that early season heat can have a greater effect on acute mortality43 than in midsummer, and additional GISS–MM5 simulations of daily meteorology in the spring months would be an area for fruitful future research. Further, the current study did not specifically account for possible enhanced mortality because of longer-duration heat events. Several previous studies have found that the longer a heat wave lasts, the bigger its effect on local mortality,44–46 which suggests that the mortality projections here may represent conservative estimates of potential impacts.
The linked global-to-regional model system and subsequent mortality analysis synthesize climate models, epidemiology, and risk assessment to advance current understanding of what the range of public health impacts could be among residents of a major metropolitan population subjected to 21st century climate. Regional regulatory schemes for greenhouse gas emission control are beginning to take shape, including the Regional Greenhouse Gas Initiative47 among 10 northeastern US states. In the future, integrated climate-health modeling systems could help reveal the geography of local vulnerabilities to climate change, which have been associated with poverty, social isolation, and lack of access to medical care. Health impact assessment tools such as those described here may eventually help local planners develop climate impact adaptations that are more efficient and inform the greenhouse gas regulatory process now emerging in the United States and elsewhere.
Acknowledgments
The research described in this article has been funded by the US Environmental Protection Agency (EPA) Science to Achieve Results (STAR; grant R-82873301).
Note. The findings presented here do not necessarily reflect the views of EPA and no official endorsement should be inferred.
Human Participant Protection No human participants were involved.
Peer Reviewed
Contributors K. Knowlton led the writing. B. Lynn and R.A. Goldberg completed the climate modeling. C. Rosenzweig supervised the climate modeling. C. Hogrefe provided substantive assistance with the study and analysis. J. Klein Rosenthal assisted with the study and analysis. P.L. Kinney originated and supervised the overall study. All of the authors helped to refine the analysis, interpret the findings, and revise the article.
References
- 1.Basu R, Samet JM. Relation between elevated ambient temperature and mortality: a review of the epidemiologic evidence. Epidemiol Rev. 2002;24:190–202. [DOI] [PubMed] [Google Scholar]
- 2.Braga AL, Zanobetti A, Schwartz J. The effect of weather on respiratory and cardiovascular deaths in 12 U.S. cities. Environ Health Perspect. 2002;110:859–863. [DOI] [PMC free article] [PubMed] [Google Scholar]
- 3.Curriero FC, Heiner KS, Samet JM, Zeger SL, Strug L, Patz JA. Temperature and mortality in 11 cities of the eastern United States. Am J Epidemiol. 2002; 155:80–87. [DOI] [PubMed] [Google Scholar]
- 4.Curriero FC, Samet JM, Zeger SL. Re: “On the use of generalized additive models in time-series studies of air pollution and health” and “Temperature and mortality in 11 cities of the eastern United States.” Am J Epidemiol. 2003;158:93–94. [DOI] [PubMed] [Google Scholar]
- 5.O’Neill MS, Zanobetti A, Schwartz J. Modifiers of the temperature and mortality association in seven US cities. Am J Epidemiol. 2003;157:1074–1082. [DOI] [PubMed] [Google Scholar]
- 6.Whitman S, Good G, Donoghue ER, Benbow N, Shou W, Mou S. Mortality in Chicago attributed to the July 1995 heat wave. Am J Public Health. 1997;87:1515–1518. [DOI] [PMC free article] [PubMed] [Google Scholar]
- 7.McMichael AJ, Campbell-Lendrum DH, Corvalan CF, et al., eds. Climate Change and Human Health: Risks and Responses. Geneva, Switzerland: World Health Organization/World Meteorological Organization/ United Nations Environment Programme; 2003.
- 8.National Assessment Synthesis Team. Climate Change Impacts on the United States: The Potential Consequences of Climate Variability and Change. Cambridge, England: Cambridge University Press; 2000.
- 9.Rosenzweig C, Solecki WD, eds. Climate Change and a Global City: The Potential Consequences of Climate Variability and Change, Metro East Coast. New York, NY: Columbia Earth Institute; 2001.
- 10.Solomon S, Qin D, Manning M, et al. Technical summary. In: Climate Change 2007: The Physical Science Basis. Contribution of Working Group I to the Fourth Assessment Report of the Intergovernmental Panel on Climate Change. Cambridge, England: Cambridge University Press; 2007.
- 11.Solecki WD, Rosenzweig C, Parshall L, et al. Mitigation of the heat island effect in urban New Jersey. Global Environ Change Part B: Environ Hazards. 2005; 6:39–49. [Google Scholar]
- 12.Rosenthal JK, Sclar ED, Kinney PL, et al. Links between the built environment, climate and population health: interdisciplinary environmental change research in New York City. Ann Acad Med Singap, In press. [PubMed]
- 13.Centers for Disease Control and Prevention. Heat-related deaths—four states, July–August 2001, and United States, 1979–1999. MMWR Morb Mortal Wkly Rep. 2002;51:567–570. [PubMed] [Google Scholar]
- 14.O’Neill MS, Zanobetti A, Schwartz J. Disparities by race in heat-related mortality in four US cities: the role of air conditioning prevalence. J Urban Health. 2005; 82:191–197. [DOI] [PMC free article] [PubMed] [Google Scholar]
- 15.Semenza JC, Rubin CH, Falter KH, et al. Heat-related deaths during the July 1995 heat wave in Chicago. N Engl J Med. 1996;335:84–90. [DOI] [PubMed] [Google Scholar]
- 16.Donaldson G, Kovats RS, Keatinge WR, McMichael AJ. Heat- and cold-related mortality and morbidity and climate change. In: Expert Group on Climate Change and Health in the UK, eds. Health Effects of Climate Change in the UK. London, England: UK Department of Health; 2001:70–80. Available at: http://www.dh.gov.uk/assetRoot/04/10/80/61/04108061.pdf. Accessed September 12, 2006.
- 17.McMichael AJ, Woodruff RE, Whetton P, et al., eds. Human Health and Climate Change in Oceania: A Risk Assessment 2002. Canberra: Commonwealth of Australia; 2003.
- 18.Dessai S. Heat stress and mortality in Lisbon Part II. An assessment of the potential impacts of climate change. Int J Biometeorol. 2003;48:37–44. [DOI] [PubMed] [Google Scholar]
- 19.Hayhoe K, Cayan D, Field CB, et al. Emissions pathways, climate change, and impacts on California. Proc Natl Acad Sci U S A. 2004;101:12422–12427. [DOI] [PMC free article] [PubMed] [Google Scholar]
- 20.Kinney PL, Rosenthal JE, Rosenzweig C, et al. Assessing potential public health impacts of changing climate and land uses: the New York Climate and Health Project. In: Ruth M, Donaghy K, Kirshen P, eds. Regional Climate Change and Variability: Impacts and Responses. Cheltenham, England, and Northampton, Mass: Edward Elgar; 2006:161–189.
- 21.Grell GA, Dudhia J, Stauffer D. A Description of the Fifth-Generation Penn State/NCAR Mesoscale Model (MM5). NCAR technical note TN-398+STR. Boulder, Colo: National Center for Atmospheric Research; 1994.
- 22.Russell GL, Miller JR, Rind D. A coupled atmosphere-ocean model for transient climate change studies. Atmosphere Ocean. 1995;33:683–730. [Google Scholar]
- 23.Lynn BH, Healy R, Druyan LM. An analysis of the potential for extreme temperature change based on observations and model simulations. J Climate. 2007; 20:1539–1554. [Google Scholar]
- 24.Lynn BH, Druyan L, Hogrefe C, et al. Sensitivity of present and future surface temperatures to precipitation characteristics. Clim Res. 2004;28:53–65. [Google Scholar]
- 25.Hogrefe C, Biswas J, Lynn B, et al. Simulating regional-scale ozone climatology over the eastern United States: model evaluation results. Atmos Environ. 2004;38:2627–2638. [Google Scholar]
- 26.Nakicenovic N, Swart R, eds. Emissions Scenarios: A Special Report of Working Group III of the Intergovernmental Panel on Climate Change. Cambridge, England: Cambridge University Press; 2000.
- 27.Rusticucci M, Bettolli ML, Harris de los Angeles M. Association between weather conditions and the number of patients at the emergency room in an Argentine hospital. Int J Biometeorol. 2002;46:42–51. [DOI] [PubMed] [Google Scholar]
- 28.Semenza JC, McCullough JE, Flanders WD, McGeehin MA, Lumpkin JR. Excess hospital admissions during the July 1995 heat wave in Chicago. Am J Prev Med. 1999;16:269–277. [DOI] [PubMed] [Google Scholar]
- 29.Jones TS, Liang AP, Kilbourne EM, et al. Morbidity and mortality associated with the July 1980 heat wave in St Louis and Kansas City, Mo. JAMA. 1982; 247:3327–3331. [PubMed] [Google Scholar]
- 30.Koken PJ, Piver WT, Ye F, Elixhauser A, Olsen LM, Portier CJ. Temperature, air pollution, and hospitalization for cardiovascular diseases among elderly people in Denver. Environ Health Perspect. 2003;111:1312–1317. [DOI] [PMC free article] [PubMed] [Google Scholar]
- 31.Kilbourne EM. The spectrum of illness during heat waves. Am J Prev Med. 1999;16:359–360. [DOI] [PubMed] [Google Scholar]
- 32.The Benefits and Costs of the Clean Air Act, 1970 to 1990. Washington, DC: US Environmental Protection Agency; 1997.
- 33.US Census Bureau. Census 2000 Summary File 1 (SF 1) 100-Percent Data, Detailed Tables. Available at: http://factfinder.census.gov/home/saff/main.html. Accessed September 12, 2006.
- 34.International Classification of Diseases, Ninth Revision. Geneva, Switzerland: World Health Organization; 1980.
- 35.Knowlton K, Rosenthal JE, Hogrefe C, et al. Assessing ozone-related health impacts under a changing climate. Environ Health Perspect. 2004;112:1557–1563. [DOI] [PMC free article] [PubMed] [Google Scholar]
- 36.National Climatic Data Center, National Oceanic and Atmospheric Administration. Climate data online. Available at: http://www.ncdc.noaa.gov/oa/climate/stationlocator.html. Accessed September 12, 2005.
- 37.Kalkstein LS, Greene JS. An evaluation of climate/ mortality relationships in large US cities and the possible impacts of a climate change. Environ Health Perspect. 1997;105:84–93. [DOI] [PMC free article] [PubMed] [Google Scholar]
- 38.Davis RE, Knappenberger PC, Michaels PJ, Novicoff WM. Changing heat-related mortality in the United States. Environ Health Perspect. 2003;111:1712–1718. [DOI] [PMC free article] [PubMed] [Google Scholar]
- 39.Davis RE, Knappenberger PC, Novicoff WM, Michaels PJ. Decadal changes in heat-related human mortality in the eastern United States. Clim Res. 2002; 22:175–184. [Google Scholar]
- 40.US Census Bureau. Projected Population Change in the United States, by Age and Sex: 2000 to 2050. Available at: http://www.census.gov/ipc/www/usinterimproj/natprojtab02b.xls. Accessed September 12, 2006.
- 41.Basu R, Samet JM. An exposure assessment study of ambient heat exposure in an elderly population in Baltimore, Maryland. Environ Health Perspect. 2002; 110:1219–1224. [DOI] [PMC free article] [PubMed] [Google Scholar]
- 42.Klinenberg E. Heat Wave: A Social Autopsy of Disaster in Chicago. Chicago, Ill: University of Chicago Press; 2002.
- 43.Hajat S, Kovats RS, Atkinson RW, Haines A. Impact of hot temperatures on death in London: a time series approach. J Epidemiol Community Health. 2002; 56:367–372. [DOI] [PMC free article] [PubMed] [Google Scholar]
- 44.Nakai S, Itoh T, Morimoto T. Deaths from heat-stroke in Japan: 1968–1994. Int J Biometeorol. 1999; 43:124–127. [DOI] [PubMed] [Google Scholar]
- 45.Díaz J, Jordan A, Garcia R, et al. Heat waves in Madrid 1986–1997: effects on the health of the elderly. Int Arch Occup Environ Health. 2002;75:163–170. [DOI] [PubMed] [Google Scholar]
- 46.Díaz J, Garcia R, Velazquez de Castro F, Hernandez E, Lopez C, Otero A. Effects of extremely hot days on people older than 65 years in Seville (Spain) from 1986 to 1997. Int J Biometeorol. 2002;46:145–149. [DOI] [PubMed] [Google Scholar]
- 47.Regional Greenhouse Gas Initiative. An Initiative of the Northeast and Mid-Atlantic States of the U.S. Available at: http://www.rggi.org/about.htm. Accessed September 5, 2006.