

Abstract
Objectives. We assessed the implications for motorcyclist safety of recent repeals of universal helmet laws in 6 US states.
Methods. We examined cross-sectional time-series data from the 50 states and the District of Columbia for the period 1975 through 2004.
Results. On average, when compared to state experience with no helmet mandate, universal helmet laws were associated with an 11.1% reduction in motorcyclist fatality rates, whereas rates in states with partial coverage statutes were not statistically different from those with no helmet law. Furthermore, in the states in which recent repeals of universal coverage have been instituted, the motorcyclist fatality rate increased by an average of 12.2% over what would have been expected had universal coverage been maintained. Since 1997, an additional 615 motorcyclist fatalities have occurred in these states as a result of these changes in motorcycle helmet laws.
Conclusions. Motorcyclist safety has been compromised in the states that have repealed universal coverage and is likely to be compromised in other states that abandon these statutes.
Since 1975, when the National Highway Traffic Safety Administration (NHTSA) began compiling traffic fatality censuses, more than 100000 motorcycle riders in the United States have died in crashes. In 2004 alone, about 4000 motorcyclist fatalities were recorded, accounting for 8.6% of all traffic-related deaths.1 Estimates for 2005 indicate that such fatalities increased for an 8th straight year, with more than 4300 deaths accounting for approximately 10% of all motor vehicle crash fatalities.2
Head injuries are a major cause of fatalities sustained in motorcycle crashes.3 An examination of death certificate data on motor-cyclist fatalities that occurred between 1979 and 1986 revealed a head-injury diagnosis in 53% of these fatalities.4 Of these head injury–associated deaths, head injury was the sole medical condition listed in 34%.5 Among fatalities with more than 1 medical diagnosis, head injury was listed as the primary cause of death in 83% and as 1 of the top 2 causes of death in 95%.5
Motorcycle helmets are effective in reducing the probability of severe head and neck injuries, thereby reducing the likelihood of death in the event of a crash.6–13 For instance, results of a study conducted in Washington State showed that crash victims not wearing helmets were 3 times as likely as helmeted riders to sustain head injuries and 4 times as likely to incur severe head injuries,14 and a Colorado study revealed that individuals not wearing helmets were 2.4 times more likely as those wearing helmets to suffer a head injury in a crash.9 According to NHTSA estimates, motorcycle helmets are 37% effective, meaning that for every 100 motorcyclists who die in a crash while not wearing a helmet, 37 would have survived if they had been wearing a helmet.15 Despite the evidence on helmet safety effects, observational research has shown that helmet use rates declined from 71% in 2000 to 58% in 2004.15
The sharp contrast between increasing crash fatalities and decreasing helmet use, combined with the demonstrated safety effects of helmets, has led many to push for laws requiring helmet use. In the United States, however, such laws have been controversial as a result of concerns over infringement of personal rights.16,17 Although research shows that universal helmet laws increase helmet use,15,18,19 varying views on the balance between safety and personal rights have led to considerable policy changes over time.20
For instance, the 1966 Highway Safety Act (80 Stat 731) authorized the US secretary of transportation to withhold up to 10% of federal highway funds from states that did not adopt a law mandating that all riders wear a helmet. Within 2 years, 36 states had adopted universal helmet laws, and by 1975, this number had grown to 47 states and the District of Columbia.21 However, Congress amended the act in 1976, making the sanction applicable to only those states that did not require riders younger than 18 years-old to wear a helmet and leading to the repeal of universal coverage in 27 states shortly thereafter.20
Federal policy shifted again in 1991, when Congress passed the Intermodal Surface Transportation Efficiency Act (105 Stat 1914), which offered grants and imposed sanctions to induce states to adopt universal motorcycle helmet laws. However, with the passage of the National Highway System Designation Act (109 Stat 568) in 1995, Congress eliminated the sanction established by the Intermodal Surface Transportation Efficiency Act.11
In response, several states modified their existing universal laws to require only young riders to wear a helmet, effectively repealing universal coverage and instituting partial coverage. Arkansas and Texas were the first to do so in 1997, and they were followed by Kentucky (1998), Louisiana (1999), Florida (2000), and Pennsylvania (2003).22 With the exception of Louisiana, in which helmet use was required for riders younger than 18 years before universal coverage was readopted in 2004, these partial coverage laws mandate helmet use only for riders younger than 21 years. In addition, partial coverage statutes often require insurance minimums (e.g., in Florida and Texas) or safety courses for less-experienced riders (e.g., in Pennsylvania).
As of the end of 2004, 20 states and the District of Columbia had universal motorcycle helmet laws that required all riders to use a helmet, and 26 states had laws that required only partial coverage of motorcycle riders.21 The remaining 4 states (Colorado, Illinois, Iowa, and New Hampshire) did not require any motorcyclists to use a helmet.
Although most research indicates that universal laws are effective in increasing helmet use15,18,19 and reducing motorcyclist fatalities,11 less is known about the effects of the recent repeals of universal coverage. In several of the states in which recent repeals have been instituted, observational surveys have shown rates of helmet use near 100% the year before the repeal and 50% to 66% a year or 2 later.20,22 Similarly, simple before-and-after comparisons showed that motorcyclist deaths increased 21% in Arkansas and 30% in Texas the year after these states switched from universal to partial coverage.22
In Florida, an interrupted time-series study of the number of monthly fatalities per registered motorcycle revealed a 21% increase in the fatality rate.23 Another study indicated a 25% increase in the likelihood of death in the event of a crash24 after the repeal of universal coverage; however, a similar study conducted by Stolzenberg and D’Alessio did not produce the same results.25
A major limitation of these single-state time-series studies has been their inability to control for factors that correlate with the adoption of helmet laws, helmet use, and traffic crashes across states.11 Cross-sectional time-series analyses allow for such controls to be included in model estimates, but recent studies involving such analyses have produced mixed results.
Two such studies conducted before the recent set of repeals showed significant reductions in fatalities associated with universal laws,26,27 but another did not reveal statistically significant differences.3 The former 2 studies failed to include control variables, so coefficients may have been biased, and the latter study covered only 3 years and employed a random effects model that did not account for differences in state-specific attributes such as culture, preferences for safety laws, and riding habits. Finally, a more recent study involving data from the years 1976 to 1997 indicated that per capita motorcyclist fatality rates are 29% to 33% lower in states with universal laws.11
Because none of the previous cross-sectional time-series studies included a sufficient number of postrepeal observations, these studies are of limited utility for evaluating the recent repeals. Furthermore, these investigations failed to distinguish states with partial coverage from those with no legislation. The argument has been that a partial coverage statute is no different from the absence of a helmet law. Riders without helmets are very conspicuous in states with universal coverage; in states with partial coverage, however, law enforcement officers must quickly judge the likelihood of whether riders without helmets fall in the age range covered by the helmet law, making enforcement far more problematic.3,11,28,29 It would be useful to test the assumption that partial coverage laws are ineffective so as to avoid biased estimates of the effects associated with repealing universal coverage.
Our goal was to overcome these limitations in the extant research. We used cross-sectional, time-series data from the 50 states and the District of Columbia for the period 1975 through 2004 to examine the relationship between state helmet laws and motorcyclist fatality rates. We highlighted the recent repeals of universal coverage in 6 states in a multi-state context by including a variable representing these repeals. The estimated multivariate model allowed us to control for other factors correlated with motorcycle safety and changes in helmet laws. In addition, we used separate variables to distinguish the effects of universal and partial coverage statutes on motorcycle safety.
METHODS
Data
We gathered data for each year over a 30-year period for each state and the District of Columbia; our unit of analysis was state-years, meaning that in the case of each state, a separate observation was created for each year in the time period. There were 30 observations (each corresponding to a different year) for each of the 51 cross sections (a total of 1530 state-year observations).
We derived annual fatality data from NHTSA’s Fatal Accident Reporting System files for the years 1975 through 2004.1 To partially control for exposure to crash risk because of variations in the number of motor-cyclists across states, we divided fatality counts by the annual number of registered motorcycles in each state (these data were obtained from the Federal Highway Administration’s annual Highway Statistics30). The dependent variable was the annual number of motorcyclist fatalities per 10 000 registered motorcycles.
Fatality Rate Covariates
To assess the effects of motorcycle helmet laws, we used 2 binary variables representing whether a state law requires all riders to wear a helmet or requires only some riders to do so (states with no laws represented the omitted reference category).21 In addition, we included several other state policies in our analyses that may influence motorcycle safety: a minimum legal drinking age of 21 years, a 0.08 blood alcohol concentration illegal per se law (i.e., a law prohibiting driving a motor vehicle with a blood alcohol concentration at or above 8 g alcohol per 1000 g blood), and a maximum speed limit of 65 miles (104 km) per hour or higher on any state roads. Previous studies indicate that the 2 alcohol-related policies are negatively correlated with motorcycle fatality rates.31,32
By contrast, higher maximum speed limits would be expected to compromise traffic safety, especially among motorcyclists.33 We coded midyear changes in all policies as the proportion of days in a year on which a law was in effect. We gathered information on these traffic safety laws from the Insurance Institute of Highway Safety and NHTSA’s annual Traffic Safety Facts.15,21
Beyond policies, several other state characteristics may be related to motorcyclist fatality rates. For instance, motorcycle riding is a highly seasonal activity that is more frequent in states with longer warm, dry seasons.34 We characterized state climate in terms of normal annual daily mean temperature (in degrees Fahrenheit) and normal annual precipitation (in inches).35 Because warm temperatures increase motorcycle riding, but precipitation decreases riding, we expected motorcyclist fatality rates to be positively related to higher temperatures and negatively related to higher precipitation levels.3,11,34 Although the individual probability of an accident may increase during travel in poor weather conditions, the aggregate effect of cold temperatures and high amounts of precipitation is likely to reduce the amount of motorcycle travel throughout a state.
Our models included several demographic attributes related to traffic safety: percentage of the young adult population aged 15 to 29 years, percentage of the adult population aged 50 to 69 years, percentage of the adult population that is male, income per capita (in constant $1000s), apparent alcohol consumption per capita (in gallons of ethanol), and population density (number of residents per square mile).36,37 We expected that percentage of young adults, percentage of the adult population that is male, and alcohol consumption would be positively correlated with motorcyclist fatality rates. Conversely, we hypothesized that income per capita and population density would be negatively related to these rates. We included percentage of the population aged 50 to 69 years to reflect the trend toward more “baby boomers” riding motorcycles and the potential for more serious consequences when someone in this age group ends up in a crash.
We derived data for the variables just described from annual editions of the Statistical Abstract of the United States.35 The only exception was alcohol consumption data, which were derived from the National Institutes of Health.38 Descriptive statistics for all of the continuous variables included in the analysis are reported in Table 1 ▶, separately for years in which states had universal, partial, or no helmet laws. Clear differences exist between these categories on several variables, further suggesting the need to control for state characteristics to properly estimate the effects of helmet laws on motorcyclist fatality rates.
TABLE 1—
Descriptive Statistics for Continuous Variables, by Type of Helmet Law (n = 1530 state-years): United States, 1975–2004
| Mean (SD) | Minimum | Maximum | |
| Universal helmet law (state-yeara n = 723) | |||
| Motorcyclist fatalities per 10 000 | 8.37 (5.00) | 1.14 | 49.97 |
| Normal annual daily temperature, °F | 56.25 (7.48) | 40.30 | 82.00 |
| Normal annual precipitation, inches | 40.05 (12.68) | 7.05 | 66.98 |
| Adult population male, % | 47.91 (1.07) | 45.33 | 54.00 |
| Young adult population aged 15–29 y, % | 30.82 (4.94) | 22.19 | 46.51 |
| Adult population aged 50–69 y, % | 23.33 (1.78) | 14.13 | 29.24 |
| Income per capita, constant $1000s | 13.92 (3.17) | 7.81 | 27.42 |
| Per capita alcohol consumption, gallons of ethanol | 2.51 (0.84) | 1.60 | 6.92 |
| No. of residents per square mile | 554.86 (1788.02) | 0.63 | 10 601.55 |
| Partial helmet law (state-yeara n = 658) | |||
| Motorcyclist fatalities per 10 000 | 7.31 (4.23) | 0.46 | 33.22 |
| Normal annual daily temperature, °F | 53.30 (9.65) | 40.00 | 77.50 |
| Normal annual precipitation, inches | 30.24 (14.30) | 7.05 | 64.16 |
| Adult population male, % | 48.78 (1.23) | 46.76 | 53.83 |
| Adult population aged 15–29 y, % | 30.90 (4.81) | 22.13 | 46.18 |
| Adult population aged 50–69 y, % | 22.47 (2.14) | 14.06 | 28.64 |
| Income per capita, constant $1000s | 13.97 (2.48) | 9.40 | 24.23 |
| Per capita alcohol consumption, gallons of ethanol | 2.50 (0.60) | 1.20 | 5.76 |
| No. of residents per square mile | 129.84 (198.35) | 0.67 | 890.14 |
| No helmet law (state-yeara n = 149) | |||
| Motorcyclist fatalities per 10 000 | 6.22 (2.82) | 1.37 | 15.92 |
| Normal annual daily temperature, °F | 50.45 (3.17) | 45.00 | 62.30 |
| Normal annual precipitation, inches | 29.87 (9.38) | 14.55 | 44.39 |
| Adult population male, % | 48.35 (0.69) | 47.47 | 50.25 |
| Young adult population aged 15–29 y, % | 31.33 (4.45) | 23.12 | 40.21 |
| Adult population aged 50–69 y, % | 22.91 (1.61) | 19.72 | 26.58 |
| Income per capita, constant $1000s | 14.74 (2.35) | 10.22 | 20.71 |
| Per capita alcohol consumption, gallons of ethanol | 2.65 (0.54) | 1.80 | 4.13 |
| No. of residents per square mile | 147.65 (170.77) | 20.20 | 655.50 |
aFor each state, a separate observation was created for each year in the time period.
Statistical Analysis
Our primary motivation for using cross-sectional, time-series data was to address the problems posed by unobserved factors that differ across states but are time invariant within a state. State attributes such as culture may influence the adoption of a helmet use law as well as helmet use regardless of legal mandate. Failure to address this endogeneity problem regarding helmet laws could lead to biased parameter estimates for model variables. To represent these unobserved factors, we included state fixed-effects parameters in the models in the form of 50 separate binary variables (1 for each state and the District of Columbia with a single exception). In a fixed-effects model, the coefficients for the independent variables are assumed to be constant across each cross section, whereas each cross section has a unique intercept as represented by its state binary variable.39
In addition, traffic safety is influenced over time by national forces such as technological advancements and economic factors that influence amounts of travel. To better isolate the effects of helmet laws on motorcyclist fatality rates, our models included year fixed effects, which were essentially intercepts for each year of the data, to capture these unobserved factors that may have relatively uniform influences across all states but change over time.39 Diagnostic tests provided statistical support for the decision to include both state and year fixed effects in the estimated models. Finally, to avoid bias in our estimates because of systematic patterns in regression error terms (heteroskedasticity across states and first-order autocorrelation over time), we estimated all models using a feasible generalized least squares regression routine.39
RESULTS
Trends in Fatality Rates
Figure 1 ▶ presents trends in motorcyclist fatality rates in the states in which recent repeals have been instituted (“repeal states”) and in all other states. As the group of repeal states switched from universal to partial coverage, the fatality rate in this group began to increase and continued to increase as more of these states repealed universal laws. From 1996 to 2004, the rate for the repeal states rose from 7.2 to 8.9 fatalities per 10 000 registered motorcycles, a 23.6% increase.
FIGURE 1—
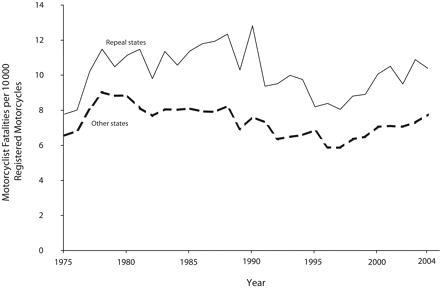
Motorcyclist fatality rates in 6 repeal states versus all other states, 1975–2004.
Note. The 6 repeal states were Arkansas, Florida, Kentucky, Louisiana, Pennsylvania, and Texas.
It is also evident that during the same period the fatality rate increased among states that had not modified their helmet laws since 1997. In these states, the rate rose from 5.2 in 1996 to 6.2 in 2004, a 19.2% increase. The slightly higher fatality rate increase in the group of repeal states during this period was probably because of contributions from factors other than modifications to helmet laws. To properly evaluate the effects of the recent repeals, it is necessary to control for other factors that may influence fatality rates in different states.
Effects of Helmet Laws
The fixed-effects, cross-sectional time-series regression models shown in Table 2 ▶ provide a more complete picture of the relationship between helmet laws and fatality rates. The first model compared fatality rates in states with universal helmet laws with rates in all other states. It is clear that requiring all riders to wear a helmet enhances motorcyclist safety. On average, approximately 1 less fatality per 10 000 registered motorcycles occurred in states with universal coverage than in states with partial laws or no laws (95% confidence interval [CI] = −1.44, −0.66). This translates into an 11.1% fatality rate reduction after we controlled for other policies and demographic variables (Table 3 ▶).
TABLE 2—
Unstandardized Parameter Estimates From Regression Models of Motorcyclist Fatalities per 10 000 Registered Motorcycles: United States, 1975–2004
| Model 1,a b (SE) | Model 2,b b (SE) | Model 3,c b (SE) | |
| Universal helmet law | |||
| All states | −1.0451 (0.1987)** | −1.3293 (0.2995)** | . . . |
| 6 repeal statesd | . . . | . . . | −2.7403 (0.7167)** |
| All nonrepeal states | . . . | . . . | −1.1806 (0.3106)** |
| Partial helmet law | |||
| All states | . . . | −0.3695 (0.2937) | . . . |
| 6 repeal statesd | . . . | . . . | −1.3786 (0.7707) |
| All nonrepeal states | . . . | . . . | −0.4829 (0.2989) |
| Minimum legal drinking age 21 y | −0.5390 (0.2016)** | −0.5824 (0.2039)** | −0.5400 (0.2047)** |
| 0.08 blood alcohol concentration law | −0.0374 (0.1966) | −0.0399 (0.1960) | −0.0693 (0.1972) |
| Roads with maximum speed limits ≥65 mph | 0.4853 (0.3182) | 0.4995 (0.3171) | 0.4934 (0.3161) |
| Normal annual daily mean temperature, °F | −0.0242 (0.0336) | −0.0205 (0.0329) | −0.0273 (0.0330) |
| Normal annual precipitation, inches | −0.0842 (0.0528) | −0.0880 (0.0529) | −0.0733 (0.0534) |
| Adult population male, % | 0.5960 (0.3377) | 0.5922 (0.3355) | 0.5476 (0.3363) |
| Young adult population aged 15–29 y, % | 0.1361 (0.0675)* | 0.1481 (0.0677)* | 0.1463 (0.0678)* |
| Adult population aged 50–69 y, % | 0.3719 (0.0884)** | 0.3670 (0.0883)** | 0.3691 (0.0883)** |
| Income per capita, constant $1000s | 0.2221 (0.0885)* | 0.2197 (0.0882)* | 0.2156 (0.0885)* |
| Per capita alcohol consumption, gallows of ethanol | 1.1874 (0.3289)** | 1.1825 (0.3282)** | 1.1983 (0.3286)** |
| No. of residents per square mile | −0.0108 (0.0025)** | −0.0108 (0.0025)** | −0.0110 (0.0025)** |
| No. of observations | 1530 | 1530 | 1530 |
| Model χ2 | 2516.6** | 2533.5** | 2546.1** |
| Adjusted R2 | 0.6328 | 0.6318 | 0.6361 |
Note. State and year fixed-effects parameters were estimated but are not reported here. Values in parentheses are SEs corrected for groupwise heteroskedasticity and first-order serial correlation.
aModel 1 compared fatality rates in states with universal helmet laws with rates in all other states.
bModel 2 made the same comparison as model 1 but included a binary variable representing the presence of a partial coverage helmet law.
cModel 3 was the same as model 2 but included 2 additional binary variables to separate the effects of partial and universal helmet laws in the 6 repeal states (Arkansas, Florida, Kentucky, Louisiana, Pennsylvania, and Texas) from the effects of these laws in nonrepeal states.
dArkansas, Florida, Kentucky, Louisiana, Pennsylvania, Texas.
*P ≤ .05; **P ≤ .01.
TABLE 3—
Estimated Fatality Rate Reductions Associated With Helmet Laws: United States, 1975–2004
| Model 1,a % | Model 2,b % | Model 3,c % | |
| Universal helmet law | |||
| All states | −11.1 | −13.7 | . . . |
| 6 repeal statesd | . . . | . . . | −22.3 |
| Nonrepeal states | . . . | . . . | −12.7 |
| Partial helmet law | |||
| All states | . . . | NS | . . . |
| 6 repeal statesd | . . . | . . . | NS |
| Partial helmet law: nonrepeal states | . . . | . . . | NS |
Note. NS = nonsignificant (P > .05). Ellipses = not applicable.
aModel 1 compared fatality rates in states with universal helmet laws with rates in all other states.
bModel 2 made the same comparison as model 1 but included a binary variable representing the presence of a partial coverage helmet law.
cModel 3 was the same as model 2 but included 2 additional binary variables to separate the effects of partial and universal helmet laws in the 6 repeal states (Arkansas, Florida, Kentucky, Louisiana, Pennsylvania, and Texas) from the effects of these laws in other states.
dArkansas, Florida, Kentucky, Louisiana, Pennsylvania, Texas.
Model 1 implicitly assumed that a motorcycle helmet law covering only a portion of the riding population does not lead to safety benefits. If this assumption is incorrect, the model probably underestimated the actual safety benefits of universal coverage because the estimated coefficient represented the difference between the average experience of states under a universal law and the average experience of states under either partial coverage or no law. To test this assumption, the second model (Table 2 ▶) included a binary variable representing the presence of a partial coverage helmet law. The only category in model 2 not represented by a variable was the absence of a helmet law, which served as the reference category. For this reason, we interpreted the 2 helmet law parameter estimates as the reductions in fatality rates attributable to type of coverage as compared with what would be expected if no law existed.
Once partial coverage states were included in the model, the effect of universal helmet laws on motorcyclist fatality rates was slightly greater than initially estimated. Universal laws were associated with 1.3 fewer fatalities than would be expected without any law (95% CI = −1.92, −0.74). This translates into a 13.7% reduction in the fatality rate attributable to implementing universal coverage (Table 3 ▶). Furthermore, the partial helmet law coefficient was not statistically significant, meaning that the fatality rate associated with partial coverage was not statistically different from that associated with no helmet law.
As a means of examining the safety consequences of the recent repeals of universal coverage, 2 additional binary variables were included in model 3 to separate the effects of partial and universal helmet laws in the 6 repeal states (Arkansas, Florida, Kentucky, Louisiana, Pennsylvania, and Texas) from the effects of these laws in nonrepeal states. One binary variable represented the presence of a universal coverage statute in the repeal states, and the other captured the presence of a partial postrepeal coverage statute in these states. Two more binary variables indicated the presence of a universal or partial coverage law in all other states. Once again, because “no law” was the only category in the model not represented by a variable, we interpreted the coefficients for the helmet law variables as the differences between a state’s experience under the type of policy represented by the variable and the experience of a state without any mandatory helmet law.
In the 6 repeal states, on average, the fatality rate was 2.7 points lower under universal coverage than what would have been expected if these states had no helmet law (95% CI = −4.14, −1.34). In the 6 states, the presence of a universal helmet law was associated with a 22.3% reduction in fatality rates (Table 3 ▶). By contrast, the partial coverage coefficient for these states was not statistically significant, indicating that, after repeal of universal coverage, fatality rates were not significantly different from what would be expected in the absence of a helmet law.
On average, during the postrepeal period under partial coverage, 10.7 fatalities per 10 000 registered motorcycles occurred in the 6 repeal states. Had these states maintained universal coverage up through 2004, their predicted average fatality rate would have been 9.5 per 10 000 (based on model 3). Thus, these states experienced a 12.2% increase in motorcyclist fatality rates as a result of repealing universal coverage and implementing partial coverage.
Universal helmet laws also resulted in lower fatality rates in the other states and the District of Columbia, where universal coverage was associated with 1.2 fewer deaths per 10 000 registered motorcycles relative to absence of coverage (95% CI = −1.79, −0.57). Similar to what was found in model 2, the partial coverage variable was not significant. In these states and the District of Columbia, the presence of universal coverage translated into a 12.7% reduction in motorcyclist fatality rates (Table 3 ▶), whereas fatality rates under partial coverage were not appreciably different from fatality rates in the absence of a law.
In summary, motorcyclist fatality rates in the 6 repeal states, as a group, were higher after they switched from universal to partial coverage. An estimated 615 more motorcyclist fatalities (a 15% increase) occurred in these states after the repeal than what would have been expected under universal coverage (based on model 3). In 2004 alone, an estimated 135 (or 5.8%) fewer fatalities would have occurred in these 6 states and the 25 others without universal coverage had a universal helmet law been in effect for the entire year.
Other Fatality Rate Covariates
In terms of other factors that influence motorcycle safety, the 3 models indicated that a minimum legal drinking age of 21 years was correlated with lower fatality rates. The parameter estimates for a 0.08 blood alcohol concentration law and maximum speed limits of 65 miles per hour or higher, however, were not statistically significant. Among state demographic attributes, percentage of young adults and percentage of the population aged 50 to 69 years were positively correlated with motorcyclist fatality rates, as were per capita alcohol consumption and income per capita; these rates were negatively correlated with population density. Neither climate variable emerged as a statistically significant correlate of motorcyclist fatality rates.
DISCUSSION
Our findings highlight the need to evaluate repeals of universal coverage motorcycle helmet laws in a multivariate, multistate context. Although we found that fatality rates increased in the 6 states that have changed from universal to partial coverage since 1997, the estimated size of this effect was lower than that observed in previous studies. Motor-cyclist fatality rates have risen in all states in this postrepeal era, something that previous single-state evaluations have not addressed.
However, our findings must be tempered by the fact that the postrepeal period is relatively short. As discussed, only 6 states have repealed universal coverage since 1997, and data on no more than a few postrepeal years are available for any of these states. Furthermore, motorcyclist fatality rates in the 6 repeal states tend to be higher than average. This situation raises the question as to whether repeal of universal coverage in states with historically lower fatality rates will have a similar impact on safety.
Even so, the repeals of universal coverage since 1997 have compromised motorcyclist safety. Our findings appear more significant in light of the current political environment that indicates momentum may be building to reduce universal coverage in other states. At the state level, legislative will seems poised to modify more laws; for example, in 2005, bills were introduced in 15 of the 21 universal coverage states mandating only that young riders must wear a helmet.40
Furthermore, although NHTSA’s 2006 Motorcycle Safety Program Plan indicates that “motorcycle helmet use laws are the most effective way to get all motorcyclists to wear helmets,” it focuses only on rider education and training, licensing, rider impairment, and motorist awareness in outlining initiatives designed to enhance motorcyclist safety; it does not include a strategy for encouraging states to maintain or adopt universal coverage laws.41(p10) Together, the circumstances just described do not bode well for the future of universal helmet laws in the United States. Our analysis indicates that motorcyclist safety has been compromised in the states that have repealed universal coverage and that safety is likely to be compromised in other states that abandon these statutes as well.
Acknowledgments
We thank the anonymous reviewers for their helpful comments.
Human Participation Protection No protocol approval was needed for this study.
Peer Reviewed
Contributors Both authors originated and wrote the article. D. J. Houston conducted the statistical analysis.
References
- 1.National Highway Traffic Safety Administration. Fatal Accident Reporting System. Available at: http://www.nhtsa.dot.gov/people/ncsa/fars.html. Accessed February 12, 2006.
- 2.Shankar U, Varghese C. Recent Trends in Fatal Motorcycle Crashes: An Update. Washington, DC: US Department of Transportation; 2006. DOT publication HS 810 606.
- 3.Branas CC, Knudson MM. Helmet laws and motorcycle rider death rates. Accid Anal Prev. 2001;33: 641–648. [DOI] [PubMed] [Google Scholar]
- 4.Sosin DM, Sacks JJ, Holmgreen P. Head injury-associated deaths from motorcycle crashes. JAMA. 1990;264:2395–2399. [PubMed] [Google Scholar]
- 5.Sosin DM, Sacks JJ. Motorcycle helmet-use laws and head injury prevention. JAMA. 1992;267: 1649–1651. [DOI] [PubMed] [Google Scholar]
- 6.Evans L, Frick MC. Helmet effectiveness in preventing motorcycle driver and passenger fatalities. Accid Anal Prev. 1988;20:447–458. [DOI] [PubMed] [Google Scholar]
- 7.Weiss AA. The effects of helmet use on the severity of head injuries in motorcycle accidents. J Am Stat Assoc. 1992;87:48–56. [Google Scholar]
- 8.Fleming NS, Becker ER. The impact of the Texas 1989 motorcycle helmet law on total and head-related fatalities, severe injuries, and overall injuries. Med Care. 1992;30:832–842. [DOI] [PubMed] [Google Scholar]
- 9.Gabella B, Reiner KL, Hoffman RE, Cook M, Stallones L. Relationship of helmet use and head injuries among motorcycle crash victims in El Paso County, Colorado, 1989–1990. Accid Anal Prev. 1995;27: 363–369. [DOI] [PubMed] [Google Scholar]
- 10.Sarkar S, Peek C, Kraus JF. Fatal injuries in motorcycle riders according to helmet use. J Trauma. 1995; 38:242–245. [DOI] [PubMed] [Google Scholar]
- 11.Sass TR, Zimmerman PR. Motorcycle helmet laws and motorcyclist fatalities. J Regulatory Econ. 2000;18: 195–215. [Google Scholar]
- 12.Deutermann W. Motorcycle Helmet Effectiveness Revisited. Washington, DC: Department of Transportation; 2004. DOT publication HS 809 715.
- 13.Keng SH. Helmet use and motorcycle fatalities in Taiwan. Accid Anal Prev. 2005;37:349–355. [DOI] [PubMed] [Google Scholar]
- 14.Rowland J, Rivara F, Salzberg P, Soderberg R, Maier R, Koepsell T. Motorcycle helmet use and injury outcome and hospitalization costs from crashes in Washington State. Am J Public Health. 1996;86:41–45. [DOI] [PMC free article] [PubMed] [Google Scholar]
- 15.National Highway Traffic Safety Administration. Traffic Safety Facts, 2004 Data: Motorcycles. Washington, DC: Department of Transportation; 2004. DOT publication HS 809 908.
- 16.Baker SP. On lobbies, liberty, and the public good. Am J Public Health. 1980;70:573–575. [DOI] [PMC free article] [PubMed] [Google Scholar]
- 17.Weisbuch JB. The prevention of injury from motorcycle use: epidemiologic success, legislative failure. Accid Anal Prev. 1987;19:21–28. [DOI] [PubMed] [Google Scholar]
- 18.Phillips BM. Motorcycle Helmet Usage. Washington, DC: Department of Transportation; 1980. DOT publication HS 805 398.
- 19.Berkowitz A. The Effect of Motorcycle Helmet Usage on Head Injuries, and the Effect of Usage Laws on Helmet Wearing Rates. Washington, DC: Department of Transportation; 1981. DOT publication HS 805 851.
- 20.Ulmer RG, Preusser DF. Evaluation of the Repeal of Motorcycle Helmet Laws in Kentucky and Louisiana. Washington, DC: Department of Transportation; 2003. DOT publication HS 809 602.
- 21.Insurance Institute for Highway Safety. History of U.S. motorcycle laws and changes in coverage. Available at: http://www.iihs.org/laws/state_laws/helmet_history.html. Accessed January 27, 2006.
- 22.Preusser DF, Hedlund JH, Ulmer RG. Evaluation of Motorcycle Helmet Law Repeal in Arkansas and Texas. Washington, DC: Department of Transportation; 2000. DOT publication HS 809 131.
- 23.Muller A. Florida’s motorcycle helmet law repeal and fatality rates. Am J Public Health. 2004;94: 556–558. [DOI] [PMC free article] [PubMed] [Google Scholar]
- 24.Kyrychenko SY, McCartt AT. Florida’s weakened motorcycle helmet law: effects on death rates in motorcycle crashes. Traffic Inj Prev. 2006;7:55–60. [DOI] [PubMed] [Google Scholar]
- 25.Stolzenberg L, D’Alessio SJ. “Born to be wild”: the effect of the repeal of Florida’s mandatory motorcycle helmet-use law on serious injury and fatality rates. Eval Rev. 2003;27:131–150. [DOI] [PubMed] [Google Scholar]
- 26.DeWolf VA. The Effect of Helmet Law Repeal on Motorcycle Fatalities. Washington, DC: Department of Transportation; 1986. DOT publication HS 807 065.
- 27.Graham JD, Lee Y. Behavioral response in safety regulation: the case of motorcycle helmet-wearing legislation. Policy Sci. 1986;19:253–273. [Google Scholar]
- 28.National Highway Traffic Safety Administration. A Report to Congress on the Effect of Motorcycle Helmet Use Law Repeal—A Case for Helmet Use. Washington, DC: Department of Transportation; 1980. DOT publication HS 805 312.
- 29.National Highway Traffic Safety Administration. Safety Belt and Helmet Use in 2002—Overall Results. Washington, DC: Department of Transportation; 2002. DOT publication HS 809 500.
- 30.Federal Highway Administration. Highway Statistics. Washington, DC: Department of Transportation; 1995–2004.
- 31.Shults RA, Elder RW, Sleet DA, et al. Reviews of evidence regarding interventions to reduce alcohol-impaired driving. Am J Prev Med. 2001;21:66–88. [DOI] [PubMed] [Google Scholar]
- 32.Tippetts AS, Voas RB, Fell JC, Nichols JL. A meta-analysis of .08 BAC laws in 19 jurisdictions in the United States. Accid Anal Prev. 2005;37:149–161. [DOI] [PubMed] [Google Scholar]
- 33.Baum HM, Wells JK, Lund AK. The fatality consequences of the 65 mph speed limits, 1989. J Safety Res. 1991;22:171–177. [Google Scholar]
- 34.Morris CC. Generalized linear regression analysis of association of universal helmet laws with motorcyclist fatality rates. Accid Anal Prev. 2006;38:142–147. [DOI] [PubMed] [Google Scholar]
- 35.Statistical Abstract of the United States. Washington, DC: US Census Bureau; 1975–2005.
- 36.Houston DJ, Richardson LE, Neeley GW. Legislating traffic safety: a pooled time series analysis. Soc Sci Q. 1995;76:328–345. [Google Scholar]
- 37.Houston DJ, Richardson LE. Reducing traffic fatalities in the American states by upgrading seat belt use laws to primary enforcement. J Policy Anal Manage. 2006;16:645–660. [Google Scholar]
- 38.Lakins NE, Williams GD, Yi HY, Smothers BA. Apparent per Capita Alcohol Consumption: National, State, and Regional Trends, 1977–2002. Bethesda, Md: National Institute on Alcohol Abuse and Alcoholism; 2004. Surveillance report 66.
- 39.Wooldridge JM. Econometric Analysis of Cross Section and Panel Data. Cambridge, Mass: MIT Press; 2002.
- 40.National Highway Traffic Safety Administration. National Conference of State Legislatures’ online legislative tracking database. Available at: http://www.nhtsa.gov/ncsl. Accessed April 2, 2006.
- 41.National Highway Traffic Safety Administration. 2006 Motorcycle Safety Program Plan. Washington, DC: Department of Transportation; 2006. DOT publication HS 810 615.