

Abstract
Low-voltage rapid discharges (or fast EEG ictal activity) constitute a characteristic electrophysiological pattern in focal seizures of human epilepsy. They are characterized by a decrease of signal voltage with a marked increase of signal frequency (typically beyond 25 Hz). They have long been observed in stereoelectroencephalographic (SEEG) signals recorded with intra-cerebral electrodes, generally occurring at seizure onset and simultaneously involving distinct brain regions. Spectral properties of rapid ictal discharges as well as spatial correlations measured between SEEG signals generated from distant sites before, during and after these discharges were studied. Cross-correlation estimates within typical EEG sub-bands and statistical tests performed in ten patients suffering from partial epilepsy (frontal, temporal or fronto-temporal) reveal that SEEG signals are significantly de-correlated during the discharge period compared to periods that precede and follow this discharge. These results can be interpreted as a functional decoupling of distant brain sites at seizure onset followed by an abnormally high re-coupling when the seizure develops. They lead to the concept of “disruption” that is complementary of that of “activation” (revealed by significantly high correlations between signals recorded during seizures), both giving insights into our understanding of pathophysiological processes involved in human partial epilepsies as well as in the interpretation of clinical semiology.
Keywords: Adolescent; Adult; Brain; physiopathology; Electrodes, Implanted; Electroencephalography; Epilepsies, Partial; physiopathology; Female; Humans; Male; Patient Selection; Signal Processing, Computer-Assisted; Statistics
Keywords: Statistical tests, intracerebral EEG, SEEG, Statistical Coupling, Synchronization, Correlation, Spectral analysis, seizure onset, very fast oscillations
1. Introduction
Low-voltage rapid discharges (very fast oscillations observed in ictal EEG activity) constitute a characteristic electrophysiological pattern in focal seizures of human epilepsy characterized by a noticeable decrease of signal voltage (sometimes preceded by high-amplitude spikes) with a marked increase of signal frequency (typically beyond 25 Hz). They have long been observed in stereoelectroencephalographic (SEEG) signals recorded with intra-cerebral electrodes (depth-EEG) during pre-surgical evaluation of refractory partial epilepsies (Bancaud et al. 1973). They occur at seizure onset and are often widespread.
Few neurophysiological studies have been dedicated to rapid low-voltage discharges compared to phasic interictal events (spikes and spike-waves). This may at least be explained by two facts. First, up to the last decade, high frequency EEG activity was difficult to record with conventional EEG systems due to technical limitations (pen response times and low pass cutting frequency usually set around 35 Hz in practice). Now, advances in digital EEG equipment allow signals to be sampled and recorded at very high frequency (typically 256 Hz or 512 Hz in routine EEG and up to 1 kHz or 10 kHz for research purpose). Second, activity belonging to the gamma band of the EEG is also more difficult to observe in human scalp EEG recordings mainly due to contamination by muscle artifact, specially at seizure onset with motor manifestations. Consequently, little information is available regarding high frequency activity in clinical epilepsy. The accepted hypothesis is that rapid discharges often appear in brain regions in keeping with the epileptogenic zone (Bancaud 1974) and that they might be a significant functional indicator of its spatio-temporal organization. The study of this electrophysiological pattern could thus provide relevant clues not only for the understanding of pathophysiological factors which initiate focal seizures in human but also for the definition of an optimal resection that could make the patient seizure free, as underlined by (Alarcon et al., 1995) who analyzed the power spectrum of ictal intracranial EEG signals and concluded that surgical removal of sites of localized high-frequency could be associated to favorable prognosis.
In most of the studies dedicated to high frequency oscillations observed during seizures, spectral analysis techniques were used to measure the power of EEG signal in defined frequency bands (typically delta, theta, alpha, beta and gamma). Ten years ago, Fisher et al. (1992) reported results from five patients suffering from different types of epilepsy. Fast Fourier transform (FFT) power spectra revealed the presence of fast oscillations in two frequency bands (40–50 Hz and 80–120 Hz). This activity was found to appear at seizure onset and often on ECoG contacts supposed to be close to the seizure focus. In the same time, Allen et al. (1992) reported high frequency rhythmic activity in SEEG signals recorded in frontal lobe epilepsy. Autoregressive (AR) spectra showed that rapid activities may be observed in many sites over a wide region of the frontal lobe. Here again, these sites are supposed to be anatomically connected to the epileptogenic zone. More recently, Panzica et al. (1999) studied the spectral features of scalp EEG fast discharges during infantile spasms and Mackenzie et al. (2002) reported results on the regional and spectral distribution of EEG rhythms in picrotoxin-induced seizures in the rat. In the former study, AR analysis revealed the presence of a short rapid discharge of average frequency around 20 Hz. In the latter, fast activity was found during seizures mainly in neocortex and in several subcortical areas.
However, to our knowledge, very few studies deal with spatio-temporal correlations in human intracerebral EEG signals measured during rapid discharges observed at seizure onset. Indeed, studies based on coherence analysis (Duckrow et al. 1992, Zaveri et al. 1999, Bartolomei et al. 1999) or on signal interdependencies (Repucci et al. 2001) do not specifically deal with ictal periods exhibiting high frequency oscillations. On the opposite, studies related to the correlation of EEG signals specifically in the gamma band do exist but mainly during cognitive activation (Menon et al. 1996, Tallon-Baudry et al. 1998).
The present paper focuses on spectral properties of rapid discharges observed at seizure onset and on the evolution of the correlation measured between SEEG signals generated from distant sites before, during and after such discharges. Signal analysis techniques aimed at estimating a linear correlation coefficient in typical EEG sub-bands and statistical tests reveal that signals are significantly de-correlated during ictal rapid discharges (reflected, on the EEG level, by a significant increase of power in the upper frequency band, mainly between 60 and 90 Hz) compared to periods that precede and that follow these discharges. Raised by the obtained results, the hypothesis of a functional decoupling of distant brain sites occurring at the start of seizures and preceding an abnormally high re-coupling when the seizure develops is discussed.
2. Methods
2.1. Patient selection and SEEG recording
Ten patients undergoing pre-surgical evaluation of drug-resistant partial epilepsy were selected for the presence of fast ictal activities in SEEG recordings performed during long-term video-EEG monitoring. All patients had a comprehensive evaluation including detailed history and neurological examination, neuropsychological testing, routine MRI study, scalp EEG and depth EEG recording of seizures. Selection was dependent on the electrophysiological pattern at seizure onset (presence of rapid discharges revealed by visual analysis) and independent from the type of epilepsy (frontal or fronto-temporal). Table 1 provides clinical information about selected patients (age, sex, syndrome, etiology) as well as state of vigilance during analyzed seizures.
Table 1.
Age, sex, syndrome, etiology and state of vigilance during analyzed seizure recordings in the ten selected patients.
| Patient | Age | Sex | Clinical syndrome | Etiology | State of vigilance |
|---|---|---|---|---|---|
| ALB | 41 | F | Right FLE | Post-Traumatic | Awake |
| BEG | 26 | F | Left FLE | FCD | Awake |
| CEL | 31 | M | Right FLE | FCD* | Awake |
| GAU | 17 | F | Left TLE | FCD | Awake |
| JON | 38 | M | Left FLE | Stroke | SW Sleep |
| LAM | 49 | M | Left FLE | Cryptogenic | SW sleep |
| LEG | 16 | M | Right FLE | FCD | Awake |
| MOU | 29 | F | Left FLE | FCD* | SW Sleep |
| POM | 43 | F | Right FTLE | Cryptogenic | Awake |
| TAL | 33 | M | Right FLE | FCD* | SW sleep |
histological diagnosis, FCD: Focal Cortical dysplasia, FLE: frontal lobe epilepsy, FTLE: fronto-temporal lobe epilepsy, TLE: temporal lobe epilepsy, SW: slow-waves.
SEEG recordings were performed using intracerebral multiple lead electrodes (10 to 15 leads, length: 2 mm, diameter: 0.8 mm, 1.5 mm apart) placed intracranially according to Talairach’s stereotactic method (Bancaud et al., 1974; Talairach et al., 1974). The positioning of electrodes is determined in each patient from available non-invasive information and hypotheses about the localization of his/her epileptogenic zone (defined as the cerebral regions simultaneously discharging at seizure onset). The implantation accuracy is per-operatively controlled by telemetric X-ray imaging. A post-operative CT scan without contrast product is then used to verify both the absence of bleeding and the precise 3D location of each lead. Then, intracerebral electrodes are removed and an MRI is performed on which the trajectory of each electrode remains visible. Finally, a CT-scan/MRI data fusion is performed to anatomically locate each lead along each electrode trajectory. All patients had electrodes positioned either in the pre-frontal or frontal region. In some cases, the temporal region was also recorded (See §2.2.1 and table 3). An example of intracerebral SEEG exploration is given in figure 1.
Table 3.
Cerebral structures retained in the ten studied patients for presence of fact activity at seizure onset revealed by Γ-activity maps. See the legend of figure 1 for meaning of electrode names.
| Patient | Electrode name | Cerebral Structure | Electrode name | Cerebral Structure | Electrode name | Cerebral Structure |
|---|---|---|---|---|---|---|
| ALB | PM5-PM6 | Premotor cortex (BA 6) | FP9-FP10 | Fronto-polar cortex (BA 10) | CR3-CR4 | Medio-frontal region (BA 32) |
| BEG | GP′14-GP′15 | Lateral premotor cortex (BA 6) | R′11-R′12 | Post-central cortex (BA 3) | M′10-M′11 | Lateral Premotor cortex (BA 6) |
| CEL | F1-F2 | Medio-frontal region (BA 10) | K1-K2 | Medio-frontal region (BA 32) | G2-G3 | Anterior cingulate area (BA 24) |
| GAU | T′6-T′7 | Superior Temporal gyrus (BA 22, anterior part) | H′9-H′10 | Superior Temporal gyrus (BA 22, posterior part) | Tbp′1-Tbp′2 | Entorhinal cortex |
| JON | M′11-M′12 | Superior Frontal Gyrus (BA 9) | Q′10-Q′11 | Superior Frontal Gyrus (BA 9/46) | FO′4-FO′5 | Orbito-frontal cortex (BA 13) |
| LAM | SM5-SM6 | Superior Frontal Sulcus (BA 9) | PM5-PM6 | Superior frontal Sulcus (BA 6) | OP1-OP2 | Anterior Insula |
| LEG | PA5-PA6 | Pre central gyrus (BA 4) | MS6-MS7 | Premotor cortex (BA 6) | FI2-FI3 | Premotor cortex (BA 6) |
| MOU | G′2-G′3 | Medio-frontal region (BA 32 anterior) | L′1-L′2 | Medio-frontal region (BA 32 posterior) | I′8-I′9 | Middle frontal gyrus (BA 6) |
| POM | FO1-FO2 | Orbito-frontal cortex (BA 13) | T9-T10 | Superior temporal gyrus (BA 22) | PT8-PT9 | Lateral part of the temporal pole (BA 38) |
| TAL | TR7-TR8 | Superior Frontal Sulcus (BA 9) | AC7-AC8 | Superior Frontal Sulcus (BA 9/46) | OP7-OP8 | Operculo-frontal region |
Figure 1.
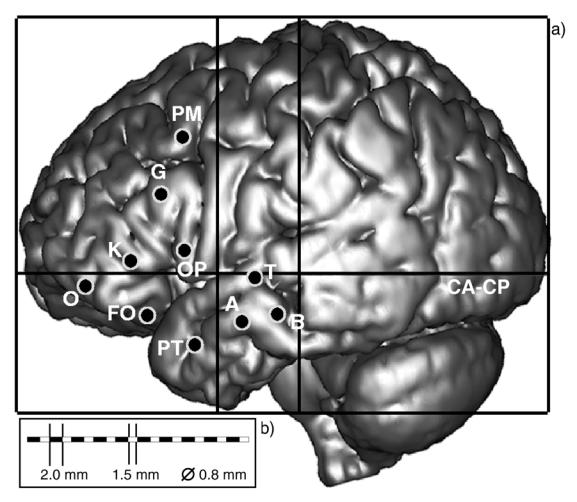
(a) example of intracerebral implantation scheme defined for SEEG exploration in patient POM from non invasive data (EEG, semiology, medical imaging), (b) Intracerebral multiple lead electrodes are implanted under stereotactic conditions as shown by the solid line rectangle that corresponds to Talairach’s reference frame. In our group, electrodes are identified by one or two capital letters (A, PO, …) and recording leads are numbered from 1 to 10 or 15 depending on the number of leads per electrode. Low weight numbers (1, 2, 3, …) generally correspond to deepest structures (for instance, leads A1, A2 record signals from the amygdala while A9, A10 record the lateral neocortex of the middle temporal gyrus). Bipolar signals are obtained from subtraction of signals recorded on two adjacent leads (for instance, bipolar signal A1-A2 may be obtained from monopolar signals A1 and A2).
Signals were recorded on a Deltamed™ system on a maximum number of channels equal to 128. They were sampled at 256 Hz and recorded to hard disk (16 bits/sample) using no digital filter. The only filter present in the acquisition procedure is a hardware analog high-pass filter (cut-off frequency equal to 0.16 Hz) used to remove non physiological very slow variations that sometimes contaminate the baseline.
2.2. SEEG signal analysis
2.2.1. Bandpass filtering of SEEG signals and selection of distant sites exhibiting γ activity
The time series were decomposed on a filter bank which cut-off frequencies were chosen in accordance with classical EEG frequency sub-bands theta, alpha and beta. For the upper frequency band, we used a highpass filter with a cut-off frequency equal to 24 Hz in order to detect the fastest oscillations, given our recording system. This band, denoted by symbol Γ, thus ranges from 24 to 128 Hz and is larger than the classical gamma band often denoted by symbol γ and traditionally defined as ranging from 24 to 80 Hz (Niedermeyer et Lopes Da Silva 1998). Frequency range corresponding to each sub-band is given in table 2. Hamming finite impulse response (FIR) filters were chosen for their linear phase that is more appropriate for the computation of correlation coefficients (r2) in selected sub-bands than a nonlinear phase (see §2.2.2). A filter order equal to 256 (one second duration for the sampling rate of 256 Hz) that gave satisfactory impulse responses for each sub-band was retained. Readers may refer to (Hamming 1998) for additional information about digital filter design. The signal average power PB was then estimated in each sub-band B over a 5 s long sliding window W stepped every 0.250 ms according to the following equation: where sB(t) denotes signal s(t) filtered in sub-band B.
Table 2.
Lower and upper values of frequency bands used in the design of bandpass/highpass Hamming filters (Adapted from Niedermeyer et al. 1998).
| Frequency band | Range (Hz) |
|---|---|
| Theta (θ) | 3.5 ≤ f < 7.4 |
| Alpha (α) | 7.4 ≤ f < 12.4 |
| Beta (β) | 12.4 ≤ f < 24 |
| Gamma (Γ)* | 24 ≤ f< 128 |
As signals are sampled at 256 Hz, the upper frequency band actually ranges from 24 Hz to 128 Hz, in our case. This bandwidth was chosen larger than the traditional EEG gamma band (24–80 Hz) to capture very fast oscillations observed in low voltage rapid discharges.
For each patient, three distant brain sites (different electrodes) generating rapid discharges at seizure onset were selected from the estimation of the signal power PΓ in sub-band Γ (highest frequencies). In order to facilitate this selection and to make it independent from visual choice, a color-coded map, referred to as the Γ-activity map, was computed on one SEEG recording reflecting each patient typical seizure pattern. The Γ-activity map is a 2D representation of the evolution of PΓ as a function of both time and space (i.e. the space of recording channels, up to 128). As detailed in figure 2, when computed on the seizure onset period and associated to the sorting of PΓ values (descending order), Γ-activity maps allow cerebral regions that generate signals with maximal power in the Γ band (fast activity) to be objectively identified.
Figure 2.
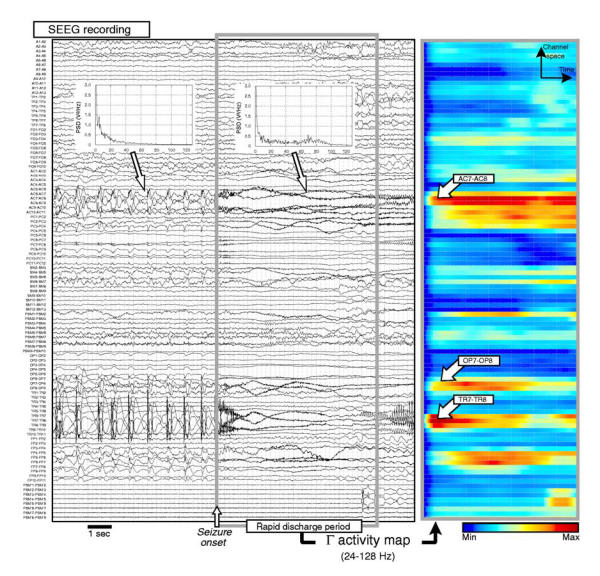
a) example of intracerebral recording performed during SEEG exploration (patient TAL). Seizure begins precisely during the abrupt change in the activity reflected by signals (transition from sustained discharge of high amplitude spikes to a low voltage rapid discharge expressing in the gamma band of the EEG, as revealed by power spectral densities computed before and after seizure onset), b) Γ-activity map computed over a seven second period starting from seizure onset. A color-coding is used to represent the power in the upper frequency band (24 to 128 Hz) as a function of both time and space (recording channels). In this example, on three electrodes (AC, TR and OP) respectively recording the superior frontal sulcus (BA9 and BA9/46) and operculo-frontal region, bipolar signals AC7-AC8, TR7-TR8 and OP7-OP8 exhibit fast activity revealed by high power in the Γ sub-band (red color). A depicted on the map, very fast oscillations may appear quasi-simultaneously in distinct neural sites.
2.2.2. Estimation of SEEG signals spatio-temporal correlations in sub-bands
For each one of the three pairs of signals built from the three SEEG signals (selected from the power in Γ sub-band criterion, see § 2.2.1), spatial correlations were estimated from linear regression. This method can be used to compute a correlation coefficient, referred to as r2, that indicates to what extent samples contained in a temporal sliding window defined on two SEEG signals are correlated. Readers may refer to (Pijn 1990) for details about methodological aspects of linear and nonlinear regression analysis. The methodological novelty with respect to aforementioned works is that we applied the method on the bandpass filtered version of SEEG signals in order to evaluate interdependencies (amplitude/phase relationships) as a function of both time and frequency band. In order to limit the influence of the common reference in the computation of spatio-temporal correlation, bipolar signals obtained from subtraction of monopolar signals recorded on two adjacent leads were preferred to monopolar signals themselves. Readers may refer to (Bullock et al. 1995) for discussion on the effect of a common reference on the measurement of cross-correlation.
Briefly, the method proceeds in two steps. First, the two signals X and Y to be analyzed are filtered, as described in §2.2.1. Second, the squared linear correlation coefficient r2 is estimated on each pair of filtered signals X and Y (i.e. in each sub-band) as a function of time, r2 values range from 0.0 (there exists no linear relationship between signals X and Y in the considered frequency band) to +1.0 (there exists a constant phase relationship between oscillations present in signals X and Y in the considered frequency band).
Coefficient r2 was computed on each pair of signals recorded from distant sites on the whole seizure duration. The analysis then focused on three distinct periods visually defined from the time of occurrence of the rapid discharge observed at seizure onset, as shown in figure 3. The first period (denoted by “BD” for “before discharge”) corresponds to the period preceding the discharge, the second one (denoted by “D” for “discharge”) corresponds to the discharge itself and the third period (denoted by “AD”) corresponds to the period that follows the discharge when the frequency gradually decreases and when spike activity of increasing amplitude starts to appear. Visual identification of the discharge period (D) as well as definition of starting and ending time are straightforward since this electrophysiological pattern is very characteristic (sudden amplitude decrease and frequency increase). Once the discharge period was defined, a one minute time interval was systematically chosen for the before discharge period (BD). The third period (AD) was defined as the time interval from the end of the discharge to the end of the seizure. Along these three periods, both the power values per sub-band and the r2 values per sub-band were averaged over time. Finally, for each patient and for each period (BD, D or AD), the relative average power per sub-band was determined for each one of the three selected brain site and the average r2 per sub-band was determined for each one of the three distinct pairs of distant sites. To facilitate visual comparison, results were represented using histograms, as shown in figures 3-e and 3-f that give examples of relative average power and average r2 obtained from the application of the method on two SEEG signals recorded from two distant brain sites before, during, and after a low-voltage rapid discharge.
Figure 3.
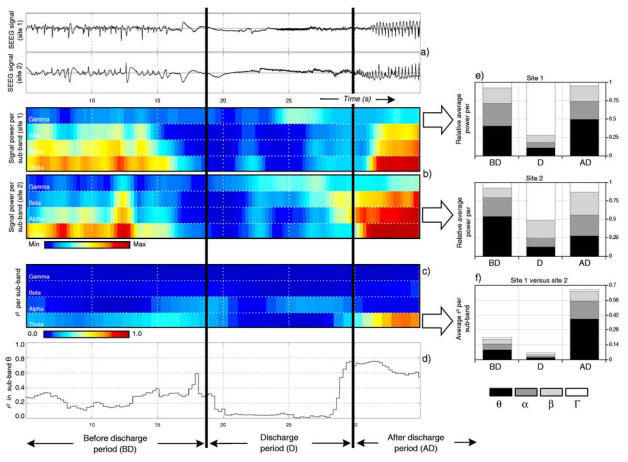
Signal processing procedure used to characterize the power of signals reflecting low voltage rapid discharge at seizure onset and used to quantify their spatio-temporal correlation. Single signals (a) are first studied for spectral features. A filter bank (Hamming filters, see text §2.2.1) is used to separate theta, alpha, beta and gamma (24 – 128 Hz) components in corresponding sub-bands (see table 2). Three periods (BD: before the discharge, D: during the discharge, AD: after the discharge) are defined by visual analysis. On each period, the power in each sub-band is estimated and represented as a color-coded map (b) aligned with the signal. Power in each sub-band is then averaged over each period (BD, D and AD). An histogram (e) representing the relative power per sub-band as a function of the period is then constructed. Spatio-temporal correlations are measured on each pair of signals. They are estimated via the computation of a linear correlation coefficient optimized for time delays (referred to as the r2 coefficient). This computation is performed over two windows sliding on the two signals under analysis and in each sub-band and. A color-coded map (c) that gives r2 values as a function of time and frequency sub-band is then built and aligned with signals. r2 values range in the interval [0, 1], as shown in the plot (d) displaying values measured over the theta sub-band. Finally, r2 values are averaged over the three periods of interest (BD, D and AD) in each frequency band and summarized by an histogram (f).
2.3. Statistical analysis
Statistical analysis focused on r2 histograms in order to determine if there exist significant differences in the evolution of correlations between signals from distant sites which are respectively computed over the pre-ictal/ictal periods (i.e. BD, D and AD periods). For each patient and for each pair of distant sites, r2 values per sub-band were first summed and normalized according to the following equation in order to make their distribution Gaussian (Bendat and Piersol, 1971). Then, a student t-test and an analysis of variance were performed in order to determine whether normalized distributions of correlation values over the BD, D and AD periods have the same - or significantly different - mean.
3. Results
Γ-activity maps were computed on one seizure recording (typical pattern) per patient, as described in §2.2.1 and led to determine three brain sites generating signals with high power in the upper frequency band Γ at seizure onset. Results are given in Table 3. In all patients, frontal structures are involved during the ictal rapid discharge, except in patient GAU in whom fast activity mainly appears in temporal structures (temporal lobe epilepsy). In some patients, distant sites may be simultaneously involved during the initial discharge, as in patient POM in whom signals from the orbito-frontal cortex, the superior temporal gyrus and the lateral part of the temporal pole suddenly exhibit a low voltage rapid discharge after a short period of spikes at the beginning of each seizure (note that these structures are thought to belong to the network characterizing the epileptogenic zone in this patient). The duration of ictal discharges measured in the ten patients was found to vary from 5 to 17 seconds (mean: 9.3 sec, standard deviation: 3.4 sec).
Signal average power and average r2 were then computed and represented as histograms for the three retained sites. Consequently, in each patient, a set of six histograms was produced: one histogram per SEEG signal displaying the relative average power per sub-band and one histogram per pair of SEEG signals displaying the average r2 value per sub-band. Visual analysis of results shown in figure 4 leads to two major remarks. First, as far as signal power per sub-band is concerned, one may notice that the distribution of power strongly varies as a function of the pre-ictal/ictal period. For most patients, before discharge (BD period), average power mainly distributes in lowest frequency bands (θ, α). In some cases, significant power may also be observed in higher sub-bands (β and Γ) often associated with a typical electrical pattern corresponding to nested rhythms (spikes in the θ band mixed with short rapid discharges in the β/Γ band) that occur just before the low voltage rapid discharge (patient TAL, signals recorded on electrodes TR, leads 7–8 and AC, leads 7–8 - see figure 1 legend for details about the meaning of electrode names and the numbering of electrode leads -). During the discharge (D period), average power becomes dominant in sub-band Γ. One may notice that this is not surprising since signals were precisely selected on that criterion. Nevertheless, one may notice that in some patients, the relative power in sub-band Γ may be very high (patients POM - FO1-FO2 -, LEG - PA5-PA6 -, BEG - GP′14-GP′15 -, …) denoting a very tonic rapid discharge at the start of seizure. In all patients, power spectral densities measured during the discharge period reveal that observed very fast oscillations are preferentially located in a band going from 60 Hz to 90 Hz (see example in figure 2). After the discharge (AD period), power distribution returns to more standard values with a strong decrease in sub-band Γ.
Figure 4.
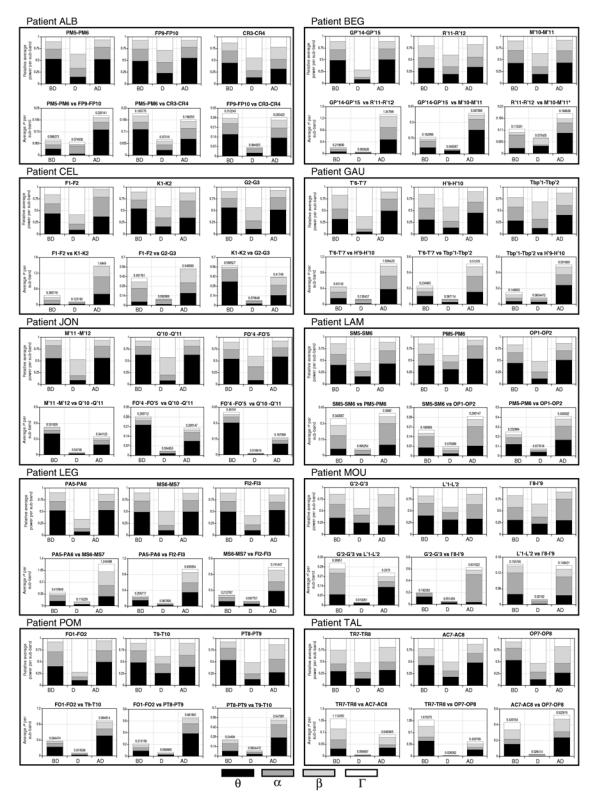
Relative power and spatio-temporal correlations measured in the ten studied patients. In all patients, power distribution changes as a function of the considered period (upper frequency band Γ becomes predominant during the low voltage rapid discharge). In all patients, r2 values estimated over the discharge period are lower than those measured before and after this period, denoting the appearance of a spatial decorrelation.
Second, as far as correlation values are concerned, the most striking observation is related to the strong decrease of the average r2 coefficient during the discharge. Indeed, for all patients, the height of the second histogram column (corresponding to the discharge period) is far lower than the two other columns, indicating a marked decorrelation between SEEG signals while the exhibit fast activity (low voltage rapid discharge). For patients in whom more than three distinct regions are involved in rapid ictal activity, computed values lead to similar observation. Moreover, in half of the patients, r2 values measured over the AD period are higher than those measured over the BD period indicating that spatial correlations after the discharge may strengthen once the rapid discharge vanishes.
A statistical analysis of estimated average r2 values was then conducted in order to know whether their distribution over the three period significantly differ. Statistical results are presented in figure 5. First, r2 values were summed over the frequency band in order to build a global indicator of the spatial correlation (independent from the frequency band). Figure 5-a displays the thirty summed r2 values obtained in the ten patients for the three retained pairs of signals. As visually determined from histograms (figure 4), values corresponding to the discharge period are lower than those estimated over the two other periods, and values corresponding to the BD period seem higher than those obtained for the AD period. In order to statistically test these observed mean differences, values were normalized, as described in §2.3. The empirical distribution of normalized r2 values, shown in figure 5-b, may be assumed to be Gaussian. A conventional t-test was then performed to measure the significance of observed differences of mean. As shown in figure 5-d, the small numerical value of the significance (p-value) is far less than 0.01 indicating that measured correlations during the D period are statistically lower than those measured during the two other periods. The same remark also applies for the comparison of values obtained during the BD and AD periods. Finally, a one-way analysis of variance was performed using a standard tool of numerical analysis (Matlab’s anova routine, statistics toolbox). Results, displayed in figure 5-c in the form of a so-called “boxplot”, confirm those obtained with the t-test. The lower and upper lines of each “box” (25th and 75th percentiles of each sample) and the line in the middle of the box (sample median) respectively indicate that the distribution of r2 values during the discharge (D period) is narrower and that its mean is lower than the two other distributions. The “whiskers” (lines extending above and below the box) show the extent of the rest of the sample. Of interest is the presence of outliers (defined as values that are greater than 1.5 times the interquartile range away from the top or bottom of the box) in the three distributions (2 outliers for the BD period, 3 outliers for the D period and 1 outlier for the AD period). Indeed, in patient TAL, correlation values measured before discharge (BD) are significantly higher than those measured in the other patients. In the same patient, two correlation values measured during the discharge (D), are lower than those (already low) measured in other patients. On the opposite, in patient ALB, a value is slightly higher than those obtained elsewhere meaning that for one pair of distinct sites (PM5-PM6 vs FP9-FP10) decorrelation is less marked, but still remaining statistically lower than those obtained on the BD and AD periods, as in other patients. Finally, in patient GAU a statistically higher correlation value is observed over the AD period. In summary, for patients TAL and GAU, the presence of outliers denote a desynchronization/synchronization mechanism more marked than that observed in other patients.
Figure 5.
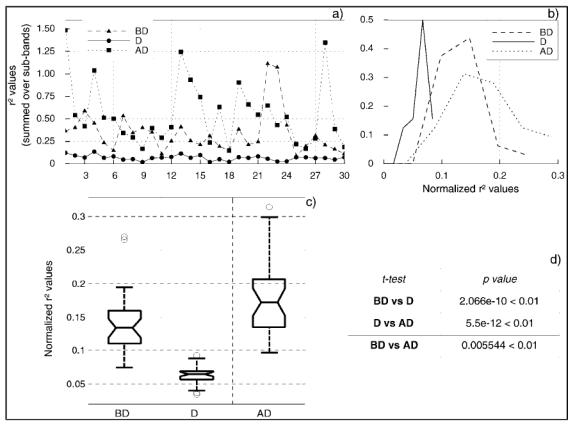
Results of statistical analysis performed to test the significance of the observed decrease of correlation values measured during the discharge period. a) r2 values summed over the frequency bands are first normalized in order to make their distribution as Gaussian (b) before performing statistical tests. c) Boxplot and d) t-test performed on normalized values demonstrate that r2 values measured during the discharge are significantly lower than those measured before and after and values measured after the discharge are significantly higher than those measured before discharge (see text for details about the interpretation of boxplot features in the studied context).
The notches in boxes graphically show the confidence interval (95%) about the median of each distribution. The fact that they do not intersect indicates that means significantly differ from period to period: r2 values measured during the discharge are lower than those measured before and after and values measured after the discharge are higher than those measured before discharge.
4. Discussion
Results show that correlation between SEEG signals recorded from distinct neural structures and exhibiting a low voltage rapid discharge (very fast oscillations) at seizure onset is dramatically lower than the correlation measured over periods that come before and after this discharge. This observation deserves to be discussed from several viewpoints.
First, from the signal analysis viewpoint, spatial correlations (in a general sense) estimated using various available methods (coherence, linear and nonlinear regression, mutual entropy, mutual prediction, …) can be related to functional couplings between brain sites that generate signals (paradigm). For the two last decades, this type of analysis led to relevant results not only in the field of epilepsy but also in the field of perception/cognition. Along this line, the observed decorrelation reported in this study would be interpreted as an abnormal decoupling between recorded distant sites at seizure onset. To our knowledge, this concept of “disruption” has received less attention than the concept of “hyperactivation” revealed by significantly high correlations between signals recorded in epileptogenic zone (Bartolomei et al. 2002). Both concepts could be operative in analyzing pathophysiology in human epileptic seizures.
Second, in all patients, the rapid ictal discharge quasi-simultaneously involves distant and functionally distinct brain sites as it could exist a “synchronizing system” that gives rise to simultaneous start of fast activity. After a few hundred of milliseconds, once the rapid discharge is running, spatial correlation significantly decreases as if brain sites involved in very fast oscillations would be desynchronized. This observation refers back to old debates about EEG correlates of sleep-waking cycles. Desynchronization associated with arousal was considered as resulting from the activation of ascending reticular projections to the cortex. By analogy with this physiological situation, Jasper interpreted EEG flattening (closely related to low-voltage rapid discharge as discussed in (Bancaud et al. 1973)) as conveying neuronal desynchronization. However, no basic mechanism of epilepsy available at this time agreed in favor of this hypothesis. Current concepts were based on hyperexcitability, paroxysmal depolarizing shift (PDS) and hypersynchrony on the one hand, alteration of inhibition on the other hand (Delgado-Escueta et al. 1999). But the question of synchronization/desynchronization of larger neuronal pools was not the object of the basic studies. So, the present paper puts back desynchronization as a central question.
Third, from a neurophysiological viewpoint, we noticed that very fast oscillations observed at seizure onset are mainly located in the 60–90 Hz band which is actually higher than the actual EEG gamma band, classically defined between 24 and 80 Hz. This may lead to establish a link between observed fast oscillations and two other types of fast oscillations, respectively termed “ripples” (80–200 Hz, occurring during normal processes) and “fast ripples” (200–500 Hz, occurring in epileptogenic tissue). Indeed, although the duration of observed fast oscillations (5–15 sec) at seizure onset is far higher than that of ripples (a few hundred of msec), both share common features. First, recent study reported in (Grenier et al. 2001) shows that ripples i) may appear almost simultaneously in different cortical sites and ii) are uncorrelated among different gyri (but correlated among sites within the same gyrus). Second, results from Bragin et al. (1999) suggest that the fast ripple is unique to tissue capable of generating seizures, in human epileptic brain and in kainic acid-treated rat. Of course, we can not determine if such oscillations are also present in our observations since the sampling frequency of our recording system is only 256 Hz. However, in both case, recordings are performed from epileptogenic regions. Third, the aforementioned studies and several other studies show that inhibitory interneurons may play a role in the patterning of neocortical ripples as well as in the generation of epileptic very fast oscillations. For example, results described in (Penttonen et al. 1998) suggest that rapid discharges reflect rhythmic post-synaptic potentials in pyramidal cells brought about by rhythmically discharging somatic-projecting inhibitory interneurons.
According to authors’ in vivo studies, few presynaptic inhibitory interneurones are sufficient to impose a gamma rhythm on pyramidal neurones and time the occurrence of their action potentials. We also reported similar results on high-frequency EEG activities using new computational macroscopic model of EEG activity that includes a physiologically relevant fast inhibitory feedback loop representing the role of somatic-projecting interneurons (Wendling et al. 2002). We showed that strikingly realistic fast oscillations are produced by the model when compared to real depth-EEG epileptic signals recorded with intracerebral electrodes. Moreover, in a comprehensive study about spike-wave complexes and fast components of cortically generated seizures (a series of four papers), Steriade and colleagues (1998) reported corroborative data on fast runs (that are not exactly in the gamma band since their frequency range is 12–15 Hz) observed at the onset of cortical seizures. Authors underline that i) short-lasting inhibitory processes may survive during fast runs as shown by IPSPs occurring during the depolarizing plateau in which paroxysmal fast runs appear and action potentials are inactivated and that ii) intracortical excitation overwhelms inhibitory processes which is an effective factor in depolarizing large populations of cortical neurons. From these results, we can thus hypothesize that the observed signal decorrelation during fast activity may be the consequence of a local sustained discharge of inhibitory interneurons onto pyramidal cells reflected, at the EEG level, by an activity located in a relatively wide high-frequency band and spatially decorrelated from one site to another.
Another natural question is raised from the results: how does epileptic fast activity relate to cognitive gamma activity ? To us, very fast oscillations encountered in low-voltage rapid discharges constitute a characteristic electrophysiological pattern of human partial epilepsy and are pathological as opposed to gamma oscillations recorded during normal cognitive tasks. The first argument is related to frequency. As mentioned above, frequency band of observed epileptic fast oscillations ranges from 60 to 90 Hz. These values are actually higher than those classically associated to cognitive gamma activity. The second argument is that recorded epileptic rapid discharges may last up to 10 seconds which is not the case for cognitive gamma.
This point is also discussed in (Traub 1999) who gives a classification of types of in vivo gamma oscillations as spontaneous, induced, evoked, emitted and epileptic and who gives another argument: epileptic gamma oscillations are encountered in cerebral structures that do not normally generate this type of activity. For example, gamma-frequency population spikes have not been recognized in vivo in the hippocampus as a spontaneously occurring event as opposed to following repetitive stimulation or drug application. This point is particularly important because the main difference between normal gamma oscillations and epileptic very fast oscillations could reside in the fact that the former are coherent or synchronous (between involved brain areas) whereas the latter are uncoherent or desynchronized.
Finally, we will discuss the reported observation with respect to clinical signs that are observed in the patient behavior at the start and during seizures involving rapid discharges. The fact that the observed signal decorrelation can be related to a sudden functional decoupling that occurs at seizure onset may influence the way we interpret clinical semiology. Indeed, coherent fast activity has been postulated to be a way for the brain to process and integrate information. Any interruption of this coherence would then result in the break-up of cerebral cortex processing leading, for instance, to the release of altered cognition and/or behaviour as observed in epileptic patients during seizures. A related concept has been proposed a long time ago for the dreamy state by JH Jackson (in Taylor et al. 1996) who postulated three hierarchical levels of consciousness, progressively impaired according to seizure spread. In such a conception, the fast discharge would lead to a loss of highest functions of the highest level, releasing the second level which is physically conscious and which produces the dreamy state: “the disease places ‘hors de combat’ ” certain nervous elements or regions of the highest centers so that “not only illusions but all positive mental symptoms […] are the outcome of activity of lower, non-diseased nervous arrangements of these highest centres”. We suggest that Jackson’s conception might certainly be extended to other types of symptoms and signs. Consequently, clinical symptoms such as automatisms or forced acting would also correspond to the activation of centers liberated from the control of highest centers impaired by fast epileptic activities.
References
- Alarcon G, Binnie CD, Elwes RD, Polkey CE. Power spectrum and intracranial EEG patterns at seizure onset in partial epilepsy. Electroencephalogr Clin Neurophysiol. 1995;94(5):326–37. doi: 10.1016/0013-4694(94)00286-t. [DOI] [PubMed] [Google Scholar]
- Allen PJ, Fish DR, Smith SJ. Very high-frequency rhythmic activity during SEEG suppression in frontal lobe epilepsy. Electroencephalogr Clin Neurophysiol. 1992;82(2):155–162. doi: 10.1016/0013-4694(92)90160-j. [DOI] [PubMed] [Google Scholar]
- Bancaud J, Talairach J, Geier S, Scarabin JM. EEG et SEEG dans les tumeurs cérébrales et l’épilepsie. Edifor; Paris: 1973. [Google Scholar]
- Bancaud J. Stereoelectroencephalography, Handbook of electroencephalography and clinical neurophysiology. 10(B) Elsevier; Amsterdam: 1974. pp. 10B-3–10B-60. [Google Scholar]
- Bancaud J, Brunet-Bourgin F, Chauvel P, Halgren E. Anatomical origin of deja vu and vivid ‘memories’ in human temporal lobe epilepsy. Brain. 1994;117:71–90. doi: 10.1093/brain/117.1.71. [DOI] [PubMed] [Google Scholar]
- Bullock TH, McClune MC, Achimowicz JZ, Iragui-Madoz VJ, Duckrow RB, Spencer SS. EEG coherence has structure in the millimeter domain: subdural and hippocampal recordings from epileptic patients. Electroencephalogr Clin Neurophysiol. 1995;95(3):161–77. doi: 10.1016/0013-4694(95)93347-a. [DOI] [PubMed] [Google Scholar]
- Bartolomei F, Wendling F, Vignal JP, Kochen S, Bellanger JJ, Badier JM, Le Bouquin-Jeannes R, Chauvel P. Seizures of temporal lobe epilepsy: identification of subtypes by coherence analysis using stereo-electro-encephalography. Clin Neurophysiol. 1999;110(10):1741–54. doi: 10.1016/s1388-2457(99)00107-8. [DOI] [PubMed] [Google Scholar]
- Bartolomei F, Wendling F, Vignal JP, Chauvel P, Liégeois-Chauvel C. Neural networks underlying epileptic humming. Epilepsia. 2002;43(9):1001–12. doi: 10.1046/j.1528-1157.2002.48501.x. [DOI] [PubMed] [Google Scholar]
- Bendat JS, Piersol AG. Random data: analysis and measurement procedures. Willey-Interscience; 1971. [Google Scholar]
- Bragin A, Engel J, Jr, Wilson CL, Fried I, Mathern GW. Hippocampal and entorhinal cortex high-frequency oscillations (100–500 Hz) in human epileptic brain and in kainic acid--treated rats with chronic seizures. Epilepsia. 1999;40(2):127–37. doi: 10.1111/j.1528-1157.1999.tb02065.x. [DOI] [PubMed] [Google Scholar]
- Delgado-Escueta AV, Wilson WA, Olsen RW, Porter RJ, editors. Jasper’s basic mechanisms of the epilepsies. 3. Philadelphia: Lippincott Williams & Wilkins; 1999. [Google Scholar]
- Duckrow RB, Spencer SS. Regional coherence and the transfer of ictal activity during seizure onset in the medial temporal lobe. Electroencephalogr Clin Neurophysiol. 1992;82(6):415–22. doi: 10.1016/0013-4694(92)90046-k. [DOI] [PubMed] [Google Scholar]
- Fisher RS, Webber WR, Lesser RP, Arroyo S, Uematsu S. High-frequency EEG activity at the start of seizures. J Clin Neurophysiol. 1992 Jul;9(3):441–8. doi: 10.1097/00004691-199207010-00012. [DOI] [PubMed] [Google Scholar]
- Grenier F, Timofeev I, Steriade M. Focal synchronization of ripples (80–200 Hz) in neocortex and their neuronal correlates. J Neurophysiol. 2001;86(4):1884–98. doi: 10.1152/jn.2001.86.4.1884. [DOI] [PubMed] [Google Scholar]
- Jackson JH. In: Selected Writings. Taylor J, Holmes G, Walshe FMR, editors. Nijmegen: Arts and Hoeve; 1996. [Google Scholar]
- Mackenzie L, Medvedev A, Hiscock JJ, Pope KJ, Willoughby JO. Picrotoxin-induced generalised convulsive seizure in rat: changes in regional distribution and frequency of the power of electroencephalogram rhythms. Clin Neurophysiol. 2002;113(4):586–96. doi: 10.1016/s1388-2457(02)00040-8. [DOI] [PubMed] [Google Scholar]
- Menon V, Freeman WJ, Cutillo BA, Desmond JE, Ward MF, Bressler SL, Laxer KD, Barbara N, Gevins AS. Spatio-temporal correlations in human gamma band electrocorticograms. Electroencephalogr Clin Neurophysiol. 1996;98(2):89–102. doi: 10.1016/0013-4694(95)00206-5. [DOI] [PubMed] [Google Scholar]
- Niedermeyer E, Lopes Da Silva FH. Electroencephalography: Basic Principles. In: Ernest Niedermeyer, Fernando Lopes Da Silva., editors. Clinical Applications, and Related Fields. 4. Lippincott: Williams & Wilkins; 1998. [Google Scholar]
- Panzica F, Franceschetti S, Binelli S, Canafoglia L, Granata T, Avanzini G. Spectral properties of EEG fast activity ictal discharges associated with infantile spasms. Clin Neurophysiol. 1999;110(4):593–603. doi: 10.1016/s1388-2457(98)00031-5. [DOI] [PubMed] [Google Scholar]
- Penttonen M, Kamondi A, Acsady L, Buzsaki G. Gamma frequency oscillation in the hippocampus of the rat: intracellular analysis in vivo. Eur J Neurosci. 1998;10(2):718–28. doi: 10.1046/j.1460-9568.1998.00096.x. [DOI] [PubMed] [Google Scholar]
- Pijn JP. Quantitative evaluation of EEG signals in epilepsy, nonlinear associations, time delays and nonlinear dynamics, PhD Thesis. University of Amsterdam; Amsterdam: 1990. [Google Scholar]
- Hamming RW. Digital Filters. 3. Dover Publications; 1998. [Google Scholar]
- Repucci MA, Schiff ND, Victor JD. General strategy for hierarchical decomposition of multivariate time series: implications for temporal lobe seizures. Ann Biomed Eng. 2001;29(12):1135–49. doi: 10.1114/1.1424914. [DOI] [PubMed] [Google Scholar]
- Steriade M, coll Spike-wave complexes and fast components of cortically generated seizures. I to IV. J Neurophysiol. 1998;80(3):1439–1513. doi: 10.1152/jn.1998.80.3.1439. [DOI] [PubMed] [Google Scholar]
- Talairach J, Bancaud J, Szickla G, Bonis A, Geier S. Approche nouvelle de la chirurgie de l’épilepsie: methodologie stéréotaxique et résultats thérapeutiques. Neurochirurgie. 1974;20(supp 1):1–240. [PubMed] [Google Scholar]
- Tallon-Baudry C, Bertrand O, Peronnet F, Pernier J. Induced gamma-band activity during the delay of a visual short-term memory task in humans. J Neurosci. 1998;18(11):4244–54. doi: 10.1523/JNEUROSCI.18-11-04244.1998. [DOI] [PMC free article] [PubMed] [Google Scholar]
- Traub RD, Jefferys JGR, Whittington MA. Fast Oscillations in Cortical Circuits. MIT PRESS; 1999. [Google Scholar]
- Wendling F, Bartolomei F, Bellanger JJ, Chauvel P. Epileptic fast activity can be explained by a model of impaired GABAergic dendritic inhibition. Eur J Neurosci. 2002;15(9):1499–508. doi: 10.1046/j.1460-9568.2002.01985.x. [DOI] [PubMed] [Google Scholar]
- Zaveri HP, Williams WJ, Sackellares JC, Beydoun A, Duckrow RB, Spencer SS. Measuring the coherence of intracranial electroencephalograms. Clin Neurophysiol. 1999;110(10):1717–25. doi: 10.1016/s1388-2457(99)00136-4. [DOI] [PubMed] [Google Scholar]