Abstract
DNA charge transfer highly depends on the electronic interaction between base pairs and reflects the difference in the base composition and sequence. For the purpose of investigating the charge transfer process of individual DNA molecules and the optical readout of DNA information at the single-molecule level, we performed single-molecule observation of the DNA charge transfer process by using single-molecule fluorescence spectroscopy. The DNA charge transfer process, leading to the oxidation of the fluorescent dye, was explored by monitoring the on–off signal of the dye after the charge injection by the excitation of a photosensitizer. The photobleaching efficiency of the dyes by the DNA charge transfer specifically depended on the base sequence and mismatch base pair, demonstrating the discrimination of the individual DNA information. Based on this approach, the optical readout of a single-base mismatch contained in a target DNA was performed at the single-molecule level.
Keywords: electron transfer, single-molecule fluorescence, SNP detection
The π-stacked array of base pairs in DNA double strands mediates the charge transfer (1). The enormous interest in DNA-mediated charge transfer has been spurred by its biological role in the cellular process (2, 3) and the development of DNA-based electrochemical devices, while the mechanism and dynamics of the charge-transfer process through DNA continue to attract much attention because of the general interest in understanding electron-transfer chemistry in the π-stacked array system (4–10).
The positive charge generated by the one-electron oxidation of a nucleobase has been shown to migrate over long distances (more than a few tens of nanometers) through the DNA duplex (11, 12). At present, the multistep hopping mechanism as a simplified model, in which the guanine (G) and adenine (A) residues work as charge carriers behaving like a stepping stone, has been widely accepted (13, 14). In this proposed mechanism, a positive charge is localized on the G residues that have the lowest oxidation potential [the trend in oxidizablity for DNA nucleobases has been established to be G < A < T, C (15, 16)] and migrates to the neighboring G via a superexchange interaction (G-hopping). When the next G is separated by more than four A/T base pairs, the charge is carried by the bridging A bases (A-hopping). These two hopping processes allow the charge to migrate with an extremely shallow distance dependence. As an alternative mechanism, gated hopping, in which the charge is transiently delocalized over several base pairs defined by the local structure and sequence, has been proposed (17).
The important characteristics of DNA charge transfer is that the efficiency and rates of the charge transfer are highly sensitive to the structural perturbations in the sequence containing single-base mismatches or the changes in the electronic states induced by protein binding (18–20). In this context, the biosensors based on the principle of DNA charge transfer have potential applications ranging from mutation detection to pathogen identification. Actually, an electrochemical DNA biosensor based on charge transfer properties has been established to detect the mismatches and base lesions involved in the target DNA (21, 22).
Single-molecule spectroscopy has been extensively used to characterize biophysical systems, including protein folding, enzymatic dynamics, and ligand–receptor interactions, and chemical reaction, because these techniques are especially well suited for revealing the dynamics and mechanistic behavior obscured by ensemble averaging in conventional spectroscopic techniques (23–26). Particularly, single-molecule FRET is a powerful technique for studying the conformational distribution and dynamics of RNA folding or the unique structures of DNA (27–29). Another important aspect of single-molecule fluorescence spectroscopy is that it can be applied to the single-molecule optical readout (30, 31).
So far, although single-molecule spectroscopy provides a unique and powerful tool for studying biophysical processes, this technique has not been applied to DNA charge transfer chemistry. A highly sensitive optical readout to interrogate an individual DNA molecule is made possible through the combination of DNA charge transfer chemistry and single-molecule spectroscopy. The key issue is transforming the DNA charge transfer events into optically detectable signals. We now describe a strategy for the observation of the charge transfer process in DNA at the single-molecule level using total internal reflection fluorescence microscopy. The photobleaching of the fluorescent dyes attached to DNA on the glass surface was observed as the optical response to the charge transfer process. We also found that the mismatch base pair significantly suppressed the photobleaching efficiency of the dyes, allowing one to identify the mismatch from single DNA molecules.
Results and Discussion
DNA Charge Transfer Detection System.
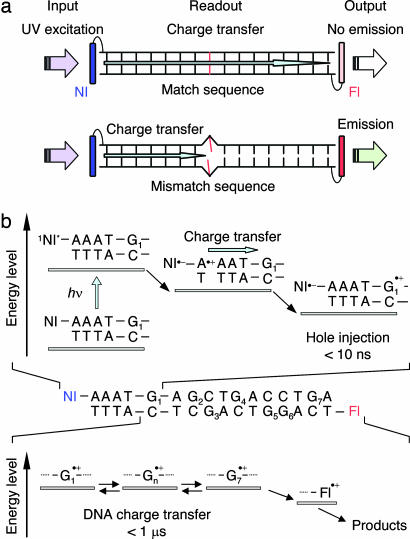
The DNA charge transfer detection system based on a fluorescence signal change from the fluorescent dyes is schematically shown in Fig. 1a. The positive charge injection molecule, i.e., the photosensitizer, and the reporter fluorescence molecule are attached at the both ends of the DNA. A charge is injected into the DNA by excitation of the photosensitizer, migrates through the DNA π-stack, and finally arrives at the reporter molecule if the oxidation potential of the fluorophore is lower than that of the nucleobases. As a result, the reporter fluorescent dye is undergoing irreversible chemical transformation by the DNA charge transfer. On the contrary, in the presence of a mismatch base pair in DNA, the charge transfer is prohibited because the mismatch site causes a disruption of base stacking and a striking decrease in electronic interactions through π-stacking. As a result, the reporters are protected from oxidation and remain emissive. Accordingly, by monitoring the fluorescence signal response from the reporter fluorescence dyes, we can explore the charge transfer process and the presence of mismatched base pairs in DNA.
Fig. 1.
DNA charge transfer detection system. (a) Photobleaching of the fluorescent dyes by DNA charge transfer. The NI and fluorescent dye (Fl) are represented by blue and red, respectively. The fluorescent dye is oxidized when the charge can freely migrate through DNA, leading to the photobleaching of the dyes. In the presence of the mismatch site, the charge transfer to the dyes is inhibited. (b) The positive charge injection (hole) process via A-hopping and the following charge transfer to the reporter fluorophore. Excitation of NI by UV light generates NI in the singlet excited state, which oxidizes the adjacent A base to give the contacted ion pair. The positive charge on the A base escapes from the ion pair and migrates to the nearest G through hopping between A bases to provide the charge separated state with a long lifetime. The hole injected into DNA migrates to the fluorescent dye, leading to the irreversible reaction of the reporter fluorophore.
For the purpose of observing the DNA charge transfer process using the fluorescence signal response, we designed the DNA conjugates shown in Fig. 1 and Table 1. Naphthalimide (NI), which is well known to be a strong oxidant in its singlet excited state (Ered = 2.4 eV) and can oxidize the neighboring bases, was selected as the charge injection molecule (32). Fluorescent dyes, 6-carboxytetramethylrhodamine (TMR) or Alexa Fluor 532 (AF), were used as the reporter fluorescent dyes because they have high fluorescence quantum yields and a photostability that enable us to use them for single-molecule spectroscopy. Previously, we reported that NI can efficiently inject a positive charge into DNA by UV irradiation (33). The charge injection mechanism (charge separation process between NI and G) after excitation of the NI site and the following charge transfer to the fluorescent dye are shown in Fig. 1b. NI is a strong enough oxidant to oxidize the nearest A base (Eox = 1.46 V vs. NHE). The contact ion pair between NI and an adjacent A base is initially generated by photoexcitation, and a part of the charge escapes from the ion pair and then is trapped at the G to provide a long-lived charge separated state between NI and G (34). The charge separated state persists for a few microseconds when NI and G are separated by four A bases, making it possible for the charge to freely migrate to the fluorescent dye through DNA in a submicrosecond time scale (5, 35). Although the binding mode of the fluorescent dyes to DNA is ambiguous, the charge transfer can occur as long as the dyes are close to the nucleobases (36).
Table 1.
DNA sequences used in this study
| DNA | Sequence |
|---|---|
| A4-1 | NI-AAATGAGCTGACCTGA |
| BT-TTTACTCGACTGGACT-Fl | |
| A4-2 | NI-AAAT-A-AGCTGACCTGA |
| BT-TTTA-C-TCGACTGGACT-Fl | |
| A4-3 | NI-AAATGAGCT-A-ACCTGA |
| BT-TTTACTCGA-C-TGGACT-Fl | |
| A4-4 | NI-AAATGAGCTGACCT-A-A |
| BT-TTTACTCGACTGGA-C-T-Fl | |
| A4-5 | NI-AAATGAGCT-T-ACCTGA |
| BT-TTTACTCGA-C-TGGACT-Fl | |
| A3-1 | NI-AATGAGCTGACCTGA |
| BT-TTACTCGACTGGACT-Fl |
NI and Fl represent naphthalimide and fluorescent dyes (TMR or AF) attached to the 5′ end of DNA, respectively. BT (biotin) is attached at the 3′ end of Fl-conjugated DNA. Single-base mismatches in the sequence are shown in bold.
Fluorescence Changes of Fluorescent Dyes in the Ensemble System by DNA Charge Transfer.
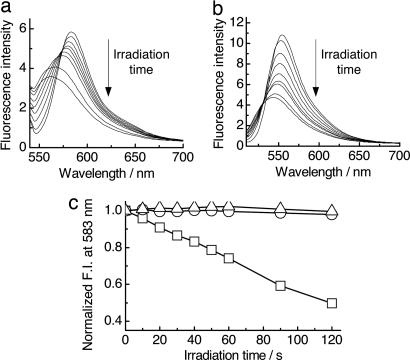
The photobleaching of fluorescent dyes by the DNA charge transfer upon UV irradiation was investigated by steady-state fluorescence measurements. Fig. 2 shows the fluorescence spectral changes in the dyes after the UV irradiation. The fluorescence intensity for A4-1-TMR gradually decreased along with the slight blue shift in the emission maximum as the irradiation time increased, demonstrating that dyes lost their fluorescent properties by the DNA charge transfer. The fluorescence spectral shifts indicate that the oxidized form of TMR is also emissive, but weak.
Fig. 2.
Observation of DNA charge transfer by steady-state fluorescence measurements. (a and b) Steady-state fluorescence spectra obtained for A4-1-TMR (a) and A4-1-AF (b) after irradiation by UV lamp. Sample solutions contain 100 nM DNA in 20 mM sodium phosphate buffer (pH 7.0) and 100 mM NaCl. (c) Fluorescence intensity changes monitored at 583 nm for A4-1-TMR as a function of irradiation time for DNA modified with NI and TMR (□), DNA modified with only TMR (○), and a mixture of DNA, one NI-conjugated DNA, and the other DNA modified with TMR but without NI (▵).
Similar spectral changes were observed for the AF-conjugated DNA (A4-1-AF) although the oxidation products of AF showed a very weak emission compared with that of TMR, indicating that other fluorescent dyes could be used for this system as long as they have an oxidation potential lower than G. This approach would be applied to the convenient charge transfer detection. The apparent photobleaching efficiency by UV irradiation for A4-1-AF is somewhat higher than that for A4-1-TMR when compared at the maximum peaks of emission (583 nm for TMR and 555 nm for AF). The charge injection efficiency in this system depends on the number of A bases between NI and G, and the charge transfer efficiency from DNA to the fluorescent dye is quantitative because the trapping of the charge by water or molecular oxygen is not rapid enough to be competitive with the charge transfer in this sequence (5). Considering these facts, the fluorescent dyes attached to the opposite end of the DNA should quantitatively accept the generated charge. Accordingly, the differences in the apparent photobleaching efficiency would be caused by the emissive properties of the oxidation products.
Control experiments were performed to confirm that we can rule out the effect of the direct excitation of the dyes by UV light and the intermolecular oxidation process on the fluorescence change (Fig. 2c). The dye decomposition by direct irradiation was not observed in the DNA lacking NI. Similarly, a mixture of DNA, one NI-conjugated DNA and the other DNA modified with TMR lacking NI, showed no fluorescence spectral changes, indicating that the intermolecular charge transfer, i.e., oxidation of the fluorescent dyes, was ineffective. In addition, singlet oxygen generation by energy transfer from NI in the excited state to molecular oxygen can be excluded because the formation of the contact ion pair occurs in the picosecond time scale, which is much faster than intermolecular energy transfer process (34). From these facts, we confirmed that the fluorescence spectral changes of the dyes were induced by the DNA charge transfer [see supporting information (SI) Text and SI Fig. 6].
Observation of DNA Charge Transfer at the Single-Molecule Level.
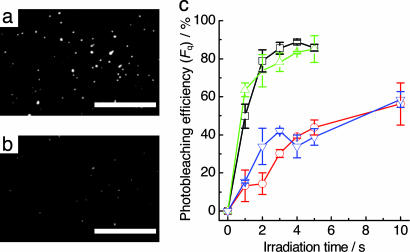
Observations of single-molecule fluorescence were carried out with a conventional microscope equipped with total internal reflection illumination, which reduces background fluorescence. The DNA charge transfer process was observed at the single-molecule level from the optical response of the fluorescent dyes after the charge injection by photoirradiation. A DNA-modified surface was prepared through the biotin–streptavidin linkage, which is well established and used for single-molecule experiments. Biotinylated ssDNA probes with a fluorescent dye at the 5′ end of DNA were immobilized on the glass surface and hybridized with the complementary NI-conjugated DNA. The hybridization efficiency was estimated to be >80% under our experimental conditions (see SI Figs. 7 and 8). Fig. 3 shows the single-molecule fluorescence images for A4-1-TMR before and after the UV irradiation. Single DNA molecules appear as bright spots in the images, which correspond to the fluorescent signal from one TMR molecule (Fig. 3a). Upon irradiation by the UV lamp, the bright spots on the surface significantly disappeared (Fig. 3b). Control experiments showed no noticeable photobleaching of the fluorescent dyes by the intermolecular oxidation process or direct excitation of the dyes (see SI Fig. 9), confirming that the fluorescence from the dyes attached to the DNA was quenched through an intramolecular process. Some bright spots became weak upon UV irradiation, indicating that the dyes were oxidized to provide the weak fluorescent products as observed in the steady-state fluorescent measurements. These results provide clear evidence that the DNA charge transfer can be identified from the optical response of the fluorescent dye at the single-molecule level.
Fig. 3.
Single-molecule observation of DNA charge transfer. (a and b) Single-molecule fluorescence images for A4-1-TMR immobilized on glass surface before (a) and after (b) UV irradiation for 2 s. (Scale bars: 10 μm.) (c) Photobleaching efficiency (Fq) for A3-1-TMR (red), A3-1-AF (blue), A4-1-TMR (black), and A4-1-AF (green) as a function of irradiation time. The photobleaching efficiency is defined by Fq, where Fq = 1 − N/N0, and N0 and N are the number of bright spots before and after irradiation, respectively.
The photobleaching efficiency of the fluorescent dyes for the lifetime of the charge separated state was investigated by single-molecule spectroscopy (Fig. 3c). The value of the efficiency Fq (defined by the equation, 1 − N/N0, where N0 and N are the number of bright spots before and after UV irradiation, respectively) obtained for A4-1-TMR is almost three times higher than that for A3-1-TMR, which is consistent with the lifetime of the initial charge separated state. Previously, we reported that the lifetime of the charge separated state between NI and G separated by A3 and A4 was 300 ns and 2.2 μs, respectively (35, 37). In the A4-1 duplexes, in which NI and the nearest G are separated by four intervening A residues, the charge recombination between the NI radical anion and G radical cation is slower than the charge transfer process, leading to the efficient photobleaching of the dyes. The relationship between the rate of charge recombination and charge transfer was closely related to the photobleaching efficiency, indicating that the sequence information of an individual DNA molecule can be obtained from single-molecule spectroscopy.
A Single-Base Mismatch Detection by Single-Molecule Fluorescence Spectroscopy.
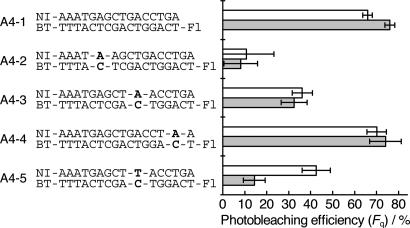
A single-base mismatch incorporated into DNA, causing a local structural perturbation, is known to suppress charge transfer efficiency (18). To investigate the photobleaching efficiency (Fq) for matched and mismatched DNA, we designed DNA possessing the A-C mismatch at different positions (A4-2, A4-3, A4-4) and the T-C mismatch in the middle of the DNA strand (A4-5) (Table 1). Compared with the fully matched DNA (A4-1), the photobleaching of the fluorescent dyes for A4-2, in which an A-C mismatch was incorporated near NI, was drastically suppressed (Fig. 4 and SI Fig. 10). This result clearly suggests that a single base mismatch incorporated into the region, which is closely related to the charge injection efficiency, enhances the mismatch effect on the DNA charge transfer. Similarly, the suppression by the mismatch base pairing was observed when the AC (A4-3) or TC mismatches (A4-5) were added in the middle of DNA, but it is not as effective as that for A4-2. It should be noted that the mismatch base pair significantly slows, but does not stop the DNA charge transfer. The value of Fq is determined by the relationship between the rate constants of charge recombination and charge transfer. In A4-3 and A4-5, as the DNA charge transfer becomes competitive with the charge recombination, the dye bleaching by the DNA charge transfer was not as effective as A4-2. These data emphasize that the single base mismatch can be clearly identified from the fluorescence response of the dyes at the single-molecule level. On the contrary, the A-C mismatch near the fluorescent dye (A4-4) did not change photobleaching efficiency. Considering that the fluorescent dye is attached to the 5′ end of the DNA through the long alkyl chain (C6), it is probable that the dye is positioned near the mismatch site and the direct charge transfer from G to the fluorescent dye occurred over the mismatch site. The inhibitory effect of the mismatch confirms that the bleaching of the fluorescent dye is induced by the DNA charge transfer.
Fig. 4.
Photobleaching efficiency (Fq) obtained for matched and mismatched DNA. DNA duplexes immobilized on glass surfaces were irradiated with UV light for 2 s. The obtained values of Fq for TMR and AF are represented by empty and filled bars, respectively.
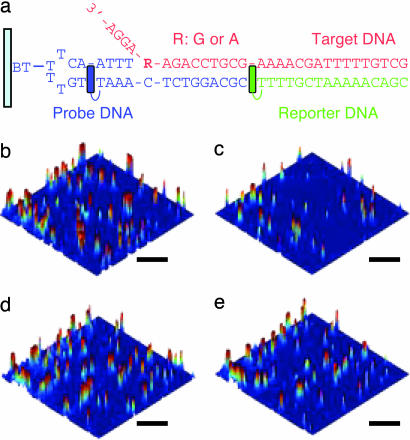
Single-base mismatch detection of the target DNA was performed by using a DNA assembly composed of three strands: probe, reporter, and target DNA (Fig. 5a). The probe DNA possessing NI as the charge injector was immobilized on the glass surface through the biotin–streptavidin linkage, and then hybridized with the target DNA and the TMR-labeled reporter DNA. As a model system, the sequence of BRCA1, which is related to the breast cancer gene, was selected as the target DNA.
Fig. 5.
Single-base mismatch detection. (a) Three-component DNA assembly constructed by probe (blue), reporter (green), and target DNA (red) on a glass surface. NI and TMR are represented by blue and green, respectively. R stands for G or A. (b–e) Fluorescence images obtained for R = G or A before (b and d) and after (c and e) 5 s of UV irradiation. (Scale bars: 5 μm.)
The effect of mismatch base-pairing on the bleaching of the fluorescent dyes was remarkable when it was incorporated into the sequence related to the charge injection efficiency as mentioned above. Hence, the DNA assembly was designed so that a target site (R:G or A) was located in the position next to the continuous A sequence. Typical images of the surface-immobilized DNA assembly were displayed as 3D images for a clearer presentation (Fig. 5 b–e).
In a fully matched DNA (R:G), the remarkable photobleaching of the fluorescent dyes on the surface was observed as shown in Fig. 5, confirming that the charge injection and the following charge transfer to the dyes can occur even in the three-component DNA assembly containing the junction site. The value of Fq after a 5-s irradiation was calculated to be 72 ± 6%. In the mismatched assembly (R:A), as expected, the photobleaching of the dyes was significantly suppressed, and the value of Fq was 34 ± 9%, showing that the charge transfer was indeed inhibited by the mismatch base pairing. The obtained value of Fq for R:A is somewhat higher than that for A4-2. Structural variation at the junction position may contribute to the bleaching of the dyes by the DNA charge transfer, but it is still sufficient to discriminate the target residues.
Conclusions
In this article, we have demonstrated the observation of DNA charge transfer at the single-molecule level using total internal reflection fluorescence microscopy. We found that a charge generated by the excitation of the photosensitizer migrates in DNA and leads to the oxidation of the fluorescent dyes, resulting in the fluorescent signal changes. The bleaching efficiency of the fluorescent dye by the DNA charge transfer depends on the base sequence. Single base mismatches strongly suppressed the bleaching efficiency although it depends on the position in the sequence. The observed mismatch effect allowed us to detect a mutation of the target DNA in the BRCA1 sequence, providing a method to identify the mutation and SNPs from individual DNA molecules by applying DNA chip technology. Moreover, our approach for the single-molecule observation of the DNA charge transfer can be applied to elucidate the function of the DNA charge transfer on the DNA–protein complex and would become a useful method for a better understanding of the biological consequences of the DNA charge transfer.
Materials and Methods
Reagents.
The biotinylated DNA modified with fluorescent dyes (TMR and AF) and amino groups were obtained from Japan Bio Services (Saitama, Japan). Streptavidin and biotinylated-BSA were purchased from Molecular Probes (Carlsbad, CA) and Sigma (St. Louis, MO), respectively.
DNA Synthesis.
Synthesis of DNA modified with NI at the 5′ end was accomplished according to previous reports by using standard β-cyanoethyl phosphoramidite chemistry on a DNA synthesizer (Applied Biosystems, Foster City, CA) (33). Modification of NI inside of DNA was carried out postsynthetically by reaction with the activated N-hydroxysuccinimide ester of NI (NI-NHS). To a 200-μM solution of DNA modified with NH2 through C2 alkyl linker in 100 mM sodium phosphate buffer (pH 8.0) was added 20 mM NI-NHS solution dissolved in DMSO and incubated at room temperature overnight. The reaction mixture was purified by RP-HPLC, and characterized by MALDI-TOF MS; m/z 8,642.0 found for [M-H]−, calculated 8,642.8.
Synthesis of NI Carboxylic Acid N-Hydroxysuccinimide Ester.
N-carboxymethyl-NI (2.0 g, 7.8 mmol) (38) and N-hydroxysuccinimide (0.897 g, 7.8 mmol) were suspended in acetonitrile (60 ml). To this solution, EDCI (1-ethyl-3-(3′-dimethylaminopropyl)carbodiimide, 1.50 g, 7.8 mmol) was added and stirred for 2 h at room temperature. The reaction mixture was evaporated, filtered, and washed with cold acetonitrile twice to provide the white solid (2.1 g, 6.0 mmol, 77%). 1H-NMR (DMSO, 270 MHz) δ 8.55 (m, 4H), δ 7.92 (t, 2H), δ 5.21 (s, 2H), δ 2.80 (s, 4H); fast atom bombardment-MS, m/e (%) found 353 [(M+H)+].
Surface Preparations.
Surface modification with DNA was performed as described (39, 40). Cover glasses were cleaned by sonication in 25% alkaline detergents for a minimum of 3 h. Cover slips were then rinsed many times in Milli-Q water. A cover glass and a glass slide were used to make a sandwich-like channel (volume ≈7–8 μl) using adhesive spacers. A biotinylated BSA solution (1 mg/ml) in Tris buffer (10 mM, pH 7.6) was first introduced into the channel. After incubation for 10 min, the channel was flushed with Tris buffer (20 μl × 2), and streptavidin solution (0.25 mg/ml, 20 μl) was incubated for 10 min. After washing with Tris buffer (20 μl × 2), a biotinylated DNA solution in hybridization buffer (20 mM sodium phosphate buffer, pH 7.0 and 100 mM NaCl) was applied and incubated for 30 min in a humid environment. After stringent washing with hybridization buffer, cDNA (100 nM, 20 μl) was applied to the channel and incubated for 30 min.
Single-Molecule Fluorescence Imaging.
The surface-immobilized DNA was imaged by total internal reflection fluorescence microscopy. The microscopy consisted of an inverted optical microscope (Olympus, Melville, NY), one color laser excitation source (532 nm), and an intensified CCD camera. A frequency-doubled Nd:YAG laser with 25 mW of 532-nm laser light was used to provide the excitation for the TMR- and AF-labeled DNA. The sample cover glass was placed on the inverted microscope. A long-pass fluorescence filter was used to block the excitation light. A 100-μm diameter area was illuminated through an objective lens by a high-pressure Hg lamp fitted with an excitation filter (330–385 nm) for UV-induced photobleaching experiments. A data analysis of the fluorescence image was carried out with Image-J software and a program written by MATLAB (Mathworks, Natick, MA).
Supplementary Material
Acknowledgments
We thank Prof. K. Kawai for valuable discussions and C. Lin and T. Tachikawa for experimental assistance. This work has been partly supported by a Grant-in-Aid for Scientific Research on Priority Area (417), 21st Center of Excellence Research, and the Ministry of Education, Culture, Sports and Science, and Technology of Japan.
Abbreviations
- NI
naphthalimide
- TMR
6-carboxytetramethylrhodamine
- AF
Alexa Fluor 532.
Footnotes
The authors declare no conflict of interest.
This article is a PNAS Direct Submission.
This article contains supporting information online at www.pnas.org/cgi/content/full/0700795104/DC1.
References
- 1.Delaney S, Barton JK. J Org Chem. 2003;68:6475–6483. doi: 10.1021/jo030095y. [DOI] [PubMed] [Google Scholar]
- 2.Boon EM, Livingston AL, Chmiel NH, David SS, Barton JK. Proc Natl Acad Sci USA. 2003;100:12543–12547. doi: 10.1073/pnas.2035257100. [DOI] [PMC free article] [PubMed] [Google Scholar]
- 3.DeRosa MC, Sancar A, Barton JKA. Proc Natl Acad Sci USA. 2005;102:10788–10792. doi: 10.1073/pnas.0503527102. [DOI] [PMC free article] [PubMed] [Google Scholar]
- 4.Barton JK, Carell T, Dohno C, Fiebig T, Geacintov NE, Ito T, Kawai K, Lewis FD, Majima T, O'Neil MP. In: Charge Transfer in DNA: From Mechanism to Application. Wagenknecht A, editor. Germany: Wiley, Weinheim; 2005. pp. 1–223. [Google Scholar]
- 5.Lewis FD, Liu JQ, Zuo XB, Hayes RT, Wasielewski MR. J Am Chem Soc. 2003;125:4850–4861. doi: 10.1021/ja029390a. [DOI] [PubMed] [Google Scholar]
- 6.Giese B. Annu Rev Biochem. 2002;71:51–70. doi: 10.1146/annurev.biochem.71.083101.134037. [DOI] [PubMed] [Google Scholar]
- 7.Lewis FD, Zuo X, Liu J, Hayes RT, Wasielewski MR. J Am Chem Soc. 2002;124:4568–4569. doi: 10.1021/ja0177859. [DOI] [PubMed] [Google Scholar]
- 8.Liu CS, Hernandez R, Schuster GB. J Am Chem Soc. 2004;126:2877–2884. doi: 10.1021/ja0378254. [DOI] [PubMed] [Google Scholar]
- 9.Valis L, Wang Q, Raytchev M, Buchvarov I, Wagenknecht HA, Fiebig T. Proc Natl Acad Sci USA. 2006;103:10192–10195. doi: 10.1073/pnas.0600957103. [DOI] [PMC free article] [PubMed] [Google Scholar]
- 10.Shao FW, Augustyn K, Barton JK. J Am Chem Soc. 2005;127:17445–17452. doi: 10.1021/ja0563399. [DOI] [PubMed] [Google Scholar]
- 11.Henderson PT, Jones D, Hampikian G, Kan Y, Schuster GB. Proc Natl Acad Sci USA. 1999;96:8353–8358. doi: 10.1073/pnas.96.15.8353. [DOI] [PMC free article] [PubMed] [Google Scholar]
- 12.Nunez ME, Hall DB, Barton JK. Chem Biol. 1999;6:85–97. doi: 10.1016/S1074-5521(99)80005-2. [DOI] [PubMed] [Google Scholar]
- 13.Meggers E, Michel-Beyerle ME, Giese B. J Am Chem Soc. 1998;120:12950–12955. [Google Scholar]
- 14.Giese B, Amaudrut J, Kohler AK, Spormann M, Wessely S. Nature. 2001;412:318–320. doi: 10.1038/35085542. [DOI] [PubMed] [Google Scholar]
- 15.Steenken S, Jovanovic SV. J Am Chem Soc. 1997;119:617–618. [Google Scholar]
- 16.Seidel CAM, Schulz A, Sauer MHM. J Phys Chem. 1996;100:5541–5553. [Google Scholar]
- 17.O'Neil MP, Barton JK. J Am Chem Soc. 2004;126:11471–11483. doi: 10.1021/ja048956n. [DOI] [PubMed] [Google Scholar]
- 18.Bhattacharya PK, Barton JK. J Am Chem Soc. 2001;123:8649–8656. doi: 10.1021/ja010996t. [DOI] [PubMed] [Google Scholar]
- 19.Boone E, Schuster GB. Nucleic Acids Res. 2002;30:830–837. doi: 10.1093/nar/30.3.830. [DOI] [PMC free article] [PubMed] [Google Scholar]
- 20.Osakada Y, Kawai K, Fujitsuka M, Majima T. Proc Natl Acad Sci USA. 2006;103:18072–18076. doi: 10.1073/pnas.0607148103. [DOI] [PMC free article] [PubMed] [Google Scholar]
- 21.Boon EM, Ceres DM, Drummond TG, Hill MG, Barton JK. Nat Biotechnol. 2000;18:1096–1100. doi: 10.1038/80301. [DOI] [PubMed] [Google Scholar]
- 22.Drummond TG, Hill MG, Barton JK. Nat Biotechnol. 2003;21:1192–1199. doi: 10.1038/nbt873. [DOI] [PubMed] [Google Scholar]
- 23.Smiley RD, Hammes GG. Chem Rev. 2006;106:3080–3094. doi: 10.1021/cr0502955. [DOI] [PubMed] [Google Scholar]
- 24.Tinnefeld P, Sauer M. Angew Chem Int Ed. 2005;44:2642–2671. doi: 10.1002/anie.200300647. [DOI] [PubMed] [Google Scholar]
- 25.Barbara PF, Gesquiere AJ, Park SJ, Lee YJ. Acc Chem Res. 2005;38:602–610. doi: 10.1021/ar040141w. [DOI] [PubMed] [Google Scholar]
- 26.De Schryver FC, Vosch T, Cotlet M, Van der Auweraer M, Mullen K, Hofkens J. Acc Chem Res. 2005;38:514–522. doi: 10.1021/ar040126r. [DOI] [PubMed] [Google Scholar]
- 27.McKinney SA, Freeman ADJ, Lilley DMJ, Ha TJ. Proc Natl Acad Sci USA. 2005;102:5715–5720. doi: 10.1073/pnas.0409328102. [DOI] [PMC free article] [PubMed] [Google Scholar]
- 28.Lee JY, Okumus B, Kim DS, Ha TJ. Proc Natl Acad Sci USA. 2005;102:18938–18943. doi: 10.1073/pnas.0506144102. [DOI] [PMC free article] [PubMed] [Google Scholar]
- 29.Buranachai C, McKinney SA, Ha T. Nano Lett. 2006;6:496–500. doi: 10.1021/nl052492p. [DOI] [PMC free article] [PubMed] [Google Scholar]
- 30.Braslavsky I, Hebert B, Kartalov E, Quake SR. Proc Natl Acad Sci USA. 2003;100:3960–3964. doi: 10.1073/pnas.0230489100. [DOI] [PMC free article] [PubMed] [Google Scholar]
- 31.Irie M, Fukaminato T, Sasaki T, Tamai N, Kawai T. Nature. 2002;420:759–760. doi: 10.1038/420759a. [DOI] [PubMed] [Google Scholar]
- 32.Rogers JE, Weiss SJ, Kelly LA. J Am Chem Soc. 2000;122:427–436. [Google Scholar]
- 33.Takada T, Kawai K, Fujitsuka M, Majima T. Proc Natl Acad Sci USA. 2004;101:14002–14006. doi: 10.1073/pnas.0402756101. [DOI] [PMC free article] [PubMed] [Google Scholar]
- 34.Takada T, Kawai K, Cai XC, Sugimoto A, Fujitsuka M, Majima T. J Am Chem Soc. 2004;126:1125–1129. doi: 10.1021/ja035730w. [DOI] [PubMed] [Google Scholar]
- 35.Takada T, Kawai K, Fujitsuka M, Majima T. Chem Eur J. 2005;11:3835–3842. doi: 10.1002/chem.200500052. [DOI] [PubMed] [Google Scholar]
- 36.Takada T, Barton JK. J Am Chem Soc. 2005;127:12204–12205. doi: 10.1021/ja054306n. [DOI] [PubMed] [Google Scholar]
- 37.Kawai K, Osakada Y, Takada T, Fujitsuka M, Majima T. J Am Chem Soc. 2004;126:12843–12846. doi: 10.1021/ja0475813. [DOI] [PubMed] [Google Scholar]
- 38.Kawai K, Kawabata K, Tojo S, Majima T. Bioorg Med Chem Lett. 2002;12:2363–2366. doi: 10.1016/s0960-894x(02)00404-3. [DOI] [PubMed] [Google Scholar]
- 39.Grunwell JR, Glass JL, Lacoste TD, Deniz AA, Chemla DS, Schultz PG. J Am Chem Soc. 2001;123:4295–4303. doi: 10.1021/ja0027620. [DOI] [PubMed] [Google Scholar]
- 40.Yao G, Fang XH, Yokota H, Yanagida T, Tan WH. Chem Eur J. 2003;9:5686–5692. doi: 10.1002/chem.200304977. [DOI] [PubMed] [Google Scholar]
Associated Data
This section collects any data citations, data availability statements, or supplementary materials included in this article.


