Abstract
Numerous investigations have focused on DNA damage induced by ionizing radiation; however, photoionization threshold energies of nucleic acid components in aqueous solution are not known. Herein, data from gas-phase photoelectron experiments have been combined with results from self-consistent field and post-self-consistent field molecular orbital calculations and with theoretical Gibbs free energies of hydration to describe aqueous ionization energies of 2′-deoxythymidine 5′-phosphate (5′-dTMP−) and 2′-deoxycytidine 5′-phosphate (5′-dCMP−). For the test molecules, indole and tryptophan, this approach yields aqueous ionization energies (4.46 and 4.58 eV, respectively) in agreement with experimental values (4.35 and 4.45 eV). When uridine and 2′-deoxythymidine ionization energies are evaluated, the results agree with recent data from 193-nm laser measurements indicating that uridine ionization occurs via a one-photon event. For 5′-dCMP− and 5′-dTMP−, a comparison of aqueous ionization energies with gas-phase ionization potentials (IPs) indicates that hydration alters the relative energies of ionization events. In the gas phase, phosphate vertical IPs are ∼1.3 eV smaller than base IPs. In aqueous solution, the base and phosphate ionization energies are more similar, and only differ by ∼0.5 eV. For 5′-dCMP− and 5′-dTMP−, the increased favorableness of base ionization, which accompanies hydration, is consistent with experimental data indicating that, at 77 K in aqueous perchlorate glasses, the primary photoionization pathway involves base ionization followed by deprotonation.
Nucleotide ionization plays an important role in mechanisms resulting in DNA damage caused by high-energy photons (1–4). However, there is little information about threshold energies required for DNA ionization in aqueous solution, except that they lie in the range of 4 to 7 eV (5, 6). In earlier work, vertical and adiabatic ionization potentials (IPs) were provided for gas-phase nucleotide components and model compounds (7–10). More recently, experimental data on nucleotide component model compounds has been combined with theoretical results to evaluate IPs for intact gas-phase nucleotides (11–14). Herein, gas-phase UV photoelectron data were used with results from molecular orbital calculations at the self-consistent field (SCF) and post-SCF levels to provide valence electron IPs of the gas-phase anionic nucleotides 2′-deoxycytidine 5′-phosphate (5′-dCMP−) (12, 15), 2′-deoxythymidine 5′-phosphate (5′-dTMP−) (15), 2′-deoxyguanosine 5′-phosphate (5′-dGMP−) (11, 13, 15, 16), and 2′-deoxyadenosine 5′-phosphate (5′-dAMP−) (14, 15). In all cases, the lowest IP is associated with the negatively charged phosphate group. However, these earlier gas-phase results do not provide information about nucleotide ionization under physiological conditions.
Water and counterion interactions are among the most important that DNA encounters in biological environments, and the effects of these interactions on nucleotide IPs were examined in gas-phase clusters of mononucleotides with Na+ and 4–14 H2O molecules (13, 15–17). These investigations used the same combination of experiment and theory that was used to examine isolated nucleotides. Gas-phase ionization energies of neutral base pairs, of stacked bases, and of base-pair–water clusters have also been evaluated in pure computational investigations (18–20).
Because of the important role electron donating properties play in the chemistry of nucleotides, the evaluation of valence electron IPs under physiological conditions is not only important to investigations of radiation damage. Nucleotide ionization thresholds are essential to a fundamental understanding of electronic influences on DNA biochemistry. The spectroscopic and computational methods that have been developed for evaluating gas-phase IPs have recently been extended to include bulk water relaxation effects on the electron donating properties of 5′-dGMP− (13) and 5′-dAMP− (17). For 5′-dGMP−, electron donating energies have provided a reactivity index for nucleotide reactions with electrophilic DNA methylating agents.
The experimental investigation of nucleotide and nucleotide component photoionization in water has been carried out in pulsed laser experiments with 282-nm (21), 266-nm (22), 254-nm (23), and 193-nm (6, 24) photons. However, these experiments were carried out at fixed wavelengths and have not provided ionization threshold energies. In the investigation reported herein, a combination of gas-phase data and theoretical results has been used to evaluate the influence of nucleotide–water interactions on photoionization threshold energies of 5′-dCMP− and 5′-dTMP− in aqueous solution.
METHODS
Nucleotide valence electron IPs in aqueous solution were evaluated by using Eq. 1 (13, 17), where ΔGIONaq is the Gibbs free energy associated with the aqueous ionization of the nucleotide from the closed-shell anion to an open-shell radical.
 |
1 |
In Eq. 1, IPAD is the gas-phase adiabatic ionization potential associated with removal of an electron from a specific nucleotide orbital, V0 is the energy difference (−1.3 eV) between an electron in aqueous solution at the conduction-band edge and an electron in the gas phase (25, 26), and ΔΔGHYD is given by Eq. 2.
 |
2 |
In Eq. 2, ΔGHYD1 is the Gibbs free energy of hydration of the nucleotide before ionization, and ΔGHYD2 is the hydration energy after ionization. In Eq. 1, the entropy contribution to gas-phase ionization is taken to be negligible (13).
Gas-phase IPs of 5′-dTMP− and 5′-dCMP− were obtained from results of an earlier investigation (15). Herein, the ionization potentials were evaluated by correcting IPs obtained via application of Koopmans’ theorem (27) to results from SCF molecular orbital calculations on the isolated nucleotides with the 3–21G basis set (28) and the gaussian 94 program (29). The method relies on the observation that the valence orbital structure in nucleotides is largely localized on the base, sugar, or phosphate groups and that the upper occupied orbitals occurring in isolated base and sugar model compounds and phosphate anions correlate closely with orbitals in the intact nucleotides (11–14, 16). For 5′-dTMP− and 5′-dCMP−, valence electron IPs that are associated with orbitals localized on the base and sugar groups and that were evaluated at the 3–21G SCF level were corrected by using He(I) UV photoelectron data (11, 12, 30) for 1-methylthymine (1-MeT), 1-methylcytosine (1-MeC), and 3-hydroxytetrahydrofuran (3-OH-THF).
Phosphate group IPs in 5′-dTMP− and 5′-dCMP− were obtained from 3–21G SCF results that were corrected with results from post-SCF calculations on the model anion H2PO4− and on the neutral radical H2PO4• (31). These used the second-order Möller–Plesset perturbation (MP2) theory (28) to determine the ground-state energies of H2PO4− and neutral H2PO4•. The MP2 calculations were carried out with a 6–31+G* basis set (28). The first IP of H2PO4− was calculated by subtracting the ground-state MP2 energy of H2PO4− from the ground-state MP2 energy of H2PO4•, calculated with an unrestricted Hartree–Fock wave function (28). Higher IPs of H2PO4− were evaluated by using the energies of the first four excited states of H2PO4• (31), obtained from second-order perturbation (CASPT2) calculations (32, 33) with a complete active-space self-consistent field (CASSCF) wave function (34). The CASSCF calculations used a double ζ quality basis set containing diffuse functions with 9 or 10 electrons in 10 active orbitals (31). The second through fifth IPs of H2PO4− were calculated by adding the CASPT2 excitation energies for H2PO4• to the value for the first IP. The correction procedure used to obtain the gas-phase IPs of 5′-dTMP− and 5′-dCMP− relies on the observation that absolute values of ionization potentials calculated by using SCF methods are often in error by more than 1.0 eV; however, SCF predictions of perturbations in IPs arising from interactions between substituents are much more accurate.
Molecular orbital diagrams used to describe electron holes occurring in ionization events in the nucleotides, the model compounds, and H2PO4− were obtained from results of the 3–21G SCF calculations and have been drawn as described (13, 17). The diagrams show contributions for which molecular orbital coefficients are greater than 0.15.
Correction of Gas-Phase Ionization Potentials Obtained from SCF Calculations.
For 5′-dTMP− and 5′-dCMP−, gas-phase base and sugar IPs predicted by Koopmans’ analysis of 3–21G SCF calculations (13, 15) were corrected by adding to each calculated IP the appropriate difference between the experimental and Koopmans’ values of IPs in the base and sugar model compounds. The Koopmans’ values for the gas-phase phosphate IPs of 5′-dTMP− and 5′-dCMP− were corrected by adding the difference between the post-SCF and Koopmans’ values of the IPs in H2PO4−.
In earlier investigations of nucleotides (13, 15, 17), base and sugar ionization potentials obtained from SCF calculations were corrected by using vertical IPs obtained from photoelectron spectra. Vertical IPs were used because of the high accuracy with which they can be measured and because the overlapping of bands makes it possible to reliably evaluate the adiabatic IP of only the highest occupied molecular orbital. In the present investigation, adiabatic IPs, when available, have been used to correct the SCF ionization potentials. In this case, adiabatic IPs of the base and sugar model compounds have been used to correct the lowest energy ionization events associated with the nucleotide base and sugar groups. Vertical IPs from the model compounds and anion have been used to correct the higher-energy ionization events in the base and sugar groups and all of the ionization potentials of the phosphate groups.
Because the procedure for obtaining corrected gas-phase IPs uses experimental and post-SCF results to correct Koopmans’ IPs that were obtained by using the same basis set for the model compounds and anion and for the nucleotides, the corrected nucleotide IPs of localized orbitals exhibit only small basis set dependence (13).
Geometries.
A planar ring geometry was used for calculations on 1-MeT, 1-MeC, 1-methyluracil, indole, and tryptophan. Heavy-atom bond lengths and bond angles were optimized at the 3–21G SCF level. For 1-MeT, 1-MeC, 1-methyluracil, indole, tryptophan, uridine, 2′-deoxythymidine, 2-deoxyribose, 5′-dTMP−, and 5′-dCMP−, the C–H bond lengths were 1.08 and 1.09 Å for sp2 and sp3 C atoms, respectively (35). The O–H and N–H bond lengths were 0.96 and 1.01 Å. The H-atom bond angles and the torsional angles describing CH3 and O–H rotation were optimized at the 3–21G SCF level. The geometries of 3-OH-THF, H2PO4−, 1,9-dimethylguanine, 9-methyladenine, 5′-dGMP−, and 5′-dAMP− were the same as those used earlier in calculations of gas-phase IPs (11, 13, 15, 17, 31). Heavy-atom bond lengths and bond angles for 5′-dTMP− and 5′-dCMP− were obtained from crystallographic B-DNA dodecamer data (36) on the geometries of 5′-dTMP− at position 8 in strand B and 5′-dCMP− at position 9 of strand A. The geometry of 2′-deoxythymidine was based on that of 5′-dTMP−. The geometry of the heavy atoms of uridine was obtained from crystallographic data (37). The geometry of the heavy atoms of 2-deoxyribose in the α-D-ribofuranose form occurring in DNA was based on average x-ray geometries for the sugar–phosphate backbone (37). The exocyclic C1–O bond length was 1.43 Å (35). For the exocyclic O atom, the C1–C2–O bond angle and the dihedral angle between the O–C1–C2 the C1–C2–C3 planes were optimized at the 3–21G SCF level.
For the 5′-dTMP− and 5′-dCMP− geometries used herein, the crystal structures were adjusted by making small changes (<5°) in the dihedral angles describing rotation about the glycosidic and phosphate ester bonds, and small changes (<2.2°) in the angles describing the sugar pucker. These were introduced to enhance the localization of the valence orbitals and to improve correlation with orbitals in the model compounds. However, for both of the nucleotides, the adjustments resulted in valence orbital energy changes of less than 0.1 eV, as calculated at the 3–21G SCF level.
Evaluation of Gibbs Free Energies of Hydration.
Values of ΔGHYD1 and ΔGHYD2 were calculated for 5′-dTMP− and 5′-dCMP− by using the Langevin dipole relaxation method (38, 39) and the polaris 3.2 program (38). The atomic charges of 5′-dTMP− and 5′-dCMP−, before and after ionization, which are needed to calculate ΔGHYD1 and ΔGHYD2, were obtained as described (13, 17). Hydration energies before ionization, ΔGHYD1, were obtained by using atomic charges from Mulliken population analysis (28) of 3–21G SCF results for the ground states of isolated 5′-dTMP− and 5′-dCMP−. Hydration energies after ionization, ΔGHYD2, were obtained by modifying the atomic charges of the anions. For ionization of a nucleotide phosphate group, the modified atomic charges were obtained by subtracting the charge of a single electron distributed over the nucleotide phosphate atoms from the charge distribution of 5′-dTMP− or 5′-dCMP−. The distribution of the removed electron was obtained by subtracting the atomic charge distributions for the ground state of the isolated gas-phase radicals, 5′-dTMP⋅ or 5′-dCMP⋅, from the distributions of the corresponding anions. In 5′-dTMP− and 5′-dCMP−, the highest occupied molecular orbital is an O atom lone-pair orbital on the phosphate group.
For base ionization, the modified charges were obtained by subtracting the charge of a single electron distributed over the base atoms. The distribution of the removed electron was obtained by subtracting the atomic charge distribution for the ground state of a radical cluster containing the nucleotide, five water molecules, and Na+ (5′-dTMP⋅⋅5H2O⋅Na+ or 5′-dCMP⋅⋅5H2O⋅Na+) from that of a corresponding ground-state closed-shell cluster (5′-dTMP−⋅5H2O⋅Na+ or 5′-dCMP−⋅5H2O⋅Na+). The geometries of these clusters have been described (15). In both cases, Na+ is bound to the phosphate group, and the highest occupied molecular orbital is a base π orbital.
For sugar ionization, the modified charges were obtained by subtracting the charge of an electron distributed over the sugar atoms. The distribution of the removed electron was obtained by subtracting the charge distribution for the ground state of the radical cation 3-OH-THF+ from that of the ground state of 3-OH-THF.
RESULTS
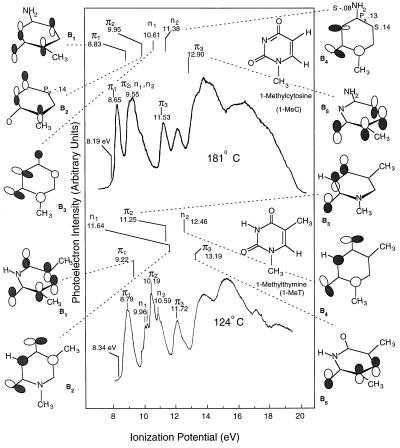
Fig. 1 contains the He(I) UV photoelectron spectra of 1-MeT and 1-MeC. The figure shows assignments reported earlier (12, 30) and, in cases where the bands do not overlap, vertical IPs for bands arising from the five highest occupied π and lone-pair orbitals (B1 to B5). In addition, the figure gives adiabatic IPs associated with the highest occupied orbitals. Finally, Fig. 1 contains orbital diagrams and theoretical IPs obtained by applying Koopmans’ theorem to results from the SCF calculations with the 3–21G basis set.
Figure 1.
He(I) UV photoelectron spectra of the model compounds, 1-MeC and 1-MeT, showing assignments and vertical IPs associated with the five highest occupied molecular orbitals. Theoretical ionization potentials obtained from 3–21G SCF calculations are given above the spectra. The lowest energy experimental adiabatic IPs are also given. For each model compound, orbital diagrams illustrate major atomic orbital contributions to the five highest occupied molecular orbitals (B1–B5). Positive regions of the orbital wave functions are shaded. For π orbitals (B1, B2, and B5 of 1-MeC and B1, B3, and B5 of 1-MeT) the viewing angle is different than for loan-pair orbitals (B3 and B4 of 1-MeC and B2 and B4 of 1-MeT).
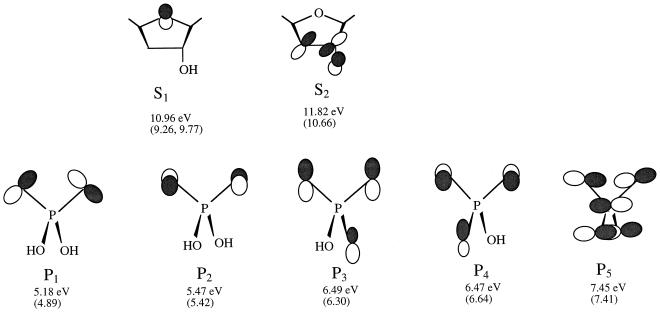
Fig. 2 contains 3–21G SCF ionization potentials and orbital diagrams for the five highest occupied orbitals (P1-P5) of H2PO4− and for the two highest occupied orbitals (S1 and S2) of 3-OH-THF. The figure also contains the experimental adiabatic S1 ionization potential and the experimental vertical S1 and S2 ionization potentials of 3-OH-THF. The results in Figs. 1 and 2 indicate that the theoretical IPs associated with the lowest energy π and lone-pair orbitals of 1-MeC, 1-MeT, and 3-OH-THF are 0.18–1.68 eV larger than the experimental vertical IPs.
Figure 2.
Orbital diagrams for the upper occupied orbitals in 3-OH-THF and H2PO4−, and IPs obtained from results of 3–21G SCF calculations. Experimental IPs of 3-OH-THF and theoretical IPs of H2PO4− obtained from a combination of MP2 and CASPT2 calculations (ref. 31) are given in parentheses. For 3-OH-THF, experimental values are given for the S1 and S2 vertical ionization potentials and for the S1 adiabatic IP.
In addition to the SCF 3–21G results for H2PO4−, Fig. 2 gives the five lowest energy vertical IPs obtained from a previously reported combination of MP2 and CASPT2 results (31). Although the values of H2PO4− ionization potentials obtained from Koopmans’ theorem are not accurate, descriptions of the electron distributions associated with low energy ionization events that are based on a Koopmans’ analysis and on the orbital diagrams of H2PO4− shown in Fig. 2 are qualitatively correct. This conclusion is supported by results of CASSCF calculations that indicate that coefficients associated with the most important configurations describing the ground states of H2PO4− and H2PO4• and the excited states of H2PO4• are all greater than 0.9 (31).
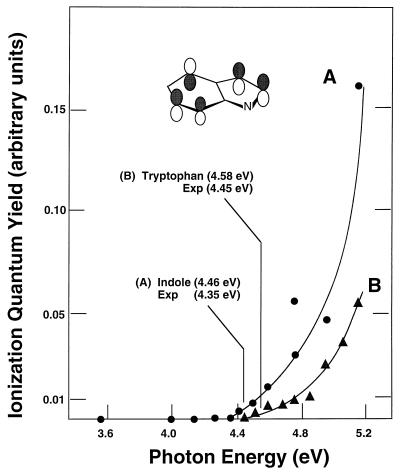
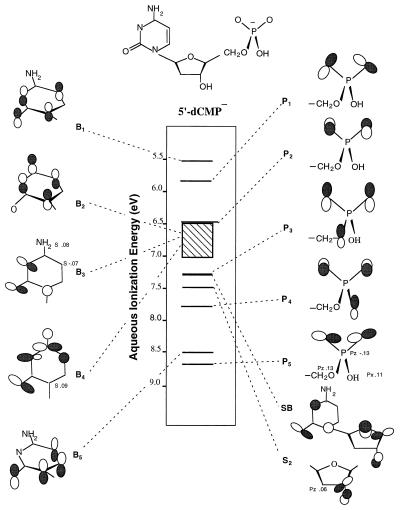
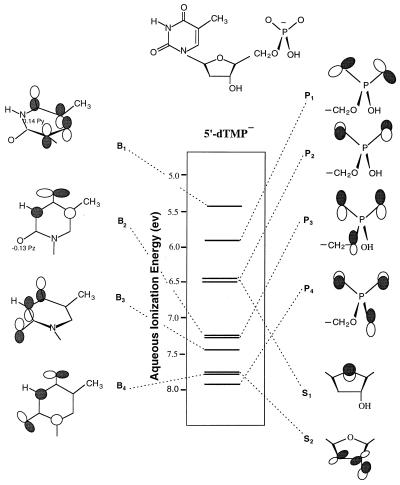
Fig. 3 shows aqueous Gibbs free energies of ionization for indole and tryptophan. Fig. 4 contains the 12 lowest aqueous ionization energies of 5′-dCMP−, obtained from corrected gas-phase IPs and Eqs. 1 and 2. Fig. 5 shows similar results for the 10 lowest energy ionization events of 5′-dTMP−. Figs. 3–5 also contain orbital diagrams, based on results from 3–21G SCF calculations, that describe the low-energy ionization events in indole, tryptophan, 5′-dCMP−, and 5′-dTMP−. In Figs. 4 and 5, orbitals of 5′-dCMP− and 5′-dTMP− that are localized on the base, sugar, and phosphate groups are labeled B, S, and P, respectively. For tryptophan, the threshold energy given in Fig. 3 was evaluated by using the methods used for 5′-dCMP− and 5′-dTMP−. The gas-phase adiabatic IP of tryptophan was obtained by correcting the 3–21G SCF results. Indole, with an experimental gas-phase adiabatic IP of 7.76 eV (40), was used as the model compound upon which correction of the tryptophan gas-phase IP was based. In Fig. 3, the aqueous ionization threshold energies of tryptophan and indole were obtained via Eq. 1, where values of ΔΔGHYD were calculated with Eq. 2. The charge distributions of tryptophan and indole, before and after ionization, were obtained from 3–21G SCF calculations.
Figure 3.
Comparison of aqueous ionization energies of indole and tryptophan obtained by using the present methods with experimental threshold energies for conduction-band ionization. The orbital diagram describes the highest occupied molecular orbital in indole and tryptophan. Experimental threshold energies and data were taken from ref. 25.
Figure 4.
Aqueous ionization energies associated with the 12 highest occupied molecular orbitals in 5′-dCMP−. Orbitals which are localized on the base, sugar, and the phosphate groups are designated B, S2, and P, respectively. The area containing diagonal lines corresponds to an unresolved energy region in the photoelectron spectrum of 1-MeC that contains bands arising from the B2, B3, and B4 orbitals.
Figure 5.
Aqueous ionization energies associated with the 10 highest occupied molecular orbitals in 5′-dTMP−.
According to the results in Figs. 4 and 5, the upper occupied base orbitals in 5′-dCMP− (B1 to B5) and 5′-dTMP− (B1 to B4), the sugar (S1 and S2) orbitals in 5′-dTMP−, and the S2 orbital in 5′-dCMP− have electron distributions similar to those occurring in corresponding orbitals of the model compounds 1-MeC, 1-MeT, and 3-OH-THF. The results in Figs. 4 and 5 also indicate that the upper occupied phosphate orbitals in 5′-dCMP− (P1 to P5) and 5′-dTMP− (P1 to P4) correspond to orbitals in the model anion H2PO4−.‡
For 5′-dCMP−, one of the orbitals, SB, is delocalized. This orbital is formed from a mixing between S1 and S2 of 3-OH-THF and B3 and B4 of 1-MeC. The SB aqueous ionization energy in Fig. 4 is reported as a vertical ionization energy. The value was obtained by using the S1 correction for the vertical gas-phase IP and ΔΔGHYD associated with sugar ionization. Values of the SB aqueous ionization energy obtained by using the S2 correction for the gas-phase IP or the average B3, B4 correction for the gas-phase IP, and ΔΔGHYD associated with base ionization differed from the value in Fig. 4 by less than 0.1 eV. The uncorrected results from 3–21G SCF calculations on 5′-dCMP− also indicate the occurrence of an orbital (SP) with large contributions from O atom lone-pair orbitals on the sugar and phosphate groups and with a gas-phase IP between that of the S2 and P4 orbitals. However, the wave function and the relative IP of this orbital are basis set-dependent, and the energy of SP is not shown in Fig. 4. In 6–31G SCF calculations, this orbital becomes more localized on the sugar and has a gas-phase IP greater than those of the B5 and P5 orbitals.
Table 1 gives corrected gas-phase IPs of the highest occupied phosphate and base orbitals of 5′-dCMP− and 5′-dTMP− and values of ΔΔGHYD. The absolute values of the aqueous free energies of ionization given in Figs. 4 and 5, as well as the relative spacing of orbital ionization energies, differ significantly from the corrected gas-phase IPs of 5′-dCMP− and 5′-dTMP−. For example, the corrected gas-phase vertical P1 ionization potentials (5.0 and 5.2 eV, respectively) are significantly smaller (∼0.8 eV) than the adiabatic B1 ionization potentials. (The vertical P1 ionization potentials are ∼1.3 eV smaller than the vertical B1 ionization potentials.) The smaller P1 gas-phase IPs are consistent with the observation that the negative charge in the anions is localized on the phosphate group (11, 15). The results in Table 1 indicate that the corrected gas-phase P1 ionization potentials of 5′-dCMP− and 5′-dTMP− differ from the MP2 P1 ionization potential of H2PO4−, given in Fig. 2, by less than ∼0.4 eV. However, the corrected gas-phase B1 ionization potentials are 1.9–2.4 eV smaller than the corresponding experimental B1 ionization potentials of 1-MeC and 1-MeT. The large differences between the base IPs in the nucleotides, compared with corresponding IPs in 1-MeC and 1-MeT, reflect the electrostatic lowering (12) of the base IPs in 5′-dCMP− and 5′-dTMP− due to the negatively charged phosphate group.
Table 1.
Corrected gas-phase nucleotide ionization potentials associated with the highest occupied phosphate and base orbitals and values of ΔΔGHYD
| Ionization potentials ΔΔGHYD, eV
|
||
|---|---|---|
| 5′-dCMP− | 5′-dTMP− | |
| P1 | 5.0* (2.2) | 5.2* (2.0) |
| B1 | 5.8† (1.0) | 6.0† (0.7) |
ΔΔGHYD values, in eV, are in parentheses.
Vertical ionization potential.
Adiabatic ionization potential.
DISCUSSION
When considering the relation between the results for 5′-dCMP− and 5′-dTMP− in Figs. 4 and 5 and results from nucleotide photoionization experiments, it is important to note that, in the present investigation, values of ΔGIONaq have been evaluated under conditions where bulk solvent relaxation occurs. Since the time scale for complete bulk solvent relaxation (∼540 fs) is longer (41) than that for electron localization in an aqueous photoionization experiment (∼180 fs), the kinetics of hydration may influence the observed threshold for ionization. However, the recent finding that polar solvent relaxation occurs on multiple time scales, some of which are in the 50-fs range (42), provides a mechanism by which rapid solvent relaxation can take place for some ionization events occurring at the fully relaxed threshold energy.
The average uncertainty in the aqueous ionization energies reported herein is estimated to be 0.5 eV. This accounts for the error introduced in the correction of gas-phase nucleotide IPs by using photoelectron data for model compounds. In a test in which the gas-phase IP correction method was applied to the five lowest-energy ionization potentials of five different methyl substituted uracils, for which experimental IPs were available, the average difference between the corrected ionization potentials and the experimental IPs was 0.12 eV (15). The estimate of the uncertainty in the nucleotide aqueous ionization energies also takes into account the uncertainty in the first IP of H2PO4− obtained from MP2/6–31+G* calculations. For H2PO4−, no experimental gas-phase ionization potentials have been reported. However, when the method used herein is applied to CH3O− and PO2−, the calculated and experimental IPs differ by less than 0.3 eV (11). Results from a comparison (31) of the differences between the second through fifth gas-phase IPs of H2PO4−, obtained by using CASPT2 results based on CASSCF reference wave functions with different numbers of active orbitals, are consistent with the conclusion that the average uncertainty in the P1 to P5 ionization potentials is 0.5 eV. Finally, the estimate of the uncertainty in the aqueous nucleotide ionization energies accounts for errors in the calculated ΔΔGHYD values. For Na+, Cl−, NH4+, N(CH3)H3+, N(C2H5)H3+, and N(CH3)3H+, calculated values of ΔGHYD differ from experimental values by 0.02–0.31 eV (13, 38). The errors in ΔΔGHYD are expected to be similar in magnitude. This conclusion is supported by the good agreement between the experimental aqueous ionization energy of indole, discussed below, and the energy obtained by using the present method. The difference between the energy values, 0.11 eV, is due solely to the error in ΔΔGHYD.
The larger uncertainty in the gas-phase IPs associated with the P1 to P5 orbitals of H2PO4− suggests that the error in the corresponding aqueous ionization energies of the nucleotides is greater than 0.5 eV. However, the error in the aqueous ionization energies associated with the upper occupied base and sugar orbitals of the nucleotides, for which model compound experimental gas-phase IPs are available, is expected to be less than 0.5 eV. Although experimental data are not available for nucleotides, the errors introduced in this evaluation of aqueous threshold energies were examined for two molecules, tryptophan and indole, for which experimental results are available. Fig. 3 compares ionization energies obtained herein with previously reported experimental values for conduction-band ionization thresholds (25, 26, 43). This comparison indicates that, for indole and tryptophan, the experimental threshold energies, 4.35 and 4.45 eV, respectively, differ by less than 0.2 eV from the values obtained by using the methods described herein.
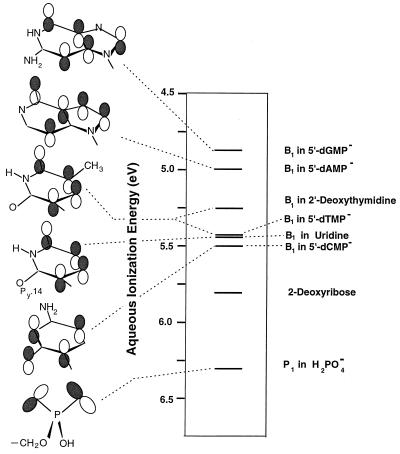
Fig. 6 compares the aqueous base ionization threshold energies for 5′-dGMP−, 5′-dAMP−, 5′-dCMP−, and 5′-dTMP−. Fig. 6 also gives the lowest aqueous ionization energies of the nucleosides uridine and 2′-deoxythymidine, of H2PO4−, and of 2-deoxyribose in the α-d-ribofuranose form occurring in DNA. For 2′-deoxythymidine and uridine, the base ionization energies in Fig. 6, 5.3 and 5.5 eV, respectively, are 0.6 and 0.7 eV smaller than earlier estimates (5). The earlier results were based on calculations of the influence of nucleoside hydration that depended only on the free energy of hydration of the radical cation formed after ionization and that relied on the Born formula. The results in Fig. 6 shed light on conflicting laser photoionization data for uridine and 2′-deoxythymidine. One experiment (6), carried out with 45 mJ and 20-ns pulses led to the conclusion that 193-nm (6.4 eV) base ionization of uridine and 2′-deoxythymidine are two-photon processes. A second experiment (24) that examined uridine indicates that base ionization at 193 nm is a one-photon process. The results in Fig. 6 provide evidence that 193-nm photons are above the B1 ionization threshold for both uridine and 2′-deoxythymidine and support the results from the uridine experiment of ref. 24.
Figure 6.
Aqueous base (B1) ionization energies and orbital diagrams for 5′-dGMP−, 5′-dAMP−, 5′-dCMP−, 5′-dTMP−, 2′-deoxythymidine and uridine. The small difference between the ionization energies of 5′-dCMP− and 5′-dTMP− makes the ordering uncertain; however, in the gas phase, the B1 ionization potential of the model compound 1-MeC is less than that of 1-MeT. Results are also given for 2-deoxyribose and H2PO4−. All ionization energies were obtained from Eq. 1. For H2PO4−, the gas-phase P1 ionization potential was calculated at the MP2/6–31+G* level (ref. 31), and ΔΔGHYD was evaluated by using H2PO4− and H2PO4• charge distributions from 3–21G SCF calculations. For 5′-dGMP− and 5′-dAMP−, uncorrected B1 gas-phase IPs were obtained from 3–21G SCF calculations, and values of ΔΔGHYD were the same as those used in earlier investigations of nucleotide electron donating properties (see refs. 13 and 17). For 2′-deoxythymidine, uridine, and 2-deoxyribose, aqueous ionization energies were obtained with the same method used to obtain 5′-dCMP− and 5′-dTMP− ionization energies. 3-OH-THF was used as a model compound to correct the gas-phase IP of 2-deoxyribose. 1,9-Dimethylguanine, 9-methyladenine, and 1-methyluracil with experimental adiabatic IPs of 7.71, 7.97, and 8.75 eV, respectively, were used as model compounds to correct the gas-phase B1 ionization potentials of 5′-dGMP−, 5′-dAMP−, and uridine, respectively (see refs. 11, 13, 17, and 30).
The results in Fig. 6 also point out that the aqueous B1 ionization threshold energy of anionic 5′-dTMP− (5.4 eV) is nearly the same as that of the neutral nucleoside 2′-deoxythymidine (5.3 eV). This similarity indicates that, in the nucleotide, the electrostatic reduction in the base ionization energies, arising from interaction with the phosphate group, is nearly canceled by hydration effects. For the anionic nucleotides, hydration causes the aqueous B1 ionization energies to decrease less than for the neutral nucleosides. The ΔΔGHYD + V0 values for B1 ionization of 5′-dTMP− and 2′-deoxythymidine are −0.6 and −2.9 eV, respectively. This difference between hydration effects on nucleotide versus nucleoside ionization energies occurs because nucleotides are formally charged before ionization and neutral after ionization, whereas the opposite is true for nucleosides.
Finally, the results in Figs. 4 and 5 and Table 1 provide information about the influence of hydration on the relative energies of B1 compared with P1 ionization events in nucleotides. Compared with the corrected gas-phase IPs, the results in Figs. 4 and 5 indicate that, in aqueous solution, the B1 ionization energies decrease relative to the P1 ionization energies. In solution, the differences between the adiabatic B1 ionization energies and the vertical P1 ionization energies are no larger than 0.5 eV. The differences between the adiabatic B1 and adiabatic P1 ionization energies are even smaller. This relative decrease in B1 versus P1 ionization energies reflects the difference in ΔΔGHYD values associated with base versus phosphate ionization. For P1 ionization, which results in formation of a radical in which the base, sugar, or phosphate groups do not contain significant charge, the ΔΔGHYD values for 5′-dCMP− and 5′-dTMP− in Table 1 are large and positive. In contrast, B1 ionization results in the formation of a radical zwitterion with a positively charged base and a negatively charged phosphate group. In this example, as in P1 ionization, ΔΔGHYD is positive. However, for 5′-dCMP− and 5′-dTMP−, charge separation in the radicals formed via B1 ionization results in ΔΔGHYD values with magnitudes that are significantly smaller than for P1 ionization.
Hydration effects that enhance the favorableness of base ionization versus phosphate ionization have been noted earlier in investigations of electron donating properties of 5′-dGMP− and 5′-dAMP− (13, 17), where the ordering of the ionization energies changes. In the gas phase, the P1 ionization potentials are smaller than B1. In aqueous solution, B1 ionization energies are smaller than P1. For the 5′-dCMP− and 5′-dTMP− results in Figs. 4 and 5, the B1 and P1 ionization energies differ by approximately 0.5 eV, and within the uncertainty associated with the gas-phase IPs of the phosphate model anion H2PO4−, it is not currently possible to determine which is smaller. Nevertheless, the relative increase in the energetic favorableness of aqueous base ionization in 5′-dCMP− and 5′-dTMP−, which this description provides, is consistent with the observation that, at 77 K in aqueous ClO4− glasses, two-photon 248-nm photoionization of 5′-dTMP− and 5′-dCMP− results principally in deprotonation products formed via radical cations in which charge is localized on the base groups (2, 44).
Acknowledgments
Helpful discussions with Dr. Jan Floriàn (University of Southern California) are gratefully acknowledged. Support of this work by the American Cancer Society (Grant RPG-91-024-08-CNE) is gratefully acknowledged. Computer access time has been provided by the National Center for Supercomputing Applications at the University of Illinois at Urbana-Champaign, the Cornell Theory Center, and the Computer Center of the University of Illinois at Chicago.
ABBREVIATIONS
- SCF
self-consistent field
- IP
ionization potential
- 1-MeT
1-methylthymine
- 1-MeC
1-methylcytosine
- 3-OH-THF
3-hydroxytetrahydrofuran
- MP2
second-order Möller–Plesset perturbation
- CASPT2
CAS second-order perturbation
- CASSCF
complete active-space self-consistent field
Footnotes
For the B3, B4, and P5 orbitals in 5′-dCMP− and the B1 and B3 orbitals in 5′-dTMP−, small apparent differences occurring in the diagrams in Figs. 4 and 5 versus those in Figs. 1 and 2 are exaggerated by the cutoff criterion (see ref. 13). In cases where there are small differences between corresponding orbitals in the nucleotides and the model compounds or H2PO4−, molecular orbital coefficients are given in the figures.
References
- 1.Melvin T, Botchway S W, Parker A W, O’Neill P. J Am Chem Soc. 1996;118:10031–10036. [Google Scholar]
- 2.Malone M E, Cullis P M, Symons M C R, Parker A W. J Phys Chem. 1995;99:9299–9308. [Google Scholar]
- 3.Görner H, Gurzadyan G G. Photochem Photobiol A Chem. 1993;71:155–160. doi: 10.1111/j.1751-1097.1993.tb04906.x. [DOI] [PubMed] [Google Scholar]
- 4.Schulte-Frohlinde D, Simic M G, Görner H. Photochem Photobiol. 1990;52:1137–1151. doi: 10.1111/j.1751-1097.1990.tb08453.x. [DOI] [PubMed] [Google Scholar]
- 5.Nikogosyan D N. Int J Radiat Biol. 1990;57:233–299. doi: 10.1080/09553009014552411. [DOI] [PubMed] [Google Scholar]
- 6.Steenken S, Candeias L P. J Am Chem Soc. 1992;114:699–704. [Google Scholar]
- 7.Urano S, Yang S, LeBreton P R. J Mol Struct. 1989;214:315–328. [Google Scholar]
- 8.Yu C, O’Donnell T J, LeBreton P R. J Phys Chem. 1981;85:3851–3855. [Google Scholar]
- 9.LeBreton P R, Fetzer S, Tasaki K, Yang X, Yu M, Slutskaya Z, Urano S. J Biomol Struct Dyn. 1988;6:199–222. doi: 10.1080/07391102.1988.10506491. [DOI] [PubMed] [Google Scholar]
- 10.Kim S K, Lee W, Herschbach D R. J Phys Chem. 1996;100:7933–7937. [Google Scholar]
- 11.Kim H S, Yu M, Jiang Q, LeBreton P R. J Am Chem Soc. 1993;115:6169–6183. [Google Scholar]
- 12.Tasaki K, Yang X, Urano S, Fetzer S, LeBreton P R. J Am Chem Soc. 1990;112:538–548. [Google Scholar]
- 13.Kim H S, LeBreton P R. J Am Chem Soc. 1996;118:3694–3707. [Google Scholar]
- 14.Kim H S, Jiang Q, LeBreton P R. Int J Quantum Chem Quantum Biol Symp. 1996;23:11–19. [Google Scholar]
- 15.Fernando, H., Kim, N. S., Papadantonakis, G. A. & LeBreton, P. R. (1997) Am. Chem. Soc. Symp. Series, in press.
- 16.Kim H S, LeBreton P R. Proc Natl Acad Sci USA. 1994;91:3725–3729. doi: 10.1073/pnas.91.9.3725. [DOI] [PMC free article] [PubMed] [Google Scholar]
- 17.Kim N S, LeBreton P R. Biospectroscopy. 1997;3:1–16. [Google Scholar]
- 18.Colson A O, Besler B, Sevilla D. J Phys Chem. 1993;97:13852–13859. [Google Scholar]
- 19.Hutter M, Clark T. J Am Chem Soc. 1996;118:7574–7577. [Google Scholar]
- 20.Sugiyama H, Saito I. J Am Chem Soc. 1996;118:7063–7068. [Google Scholar]
- 21.Reuther A, Nikogosyan D N, Laubereau A. J Chem Phys. 1996;100:5570–5577. [Google Scholar]
- 22.Nikogosyan D N, Oraevsky A A, Letokhov V S. Chem Phys. 1985;97:31–41. [Google Scholar]
- 23.Arce R, Martinez L, Danielsen E. Photochem Photobiol. 1993;58:318–328. doi: 10.1111/j.1751-1097.1993.tb09568.x. [DOI] [PubMed] [Google Scholar]
- 24.Gurzadyan G, G, Görner H. Photochem Photobiol. 1994;60:323–332. doi: 10.1111/j.1751-1097.1994.tb05111.x. [DOI] [PubMed] [Google Scholar]
- 25.Grand D, Bernas A, Amouyal E. Chem Phys. 1979;44:73–79. [Google Scholar]
- 26.Goulet T, Bernas A, Ferradini C, Jay-Gerin J-P. Chem Phys Lett. 1990;170:492–496. [Google Scholar]
- 27.Koopmans T. Physica. 1934;1:104–113. [Google Scholar]
- 28.Hehre W J, Radom L, Schleyer P v R, Pople J A. Ab Initio Molecular Orbital Theory. New York: Wiley; 1986. p. 22. , 25–29, 65, 38–40, 76, 79, and 86. [Google Scholar]
- 29.Frisch M J, Trucks G W, Schlegel H B, Gill P M W, Johnson B G, Robb M A, Cheeseman J R, Keith T A, Petersson G A, Montgomery J A, et al. Gaussian 94. Pittsburgh, PA: Gaussian; 1995. [Google Scholar]
- 30.Padva A, O’Donnell T J, LeBreton P R. Chem Phys Lett. 1976;41:278–282. [Google Scholar]
- 31.Fetzer S A, LeBreton P R, Rohmer M M, Veillard A. Int J Quantum Biol Symp. 1997;65:1095–1106. [Google Scholar]
- 32.Andersson K, Malmqvist P-A, Roos B O, Sadlej A J, Wolinski K. J Phys Chem. 1990;94:5483–5488. [Google Scholar]
- 33.Andersson K, Malmqvist P-A, Roos B O. J Chem Phys. 1992;96:1218–1226. [Google Scholar]
- 34.Siegbahn P E M, Almlöf J, Heiberg A, Roos B O. J Chem Phys. 1981;74:2384–2396. [Google Scholar]
- 35.Bowen H J M, Donohue J, Jenkin D G, Kennard O, Wheatley P J, Wiffen D H. In: Tables of Interatomic Distances and Configuration in Molecules and Ions. Sutton L E, Jenkins D G, Mitchell A D, Cross L C, editors. London: The Chemical Society; 1958. p. M67. , S7, S8, S15–S17. [Google Scholar]
- 36.Westhof E. J Biomol Struct Dyn. 1987;5:581–600. doi: 10.1080/07391102.1987.10506414. [DOI] [PubMed] [Google Scholar]
- 37.Parkinson G, Vojtechorsky J, Clowney L, Bronger A T, Berman H M. Acta Crystallogr D. 1996;52:57–64. doi: 10.1107/S0907444995011115. [DOI] [PubMed] [Google Scholar]
- 38.Lee F S, Chu Z T, Warshel A. J Comp Chem. 1993;14:161–185. [Google Scholar]
- 39.Warshel A, Åqvist J. Annu Rev Biophys Biophys Chem. 1991;20:267–750. doi: 10.1146/annurev.bb.20.060191.001411. [DOI] [PubMed] [Google Scholar]
- 40.Gusten H, Klasinc J, Knop V, Trinajstic N. In: Excited States of Biological Molecules. Birks J B, editor. New York: Wiley Interscience; 1976. p. 47. [Google Scholar]
- 41.Reuther A, Laubereau A, Nikogosyan D N. J Phys Chem. 1996;100:16794–16800. [Google Scholar]
- 42.Jimenez R, Fleming G R, Kumar P V, Maroncelli M. Nature (London) 1994;369:471–473. [Google Scholar]
- 43.Bernas A, Grand D, Amouyal E. J Phys Chem. 1980;84:1259–1262. [Google Scholar]
- 44.Malone M E, Symons M C R, Parker A W. J Chem Soc Perkin Trans. 1993;2:2067–2075. [Google Scholar]


