Abstract
We investigated how saccade target selection by humans and macaque monkeys reacts to unexpected changes of the image. This was explored using double step and search step tasks in which a target, presented alone or as a singleton in a visual search array, steps to a different location on infrequent, random trials. We report that human and macaque monkey performance are qualitatively indistinguishable. Performance is stochastic with the probability of producing a compensated saccade to the final target location decreasing with the delay of the step. Compensated saccades to the final target location are produced with latencies relative to the step that are comparable to or less than the average latency of saccades on trials with no target step. Noncompensated errors to the initial target location are produced with latencies less than the average latency of saccades on trials with no target step. Noncompensated saccades to the initial target location are followed by corrective saccades to the final target location following an intersaccade interval that decreases with the interval between the target step and the initiation of the noncompensated saccade. We show that this pattern of results cannot be accounted for by a race between two stochastically independent processes producing the saccade to the initial target location and another process producing the saccade to the final target location. However, performance can be accounted for by a race between three stochastically independent processes – a GO process producing the saccade to the initial target location, a STOP process interrupting that GO process, and another GO process producing the saccade to the final target location. Furthermore, if the STOP process and second GO process start at the same time, then the model can account for the incidence and latency of mid-flight corrections and rapid corrective saccades. This model provides a computational account of saccade production when the image changes unexpectedly.
Keywords: saccade, race model, latency, double step, search step, decision making
1. Introduction
The double step task has been used to investigate how targets for saccades are selected and how saccade initiation is controlled by stepping the target to a new location while a saccade to the initial location is prepared but not yet executed (Aslin and Shea, 1987; Becker and Jürgens, 1979; Komoda, Festinger, Phillips, Duckman and Young, 1973; Lisberger, Fuchs, King and Evinger, 1975; Ottes, Van Gisbergen and Eggermont, 1984; Van Gisbergen, Van Opstal and Roebroek; 1987). Many studies have found that performance is stochastic and that the probability of compensating for the target step by directing gaze to the final target location decreases with the delay of the step, presumably because of the advancing commitment to shift gaze to the initial target location. Studies have also found that corrective saccades are commonly produced after errors and that the latencies of these corrective saccades are short enough to require explanation in terms of preparing the corrective saccade before the consequences of the errant saccade can be registered.
We have employed a search step variant of the double step task to investigate the neural basis of saccade target selection in macaque monkeys. In the search step task the target is presented with distractors, and the step consists of an isoluminant color change such that the initial target becomes a distractor and one of the distractors becomes the target. We have found that visually responsive neurons in the frontal eye field select the location of the stepped target even if monkeys fail to compensate and direct gaze errantly to the initial target location (Murthy, Thompson and Schall, 2001). We have also found that movement-related activity in frontal eye field producing the corrective saccade begins before the consequences of the errant saccade to the initial target location could be registered (Murthy, Ray, Shorter-Jacobi, Priddy, Schall and Thompson, 2007).
The present study had three purposes. First, we investigated how performance of the search step task differs from performance of the double step task. This was necessary because the delay of saccade latency to a target in a search array as compared to single target may change performance (Findlay and Walker, 1999; Schiller, Sandell and Maunsell, 1987). It was also necessary to determine how the well-known effects of array size and similarity between the target and distractors affect responses to the target step (Wolfe, 1998). Second, we investigated whether humans and macaque monkeys perform differently in the double step and search step tasks. This was necessary because an earlier report indicated that macaque performance was different from human (Baizer and Bender, 1989). Third, we investigated whether performance could be fit by a race model because earlier reports had suggested that this was the case but had not tested it formally (Becker and Jürgens, 1979). We found that search step and double step performance are only quantitatively different, that human and macaque monkey performance are qualitatively indistinguishable and that performance can be accounted for by a race between a GO process producing the saccade to the initial target location, a STOP process interrupting that GO process and another, ongoing GO process producing the saccade to the final target location. These results provide new insights into the computations underlying saccade target selection and the control of saccade initiation.
2. Methods
2.1. Double step and search step tasks
The double step and search step tasks were run in blocks consisting of two randomly interleaved trial types: no-step and target-step trials (Figure 1). On no-step trials the target remained at the location it first appeared until it was fixated through a gaze shift. On target-step trials the target jumped to a different location before the gaze shift to the initial location was initiated. The no-step trials were necessary to prevent monkeys and humans from waiting excessively long for the target step. The target-step trials were necessary to investigate how the visual and saccade system respond to unexpected changes of the image during saccade preparation.
Figure 1.
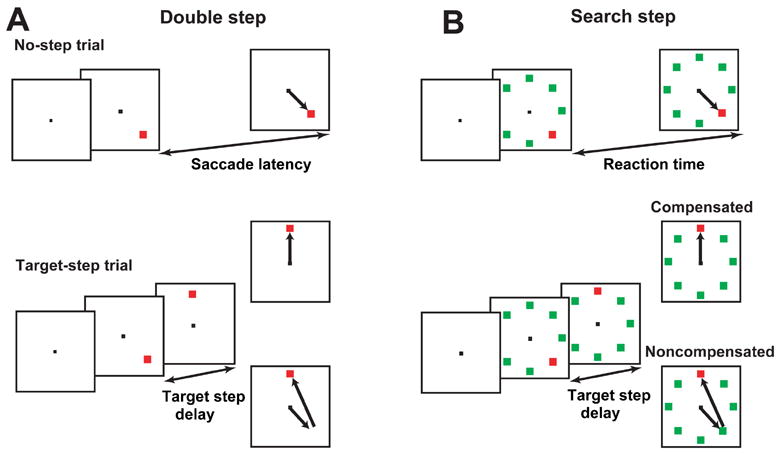
Double step (A) and search step (B) tasks. All trials began after fixation of the central spot with presentation of the colored target at one of 2, 4 or 8 locations without (A) or with (B) differently colored distractors. No-step trials conclude after gaze shifted to the target for a specified interval. In target-step trials, after a delay (TSD) the target stepped to another of the 2, 4 or 8 positions. Two responses were possible, indicated by arrows. Compensated saccades were gaze shifts to the final target location. Noncompensated saccades were gaze shifts to the initial target location. Noncompensated saccades were commonly followed by a corrective saccade to the new target position.
More specifically, in double step blocks the colored target appeared alone, and in search step blocks the target appeared among distractors of a uniformly different color from the target. On no-step trials the target appeared and remained in the same location until the saccade was made and the target was fixated for at least 400 ms. On target-step trials, the target stepped from its original location to a new location in the array after a variable delay, called target step delay (TSD). In the double step task, the target disappeared from its original location and reappeared at one of seven possible new locations. In the search step task, through an isoluminant color change the target became a distractor, and one of the distractors became a target. It is important to note that unlike other recent investigations of the effects of unexpected image changes on attention allocation and saccade production, no new stimuli appeared (e.g. van Zoest, Donk and Theeuwes, 2004).
Saccades to the final target location were referred to as compensated saccades (referred to by some other authors as final angle responses: Aslin and Shea, 1987; Becker and Jürgens, 1979) and were rewarded. Saccades to the initial target location were referred to as noncompensated saccades (referred to by some other authors as initial angle responses: Aslin and Shea, 1987; Becker and Jürgens, 1979). These were never rewarded. Noncompensated saccades were often followed by corrective saccades that directed gaze from the errant landing spot to the final target location. These too were never rewarded.
Target step delay was varied in a staircase fashion so that on average subjects produced an equal number of noncompensated and compensated saccades in step trials. Following compensated trials the TSD was increased. Following noncompensated trials the TSD was decreased. With each step of the staircase, TSD was increased or decreased by 47 ms for humans and 17 ms for macaques (TSDs were time-locked to a screen refresh and there were small differences in monitor refresh rates in the systems used to test humans and macaques). Accordingly, the shortest and longest TSDs did not yield as much data and so resulted in noisier data. Thus, step delays that did not amount to at least 2.5% of the total number step trials were not analyzed, leaving 4–5 step delays with sufficient data for each subject. Trials with anticipatory saccades with saccade latencies less than 50 ms were excluded from analyses.
2.2. Experimental design - humans
Three human subjects took part in 24 one-hour sessions (4 double step and 20 search step). Two of the subjects were familiar with the purpose of the experiment and one subject was naïve. The naïve subject was compensated for his time. All subjects had normal or corrected-to-normal vision. Informed consent was obtained before the experiment began and the experimental procedure was approved by the Vanderbilt University Institutional Review Board.
Each session consisted of five blocks of 96 trials, of which 40% were target-step trials. Task type (double step or search step) and target color (four possible colors) were blocked within a session. Within a search step session, the target could appear among 1, 3, or 7 distractors, yielding set sizes of 2, 4, and 8, respectively. The color similarity of the target to the distractors was also manipulated. Set size and similarity manipulations were interleaved within search step blocks. Stimuli were 1.5º squares at 9.5º eccentricity presented on a gray background (43.7 cd/m2). Four isoluminant (11.0 cd/m2) colors were used for these stimuli: green (CIE × = 291, Y = 600), gray-green (CIE × = 355 Y = 550), red (CIE × = 605 Y = 358) and gray-red (CIE × = 554, Y = 399). Humans first fixated on a black 0.5° cross which stayed on for the duration of the trial. Regardless of set size, targets were arranged with equal spacing and eccentricity about the fixation point, and orientation of the array varied between trials. On double-step blocks, the target disappeared from one location and immediately reappeared at a new location. On search-step blocks, the target changed through an isoluminant color change to a distractor at the initial location and a distractor changed to the target at the final location. The target step was always at least 90°, so in trials with set size eight, the target never stepped to an adjacent distractor position.
Eye position was recorded with an EyeLink II tracker (SR Research) at 250 Hz temporal resolution and a stated spatial resolution of 0.01°. An eye movement was classified as a saccade if velocity exceeded 35°/s. Correct no-step and compensated trials were rewarded with a tone.
2.3. Experimental design - monkeys
Data were also collected from three adult monkeys (2 Macaca mulatta and 1 M. radiata) weighing 7–12 kg. The animals were cared for in accordance with the National Institute of Health’s Guide for the Care and Use of Laboratory Animals and the guidelines of the Vanderbilt Animal Care and Use Committee. Data acquisition methods have been described elsewhere (Hanes and Schall, 1995). Monkeys were tested in 5–15 sessions of approximately 500–2000 trials each, of which 50% were step trials. Task type and target color were blocked within a session. No set size or target-distractor similarity manipulations were used. The search step task used homogeneous distractors and a chromatically dissimilar target in a set size of 8. Stimuli were 1° square stimuli at 10° eccentricity, presented on a gray background (2.0 cd/m2). Two isoluminant (10 cd/m2) colors were used for these stimuli: red (CIE × = 632, Y = 340) and green (CIE × = 279, Y = 615). Target and distractor color were alternated across sessions. The monkeys first fixated a 0.5° white square that disappeared at target onset. Stimuli could be located at any of the vertices of an octagon centered around the fixation point. On no-step trials the target remained at its original location until it was fixated through a gaze shift. Since the behavioral data was recorded during single-unit recordings in the frontal eye field, a restricted set of targets steps was used to increase the yield of data during the neurophysiological sessions (see Murthy et al, 2007 for further detail). Targets could step to and from the three array positions centered around and the three array positions opposite to a neuron’s response field, yielding 2*3*3 = 18 possible combinations of initial and final target positions. Thus, targets stepped into or out of response fields but never stepped within a response field. Target steps were randomized and were interleaved with no-steps trials in which target position was randomized and equiprobable across all locations.
Eye position was recorded with a scleral search coil. Experiments were under computer control using TEMPO/VIDEOSYNC software (Reflective Computing) that displayed visual stimuli, delivered juice, and sampled eye position at 250 Hz. An eye movement was classified as a saccade if velocity exceeded 30º /s. Correct no-step and compensated trials were rewarded with juice.
Examples of the eye movements that were produced in these tasks are shown in Figure 2. For both humans and monkeys, trials were classified as follows: On no-step trials, saccades with endpoints within 1.5º of the target were classified as correct (Figure 2A). On target-step trials, saccades with endpoints within 1.5º of the final target location were classified as compensated (Figure 2B). Those with endpoints within 1.5º of the initial target location were classified as noncompensated; these were often followed by unrewarded, corrective saccades to the final target location (Figure 2C). Infrequently, noncompensated saccades were interrupted in flight and replaced with a corrective gaze shift to the final target location (Figure 2D), or saccades were curved in the direction of the initial location (Figure 2E), these are referred to as partially compensated saccades. When a corrective saccade is present, the time between the noncompensated and corrective saccade is defined to be the intersaccade interval (ISI) (Figure 2C,D). Reprocessing time (RPT), the time available to process the target step before a noncompensated saccade is executed, is defined to be the time between the target step and the initiation the noncompensated saccade.
Figure 2.
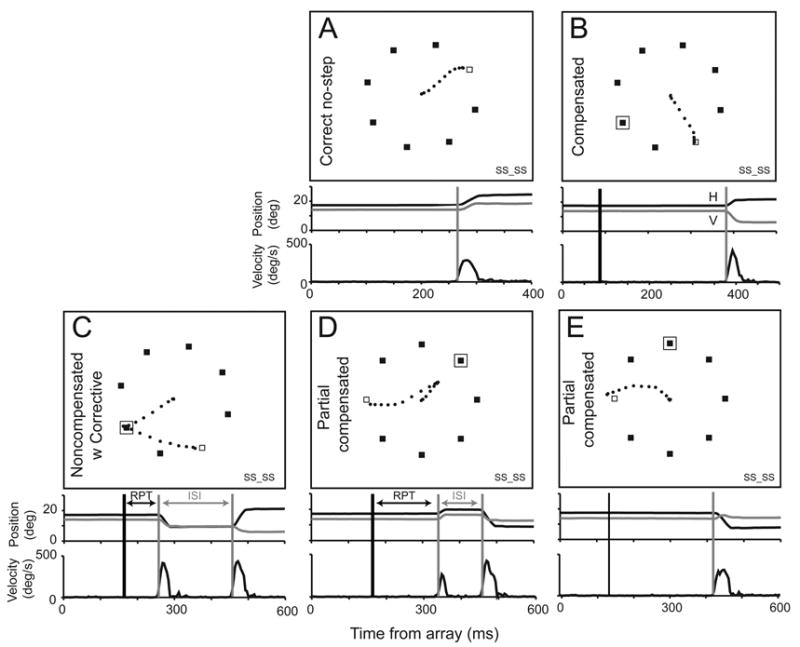
Responses on representative trials from a human search step session. Open boxes indicate target location in no-step trials and final target location in step trials. Filled boxes are distractors. A box around a distractor marks the initial target location. Horizontal (black) and vertical (gray) eye velocity (upper) and vectorial eye velocity (lower) are plotted relative to target presentation time on the graphs beneath the sample displays. Vertical gray lines mark the times of saccade initiation. Vertical black lines mark target step time. Reprocessing time interval (RPT) and intersaccade interval (ISI) between noncompensated and corrective saccades are indicated. A. Example correct no-step saccade. B. Example compensated saccade. C. Example noncompensated saccade followed by a corrective saccade. D. Example partial noncompensated saccade interrupted by a corrective saccade. E. Example midflight correction of noncompensated saccade.
2.4. Race model logic
Becker and Jürgens (1979) proposed that double step saccade performance could be understood as the outcome of a race between the processes producing saccades to the initial and final target locations. To our knowledge this has not been tested quantitatively. However, a race model has been used extensively and successfully to describe behavior in the stop signal (countermanding) task (Logan, 1994; Logan and Cowan, 1984; see also Boucher, Palmeri, Logan, and Schall, 2007) as well as in tasks requiring stopping one response and producing another (e.g., DeJong et al. 1995). To determine whether a formal race model could account for performance of the saccade double step and search step tasks, we adapted the race model originally formulated to describe performance in the stop-signal task. Performance of the stop signal task is accounted for by a race between a stochastic process producing the saccade to the target and a process that interrupts that motor plan. Here, we investigated whether performance of double step and search step tasks can be accounted for by a race between a process producing the saccade to the initial target location and another process producing the saccade to the final target location. Alternatively, it is possible that an intervening stop process must interrupt the first saccade plan before the second saccade can be produced.
Each stochastic process is described by a unique distribution of finish times that satisfy two assumptions. First, the finish times of the respective processes are stochastically independent of one another. Second, they are contextually independent; the finish times of one process are not affected by the presence of another process. Thus, the distribution of finish times of the first process is equivalent to the distribution of no-step saccade latencies (Figure 3A and B).
Figure 3.
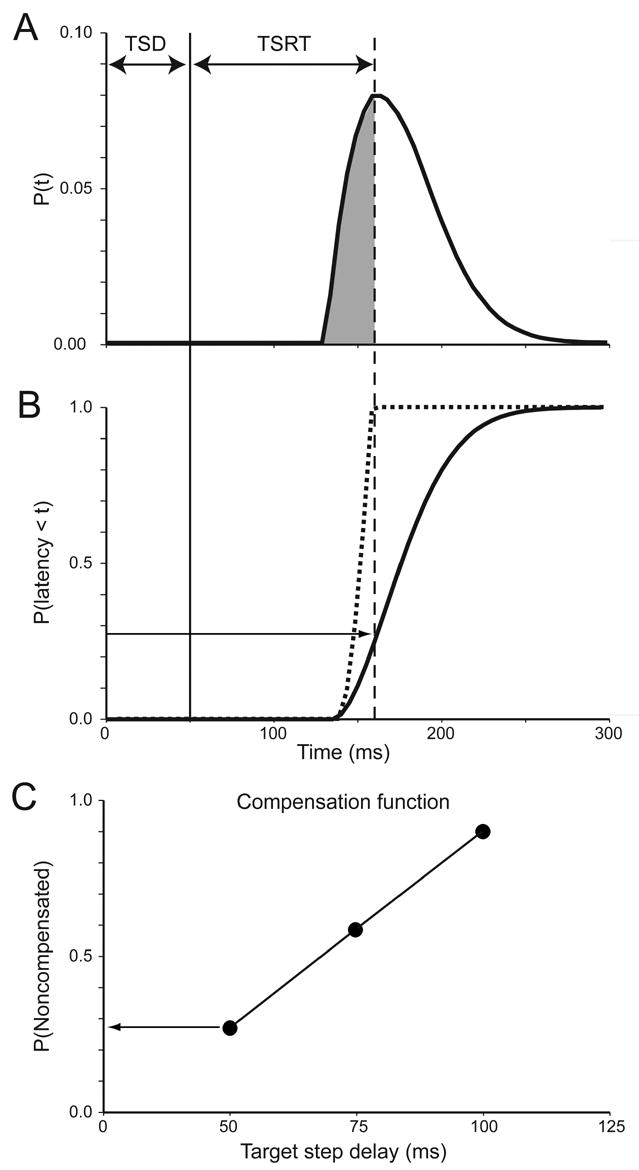
Relationship between saccade latency and probability of compensating for target step. A. Probability density distribution of latencies of saccades in no-step trials. B. Cumulative distribution of latencies of correct saccades in no-step trials (solid) and of errant noncompensated saccades (dashed). C. Inhibition function plots probability of not compensating for the target step as a function of target step delay. At the earliest target step delay (50 ms, solid vertical line in A, B), the subject failed to compensate for the target step on almost 30% of trials (horizontal arrows in B, C). The key observation motivating the race model is that these errors are produced with the shortest saccade latencies (dashed plot in B). In other words, noncompensated errors are those saccades produced with latencies shorter than the latency of a process that would interrupt the process producing the saccade to the initial target location. The duration of the interruption process can be estimated by determining the latency less than which the fraction of saccade latencies corresponds to the probability of noncompensated saccades at each target step delay. This interval is the target step reaction time (TSRT) (dashed vertical line in A, B).
This race model makes at least two specific predictions about performance in the double step and search step tasks. First, it predicts that stepping performance is a function of TSD. The compensation function plots the probability of failing to respond to the new target position (noncompensated saccade) as a function of TSD. When the target steps earlier (shorter TSD), the probability of making a noncompensated saccade is low. With increasing TSD the probability increases that subjects make an error through noncompensated saccades to the initial target location. Since an increasing proportion of the no-step distribution escape reprogramming, the longer TSD becomes, a larger proportion of noncompensated saccades will be executed at longer TSDs. Therefore the race model predicts a compensation function that increases monotonically from 0.0 when TSD is very short to approach 1.0 when TSD is very long. Examination of a subject’s compensation function provides an important check on performance; a bias or lack of sensitivity to the target step will result in a flat compensation function (Logan and Cowan, 1984).
Second, as TSDs get longer, an increasing proportion of the no-step distribution escapes reprogramming. This leads to distributions of noncompensated saccade latencies that incorporate an increasing fraction of the distribution of no-step saccade latencies. Thus, the race model predicts that with increasing TSD the distribution of noncompensated saccade latencies will progressively approach the distribution of no-step trial saccade latencies. Violations of stochastic independence of the finish times in the race model are revealed by departures from this prediction (e.g., Band, van der Molen and Logan, 2003; Logan, Cowan and Davis, 1984; Osman et al. 1986). In particular, if the racing processes inhibit each other, then noncompensated saccade latencies would be longer than no-step saccade latencies. This is observed very rarely (but see Hanes and Carpenter, 1999; Colonius, Özyurt and Arndt, 2001; Özyurt, Colonius and Arndt 2003).
Accounting for double-step saccade performance in terms of a race between GO and STOP processes affords a theoretical bridge to the well-known race model applied to stop signal task performance (Logan and Cowan, 1984; Logan 1994). The race model of countermanding performance provides a measure of the duration of the inhibition process referred to as stop signal reaction time. Conceptually and mathematically, TSRT corresponds to stop signal reaction time. Therefore, the methods used to estimate stop signal reaction time can be used as well to measure TSRT (Logan and Cowan, 1984; Logan, 1994; Hanes and Schall, 1995).
According to the race model applied to the double step saccade task, performance on a target-step trial is determined by the outcome of a race between the process producing the saccade to the original target location and the process(es) interrupting that saccade and producing the saccade to the final target location. Two aspects of the behavioral performance data were used to estimate TSRT. The first is the distribution of saccade latencies collected on no step trials; this is the distribution of finish times of the first GO process (figure 3). The second is the fraction of noncompensated trials for each target step delay. Referred to as the compensation function, this is the fraction of trials in which the first GO process finished before the STOP process finished. We used two methods to estimate TSRT for each session. First and most simply, according to Logan and Cowan (1984), mean TSRT equals the difference between the mean saccade latency during no step trials and the mean of the compensation function. The mean of the compensation function is determined by treating the compensation function as a cumulative distribution and converting it to a probability density distribution. The mean of the compensation function is simply the mean of this probability density distribution.
The second method provides an estimate of the TSRT at each stop-signal delay. By this method TSRT is estimated by integrating the distribution of latencies on no step trials, beginning at the time of target presentation, until the integral equals the proportion of noncompensated saccades observed at that target step delay. The saccade latency at the integrated value yielding the appropriate fraction of noncompensated trials measures the finish time of the race, i.e., the longest saccade latency in which the GO process could finish before the deadline imposed by the STOP process for that stop-signal delay. Thus, the time between the appearance of the target step and this deadline represents the TSRT at this target step delay. In practice, TSRT is determined by first rank ordering the no step trial saccade latencies. The ith saccade latency is then chosen, where i is determined by multiplying the probability of a noncompensated trial at a given target step delay multiplied by the total number of no step trials. The TSRT is the difference between the ith saccade latency and the target step delay.
The TSRT estimated using the mean of the compensation function and by integrating the no step trial saccade latency distribution can vary somewhat. Further, the TSRT estimated with data from early or late target step delays can be unreliable (Hanes and Schall 1995). Therefore, we believe the most reliable overall estimate of TSRT for a session is the average of the TSRT derived from both methods.
We analyzed the patterns of behavior from both search and double step tasks to determine whether performance could be explained in terms of an independent race model.
3. Results
3.1. Effects of search and target-distractor similarity on saccade latency
Before evaluating whether performance conforms to the predictions of the race model and testing alternative race model architectures, we must first describe the effects of the experimental manipulations. We compared the latencies of saccades produced in blocks of double step trials in which the target appeared alone to the latencies of saccades produced in blocks of search step trials in which the target appeared with distractors. Human subjects were also tested with different search array set sizes with distractors that were more or less similar to the singleton target. Figure 4 compares for each human and monkey subject the mean latencies of no-step trial saccades, noncompensated saccades, and compensated saccades in blocks of double step and search step trials. As compensated saccades are made in response to the target step, the latencies of compensated saccades were measured relative to TSD. The latencies were submitted to a 2 (species - macaque or human) × 2 (task type - double step or search step) × 3 (type of trial - no step, compensated or noncompensated) mixed design (between- and within-subject effects) repeated measures univariate ANOVA; for this and all subsequent tests, statistical significance was determined using an alpha level of p < .05. Several trends were significant. First, there was a within-subject main effect of the presence of distractors on saccade latency (F(1, 4) = 9.804, MSE = 10167). We also found a significant interaction of distractor presence and species (F(1,4) = 10.164, MSE = 10540); in other words, it appeared the monkeys and humans exhibited different patterns of saccade latencies when the target was presented alone or with distractors, but we believe this is incidental. All human subjects and two of the three monkeys exhibited saccade latencies during search step that were systematically longer than those in double step. Second, overall human and macaque performance was not significantly different; there was no significant between-subject main effect of species (F(1, 4) = 1.642, p = 0.269, MSE = 9557). Third, individual differences were evident in the monkeys’ performance. One monkey (F) exhibited no difference in saccade latencies in double step and search step blocks (2 (task type) × 3 (response type) mixed design (between- and within-session effects) repeated measures univariate ANOVA F(1,40 = 0.096, MSE = 224630, p = 0.75), and another monkey (L) exhibited significantly longer saccade latencies during double step as compared to search step blocks (F(1,40 = 77.6, MSE = 112124). The monkeys probably delayed saccade initiation when the target appeared without distractors because, unlike humans, they had been trained to perform memory-guided saccades to a target presented alone. Fourth, there was a within-subject main effect of the type of trial (F(2, 8) = 9.804 MSE = 10874). Specifically, the latencies of noncompensated saccades were less than the latencies of saccades in no-step trials, and the latencies of compensated saccades measured relative to the target step were less than the latencies of saccades on no-step trials.
Figure 4.
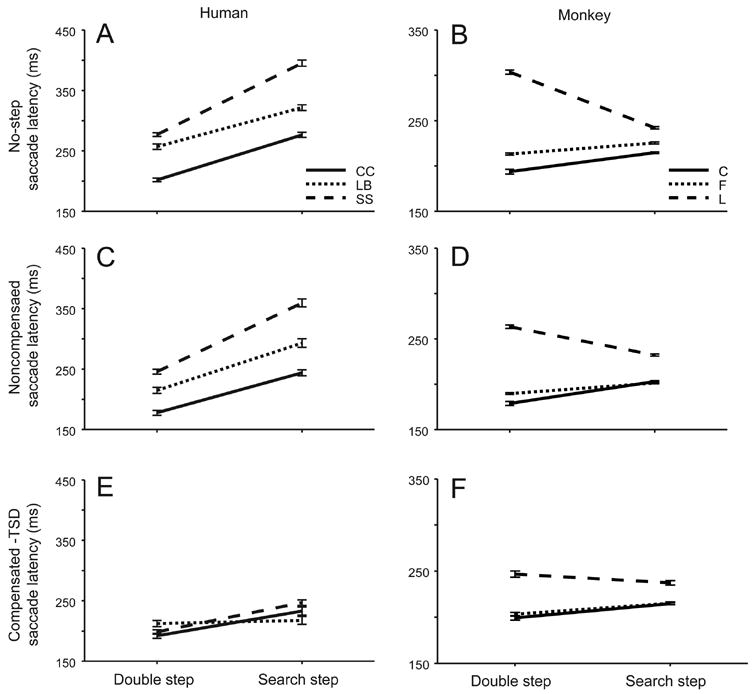
Mean latencies of no-step (A, B), noncompensated (C, D), and compensated (E, F) saccades for individual human and macaque subjects as a function of double step or search step blocks. Compensated saccade latencies are measured relative to the target step. Line types for each subject indicated in legend. Error bars are within-subject 95% confidence intervals.
Figure 5 compares for each human subject the mean latencies of no-step trial saccades, noncompensated saccades and compensated saccades as a function of set size (2, 4, 8) and target-distractor similarity. The latencies were submitted to a 2 (similarity) × 3 (set size) × 3 (type of trial - no step, compensated or noncompensated) between-subject repeated measures univariate ANOVA. Several results were evident. First, saccade latencies were elevated when the target and distractors were more similar in color (2 (similarity) × 3 (set size) × 3 (response type) repeated measures univariate ANOVA subject CC: F(1,19) = 39.9, MSE = 61490; subject LB: F(1,19) = 17.6, MSE = 37587; subject SS: F(1,19) = 26.5, MSE = 163527). Second, though, there was not a significant overall effect of set size (F(2,4) = 0.87, MSE = 710, p = 0.918), target-distractor similarity (F(2,4) = 5.701, MSE = 4431, p = 0.140) nor a significant interaction of set size and target-distractor similarity (F(2,4) = 1.769, MSE = 595, p = 0.282). One of the three subjects exhibited a significant elevation of saccade latency with set size when the target was similar to distractors but not when they were dissimilar (subject CC: F(2,19) = 16.8, MSE = 25965). Third, there was a significant main effect of response type (F(2,4) = 9.719, MSE = 2922); saccade latencies in compensated and noncompensated trials were significantly shorter than those in no-step trials. This was the case for all three subjects (subject CC: F(2,19) = 22.0, MSE = 34023; subject LB: F(2,19) = 28.7, MSE = 61448; subject SS: F(2,19) = 33.8, MSE = 209253). Thus, saccade latencies were elevated when the target and distractors were more similar in color, but no consistent effect of set size on reaction time was present
Figure 5.
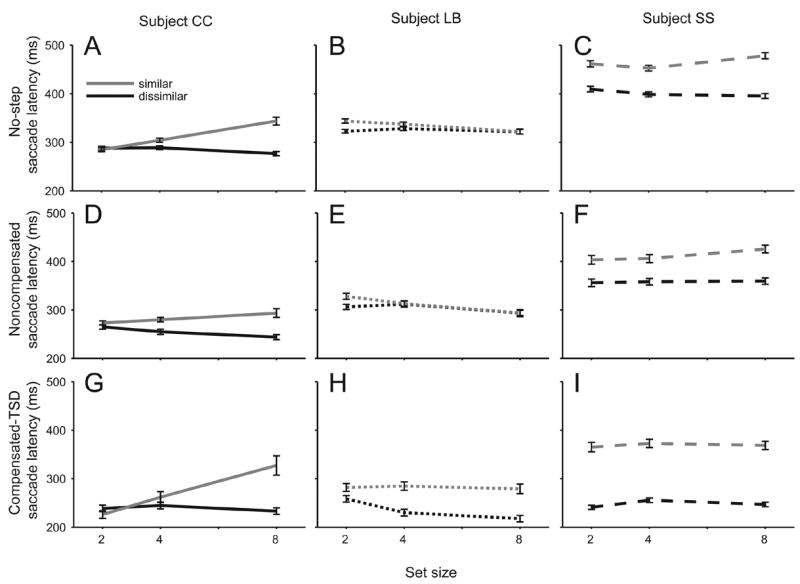
Mean latency of no-step (A–C), noncompensated (D–F), and compensated (G–I) saccades as a function of set size (x axis) and target-distractor similarity (individual lines). Black lines indicate less similar target distractor colors; gray lines indicate similar distractor colors. Line types for subjects are the same as Figure 4. Error bars are within-subject 95% confidence intervals.
3.2. Target step performance: comparison to race model predictions
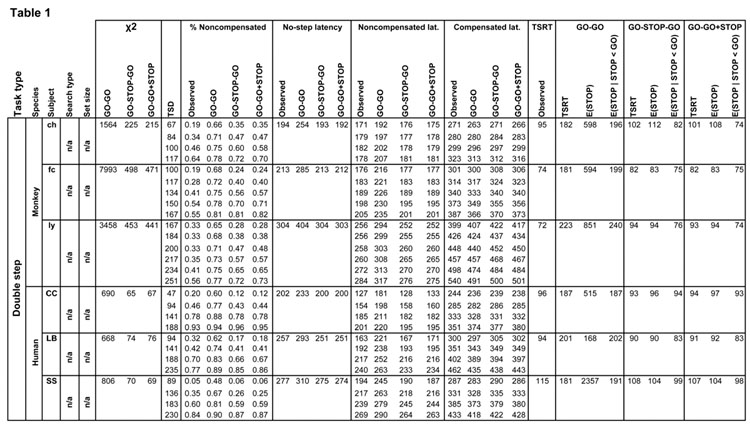
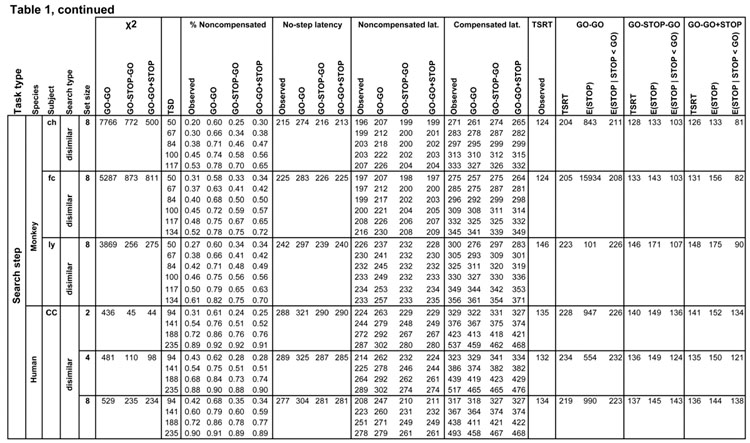
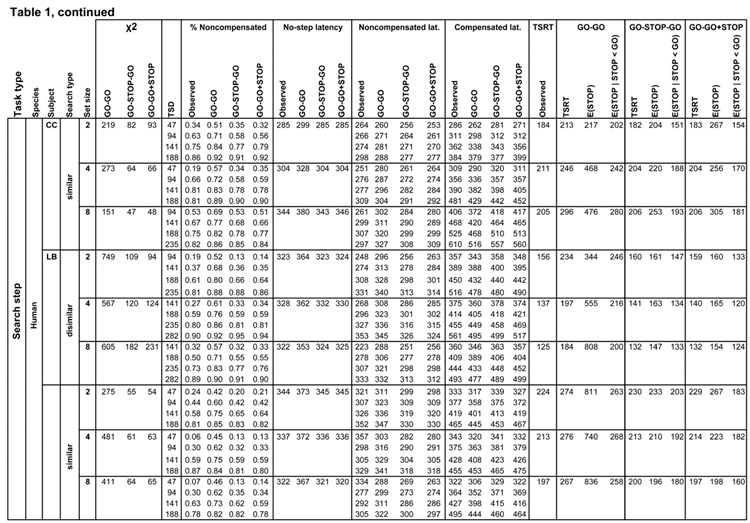
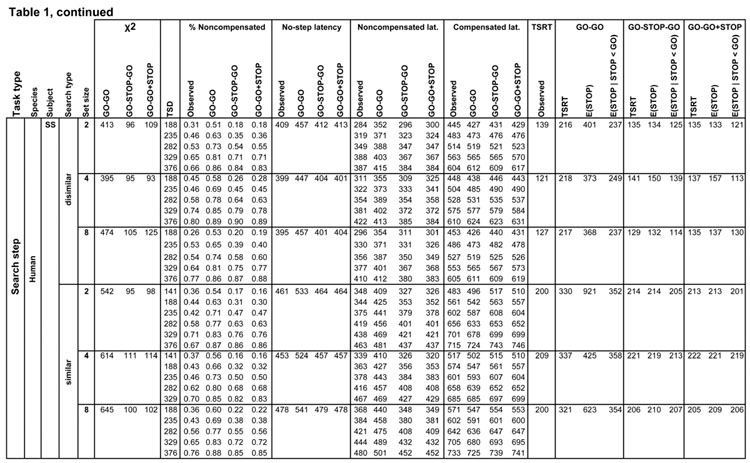
The race model applies to data of a particular form; in other words, it entails certain requirements about the quality of performance. In particular, the race model predicts a monotonically increasing compensation function as a function of TSD. Also, the independence of the racing processes predicts that the latencies of noncompensated saccades must not exceed the latencies of no-step trials saccades. This section will demonstrate that the performance of humans and monkeys performing both double step and search step conforms to these predictions. Performance of a representative human subject ‘SS’ will be used for illustration, and the results for all subjects and conditions are detailed in Table 1.
Table 1.
Measures of observed and predicted behavior for all subjects and conditions. Rows list each task by species, subject and search condition, further divided by step delay. Columns from left to right are chi-squared model fit values for the three competing architectures, step delay, observed and predicted values of the compensation function, observed and predicted average latencies (measured from the time of array presentation) for no step, noncompensated and compensated saccades, and observed and predicted TSRT, with finish times of the process interrupting the first GO process for each architecture.
Figure 6 shows the compensation function for this subject’s double step performance. As expected, the probability of not compensating for the target step increased monotonically from close to 0.0 at the shortest TSD toward 1.0 at the longest TSD.
Figure 6.
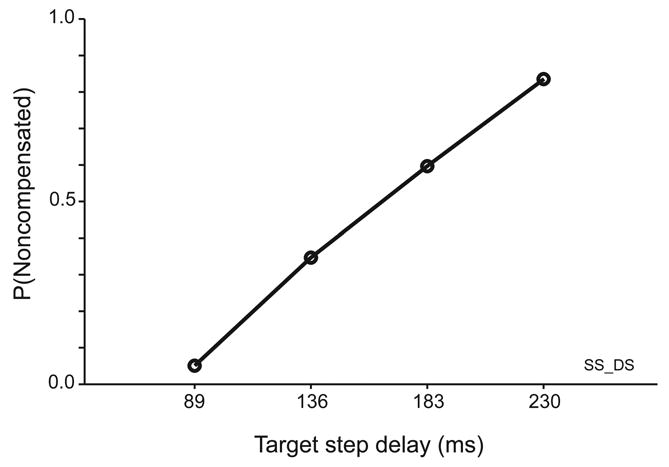
Compensation function for a representative human subject performing the double step task.
To compare the distributions of noncompensated saccade latencies with the predictions of the race model, Figure 7A plots the cumulative distributions of noncompensated saccade latencies produced following four TSDs along with the cumulative distribution of saccade latencies in no-step trials for this representative subject. Two trends are characteristic of the data from all subjects, both human and monkey. First, the latencies of noncompensated saccades are shorter than the latencies of no-step trial saccades. Second, noncompensated saccades produced at shorter TSDs had shorter latencies than those produced at longer TSDs.
Figure 7.
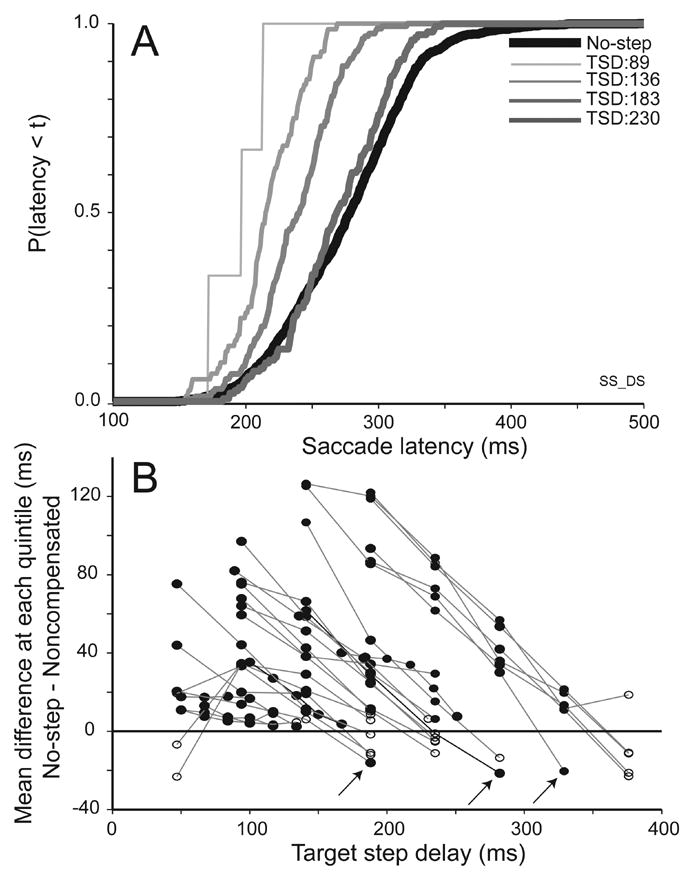
Analysis of noncompensated saccade latencies. A. Comparison of cumulative distributions of latencies of no-step (black) and noncompensated saccades (gray) produced following successively longer TSDs for a representative human subject performing the double step task. Noncompensated saccade latencies are as short as the shortest no-step latencies and increase progressively with TSD. B. The race model predicts that the latencies of all noncompensated saccades will be less than the latencies of no-step trial saccades. Mean quintile difference between no-step and noncompensated saccade latency distributions plotted as a function of TSD for all data sets collected from both macaques and humans. Positive values indicate sessions in which the noncompensated saccade latencies were faster than no-step saccade latencies. Lines connect TSDs for the same session, where solid lines indicate human and dotted indicate monkey data. Solid circles indicate a difference that was significant according to a Kolomorogov-Smirnoff test (p < 0.05); empty circles indicate non-significant differences. Only three noncompensated saccade latency distributions were faster than the no-step saccade latency distributions (highlighted by the arrows); these all occur at the longest TSDs sampled in a session
A fundamental motivation of the description of these data in terms of an independent race between the process producing the saccade to the initial target location and a process interrupting that saccade plan is the observation that noncompensated saccade latencies rarely if ever exceed no-step saccade latencies. If noncompensated saccade latencies routinely exceeded no-step saccade latencies, this would be evidence that the processes responding to the target step slowed the process producing the initial saccade. Such an interaction would violate the fundamental assumption of stochastic independence of the finish times of the racing processes (Colonius et al., 2001). To carry out the most sensitive test possible for such violations, we performed a Kolmorogoff-Smirnoff test to assess whether the noncompensated saccade latency distribution was significantly different from the no-step saccade latency distribution. Figure 7B illustrates the results of this analysis for all 27 double step and search step sessions of both monkeys and humans. Each point plots the difference between the no-step and noncompensated latency cumulative distributions at each TSD. To evaluate the difference between the distributions, the measure was defined to be the mean difference of the values at their respective quintiles. In a given session, there is one noncompensated distribution per TSD, and lines between the points connect data from the same session. These points are filled if the noncompensated distribution was significantly different from the no-step distribution according to a Kolmorogoff-Smirnoff test, and are not filled otherwise.
Out of 101 target step delays, in only three delays across three different sessions were the latencies of noncompensated saccades significantly longer than those in no-step trials; this occurred in three different subjects. The fact that the overwhelming majority of noncompensated saccade latencies do not exceed no-step saccade latencies provides convincing evidence of stochastic independence, establishing the basis for applying a race model analysis of the data. As further evidence of the independence of these processes, the few violations occur only at the longest TSD. If the processes interacted, one would expect greater delays for noncompensated saccade latencies at the shortest TSD, because the processes have the longest time to interact. Instead, these few noncompensated delays occurred only at the longest step delays, which is not consistent with interacting processes. Thus, the latencies of noncompensated error saccades correspond to what is predicted if they are the outcome of a race between processes producing the alternative saccades.
3.3. Target step reaction time
As previously discussed, application of the race model to stepping performance affords a measurement of the time taken to cancel the first saccade in order to produce the compensated saccade. This perspective on these data and analysis are motivated by the application of the race model to characterize performance in stop signal tasks by stop signal reaction time (Logan and Cowan 1984). In parallel, we define the time to interrupt the incomplete motor program in response to the target step as target step reaction time (TSRT). This quantity is determined as described in Methods. We now analyze whether TSRT was different in double step as opposed to search step blocks and whether TSRT is affected by search array set size or target-distractor similarity. Figure 8A plots mean TSRT for double step and search step performance for monkeys and humans. TSRT was ~40 ms longer during search step blocks as compared to double step blocks for both humans and monkeys. A 2 (task type) × 2 (species) repeated measures mixed design (within- and between-subject effects) ANOVA demonstrated a significant within-subject effect of the presence of distractors (F(1,2) = 30.544, MSE = 4236). However, TSRT did not differ between humans and macaques (F(1,4) = 0.498, MSE = 61, p = 0.519). Figure 8B shows mean TSRT for humans performing search step with different set sizes and target-distractor similarity. TSRT was significantly longer in trials with similar target and distractors than in trials with dissimilar target and distractors (F(1,2) = 1057.917, MSE = 22400), but TSRT did not change with set size (F(2,4) = 0.545, MSE = 112, p = 0.617).
Figure 8.
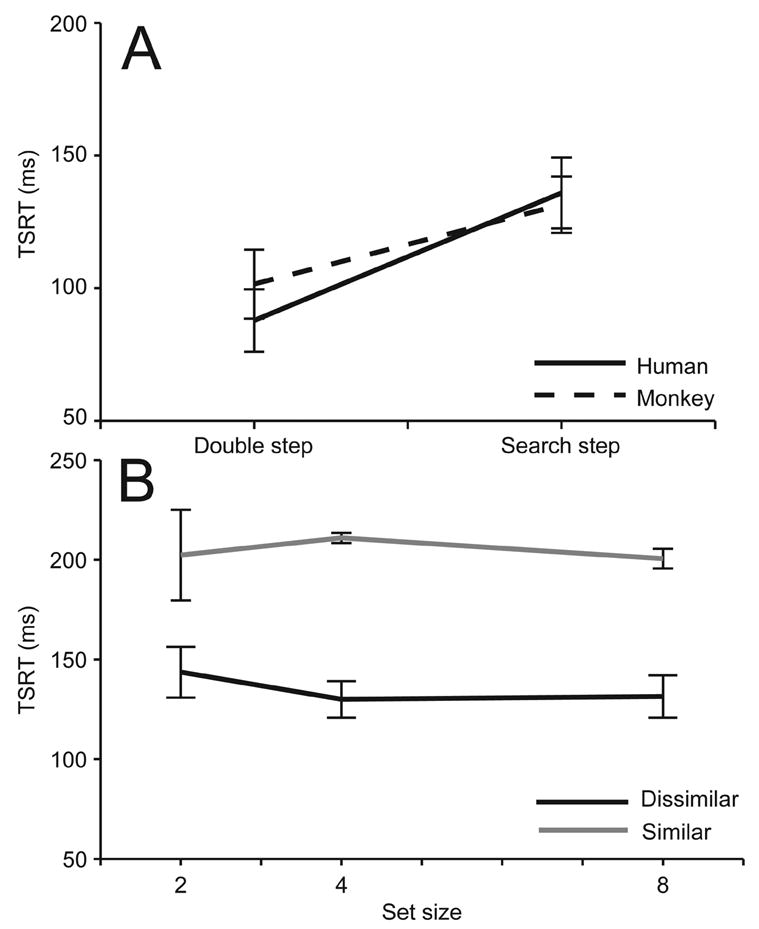
Effects of manipulations on TSRT. A. TSRT for humans and monkeys as a function of presence of distractors in search step compared to double step. B. TSRT for humans as a function of search array size and target-distractor similarity. Error bars are average within-subject 95% confidence intervals. TSRT is longer when distractors are present and longer still when they resemble the target.
We found that TSRT measured by the method of integration decreased with TSD (data not shown). This is observed commonly in measurement of stop signal reaction time. While it may be an indication that the independence premise of the race model is violated, it is most likely due to the sampling from the no-step trial saccade latency distribution (Logan and Cowan, 1984; Band et al. 2003).
3.4. Compensated saccade latencies
Earlier research reported a ~30 ms delay of compensated saccade latencies on step trials measured relative to the target step, as compared to the latencies of saccades on no-step trials (Aslin and Shea, 1987; Becker and Jürgens, 1979). This difference was interpreted as evidence for a cost entailed by canceling the saccade to the initial target location before the saccade to the final target location could be prepared. Figure 9A compares the distributions of latencies of compensated saccades at four TSDs with those observed in no-step trials measured from the time of initial array presentation. Because compensated saccades are responses to the target step, their latencies measured relative to target presentation increase with TSD. However, because the compensated saccades are made in response to the target step, one can compare their latencies with no-step saccade latencies by subtracting TSD from the compensated latencies (Figure 9B). For this subject, compensated saccades to the final target location occur with latencies markedly less than those of no-step saccades.
Figure 9.
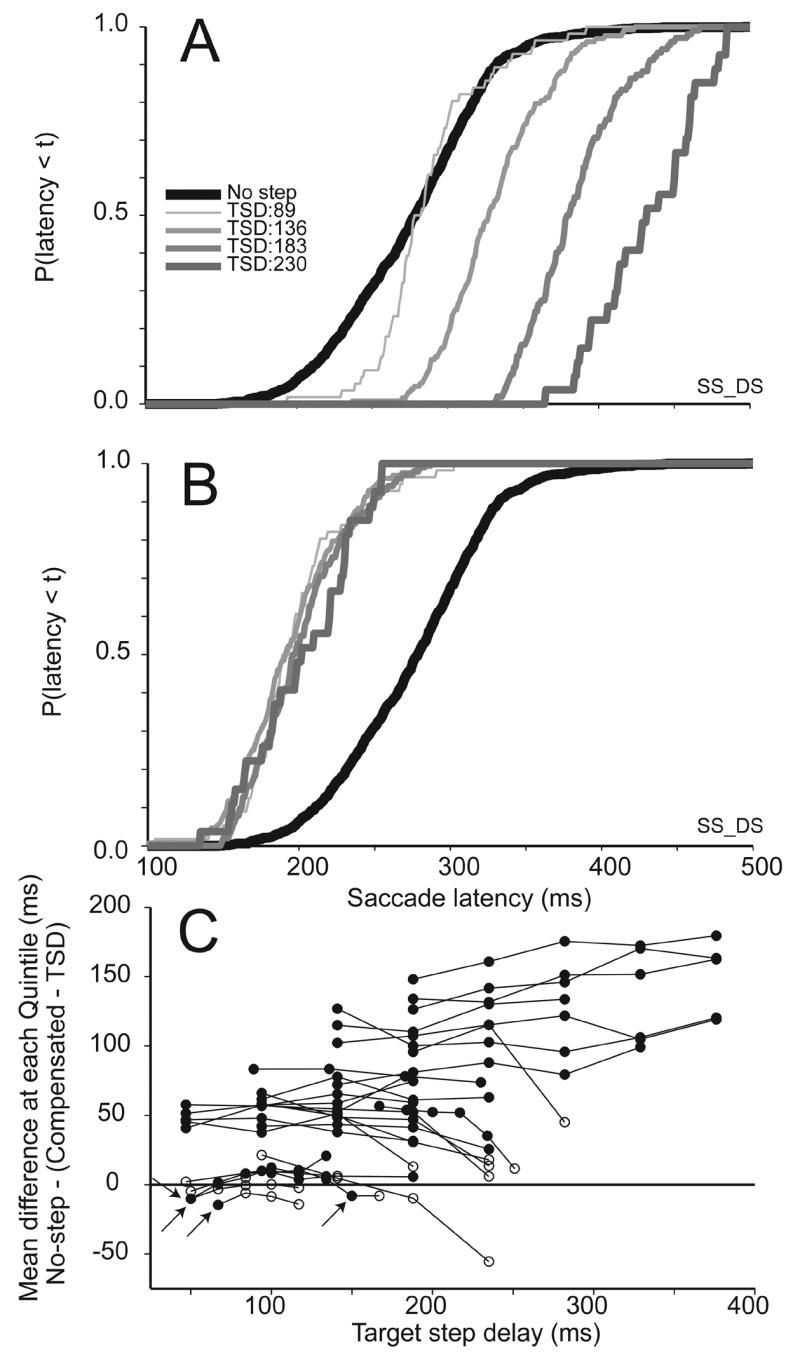
Analysis of compensated saccade latencies. A. Comparison of cumulative distributions of latencies of no-step (black) and compensated saccades (gray) produced following successively longer TSDs for a representative human subject performing the double step task. The top panel plots compensated saccade latencies relative to initial presentation of the target. B. Cumulative distributions of compensated saccade latencies measured relative to the target step. Relative to the initial presentation of the target, compensated saccade latencies increase progressively with TSD. Relative to the target step, compensated saccade latencies have a common distribution that for this subject is shorter than that of no-step saccades. C. Mean quintile difference between distributions of no-step saccade latencies and distributions of compensated saccade latencies relative to the target step as a function of TSD for all data sets collected with both macaques and humans. Positive values indicate sessions in which the compensated saccade latencies relative to the target step were faster than no-step saccade latencies. Lines connect TSDs for the same session,where solid lines indicate human and dotted indicate monkey data. . Solid circles indicate a difference that was significant according to a t-test; empty circles indicate non-significant differences. Only four compensated saccade latency distributions were slower than the no-step saccade latency distributions (highlighted by the arrows); these tend to occur at the shortest TSDs sampled in a session.
To see if this trend is consistent across subjects, Figure 9C shows results of a comparison of compensated saccade latencies (with TSD subtracted) and no-step saccade latencies for each TSD from all human and monkey double step and search step sessions. Again, each point plots the difference between the latency of no-step trial saccades and the latency of compensated trial saccades relative to the target step, measured as the mean difference at their quintiles as a function of TSD. Lines connect points from the same subject and condition. For this analysis, we are interested in a delay measured as a difference of the central tendencies (means) of the distributions, so a t-test was used to determine if the means were significantly different from each other. Solid points indicate a significant difference and empty points indicate a non-significant difference. Points less than zero indicate a delay of the compensated saccades relative to no-step saccades, while points above zero indicate compensated saccade latencies that are faster than no-step saccade latencies.
Out of 101 delays, only four TSDs over four different sessions yielded data in which compensated saccades were produced with latencies significantly greater than the no-step distribution; these occurred across three different subjects, reducing further the sense of any trend. In general, then, compensated saccades when measured from the time of the step, had latencies significantly shorter than those observed in no-step trials. This absence of a delay, consistently seen across task types and species, suggests that there may be insufficient time for an explicit stopping process to occur before beginning the preparation of the second saccade.
3.5. Corrective saccades
Another feature of saccade production in the double step and search step tasks is the occurrence of corrective saccades after noncompensated errors (e.g., Becker and Jürgens, 1979). In fact, many investigators use double step target presentation to investigate how the visuomotor system performs coordinate transformations to accomplish these corrective saccades (e.g., Colby and Goldberg, 1999; Andersen and Buneo, 2002). We were more interested in determining the incidence, timecourse, and latencies of these corrective saccades. Becker and Jürgens (1979) showed that the interval between error and corrective saccades in a double step task varied with the latency of the first saccade relative to the target step. In this interval the visual system could update its representation of the image to identify the new target location, but once the first saccade was initiated, visual processing could not continue. The longer this interval (that is, the longer the latency of the error saccade to the initial target location), the more time was available to locate the new target. Accordingly, if an error was made, then the more time available to process the target step, the earlier the error could be corrected. In fact, this is just what has been observed. The time between the initial noncompensated saccade and the corrective saccade will be referred to as the intersaccade interval (ISI). Previous work has demonstrated that ISI is a function of the interval between the initiation of the noncompensated saccade and the target step (Becker and Jürgens, 1979). We refer to the interval between the initiation of the noncompensated saccade and the target step as reprocessing time because it is the period of time available for a target that stepped to the new location to be reprocessed (Becker and Jürgens, 1979).
Figure 10 plots the intersaccade interval between the noncompensated saccades and subsequent corrective saccades as a function of reprocessing time for a representative subject. Most of the noncompensated saccades terminated at the initial target location and were followed by corrective saccades that were produced earlier with respect to the start of the noncompensated saccade the later the noncompensated saccade was initiated after the target step. In other words, ISI decreases as noncompensated saccade latency increases. The few noncompensated trials that did not culminate in a corrective saccade were from the human hard search condition in which the subject simply failed to locate the target. A few of the noncompensated saccades, called partial compensated saccades, were interrupted mid-flight and had amplitudes less than the distance to the initial target location (Figure 10B); these may have curved trajectories. These tended to be observed at the longest reprocessing time and were always followed by corrective saccades to the final target location and these were initiated an unusually short time after the noncompensated saccade. A significant negative correlation between ISI and RPT was observed in nearly all sessions for noncompensated saccades for both human and monkey, for double step and search step regardless of set size or target-distractor similarity (Table 2). These observations indicate that the corrective saccade was prepared in parallel with the noncompensated saccade or at least that the corrective saccades can be produced in much less time than typical saccade latencies (Murthy et al., 2007).
Figure 10.
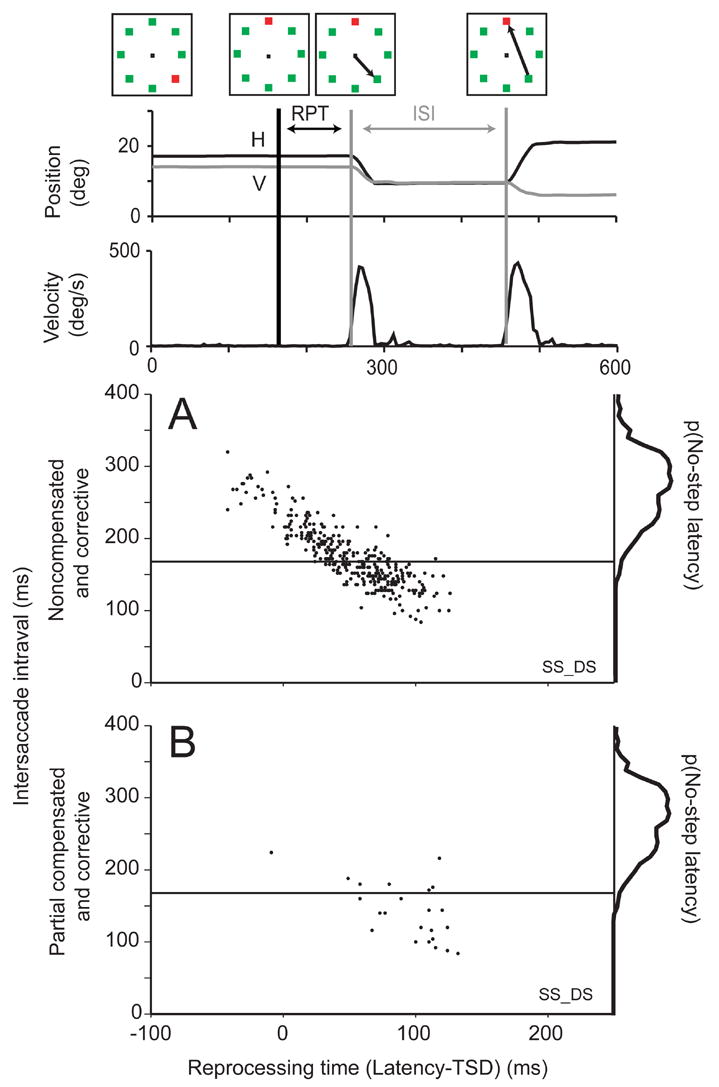
Analysis of corrective saccade latencies. Top diagram illustrates sequence of events in a representative noncompensated trial. The interval between noncompensated saccades and subsequent corrective saccade (referred to as intersaccade interval: ISI) is plotted as a function of the interval from target step until initiation of the noncompensated saccade (referred to as reprocessing time: RPT) for complete (A) and partial (B) noncompensated saccades. For reference, marginal distribution shows density of no-step saccade latencies. Horizontal line shows the first percentile of no-step responses.
Table 2.
Correlation between intersaccade interval (ISI) and reprocessing time (RPT) for all subjects and conditions. The left column indicates correlations for noncompensated saccades and right column indicates correlations for partially compensated saccades. Note prevalence of negative correlations indicating parallel processing of saccades. Starred correlation values indicate significance at p < 0.05 level.
| Subject | Simiarity | Set size | Noncompensated | Partially compensated | |
|---|---|---|---|---|---|
| Double step |
CC
LB SS |
n/a | n/a | −0.78*
−0.69* −0.87* |
−0.42
−0.46* −0.60* |
| n/a | n/a | ||||
| n/a | n/a | ||||
| Search step | CC | disimilar |
2
4 8 |
−0.84*
−0.81* −0.86* |
−0.76*
−0.58* −0.86* |
| similar |
2
4 8 |
−0.47*
−0.36* −0.34* |
−0.28
0.08 −0.07 |
||
| LB | disimilar |
2
4 8 |
−0.39*
−0.07* −0.69* |
−0.84*
−0.73* −0.65* |
|
| similar |
2
4 8 |
−0.15*
−0.15* −0.29* |
−0.05
−0.62* 0.05 |
||
| SS | disimilar |
2
4 8 |
−0.84*
−0.85* −0.79* |
−0.97*
−0.77* −0.52* |
|
| similar |
2
4 8 |
−0.44*
−0.53* −0.32 |
−0.25
0.06 −0.43 |
3.6.1 Fitting race models to data
So far, we have shown that human and macaque production of saccades in double step and search step tasks is consistent with the predictions of an independent race model. In fact, the data obtained from monkeys and humans performing double step and search step saccades replicates in major respects what has been collected in earlier studies of human performance. It has been suggested that such data can be described as the outcome of a race between competing processes (Becker and Jürgens, 1979), but this has not been tested formally. Also, the nature of this reprogramming process is still unclear. On the one hand, the race has been conceived of as occurring between the two processes producing the alternative saccades to the initial and final target location. On the other hand, a delay of compensated saccades relative to no-step saccade latencies has been taken as evidence for a stopping process (Aslin and Shea, 1987; Becker and Jürgens, 1979). Yet, in our data no such delay was observed. In fact, we observed for most humans and macaques systematically shorter latencies of compensated saccades relative to the step. Therefore, through quantitative model fitting we have tested whether double step and search step performance can be accounted for by a race between independent processes, and what processes must participate in that race.
Figure 11 diagrams the three alternative architectures we analyzed. The tips of the arrows in figure 11 represent the finish times of the processes. The first architecture is simply a race between the process producing the saccade to the initial target location (GO1) and the process producing the saccade to the final target location (GO2), so this will be referred to as the GO-GO architecture. GO1 starts when the target appears, and GO2 starts when the target steps. It is well-known that an architecture like this will result in latencies in step trials that are shorter than those in no-step trials (Townsend and Ashby, 1983). The fact that both noncompensated and compensated saccades had latencies less than the no-step saccade latencies suggests that this architecture may be sufficient to account for the observed data.
Figure 11.
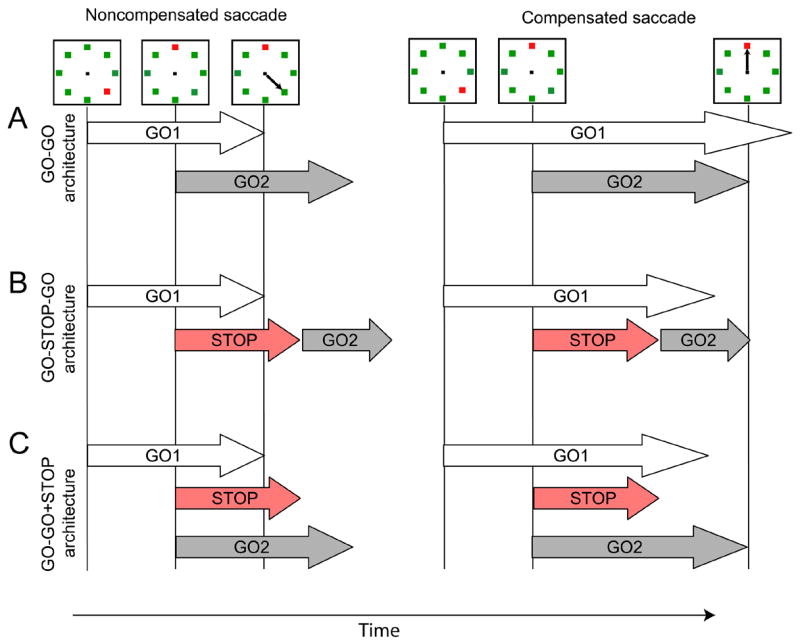
Alternative race architectures producing noncompensated (left) and compensated (right) saccades. The arrows are representative finish times of stochastic processes as labeled. A. GO-GO architecture. Performance is the outcome of a race between the GO process producing the saccade to the initial target location (GO1) and the GO process producing the saccade to the final target location (GO2). B. GO-STOP-GO architecture. Compensated saccades are produced only if a STOP process finishes before the GO process producing the saccade to the initial target location (GO1) whereupon the GO process producing the saccade to the final target location (GO2) begins. C. GO-GO-STOP architecture. Compensated saccades are produced only if a STOP process finishes before the GO process producing the saccade to the initial target location (GO1), but the GO process producing the saccade to the final target location (GO2) begins at the same time as the STOP process. This creates the possibility of GO2 finishing after GO 1 but before STOP.
Alternatively, the previous evidence for a cost associated with producing compensated saccades (Aslin and Shea, 1987; Becker and Jürgens, 1979) suggests that a STOP process must be included that interrupts the GO1 process and delays initiation of the second saccade. We investigated two architectures that included a STOP process. In the first, STOP must interrupt the GO1 process before the GO2 process can begin; this will be referred to as the GO-STOP-GO architecture. In the second architecture, the GO2 process began synchronously with the STOP process; this will be referred to as the GO-GO+STOP architecture.
To evaluate these three architectures, we quantitatively fitted Monte Carlo simulations of these architectures to the data collected from the individual monkeys and humans. First, the finish times of each racing process were drawn from independent Weibull distributions. These finish times were taken as the saccade latency which would include all afferent and efferent delays. The Weibull distribution was chosen because it is easily parameterized and provides a good account of observed saccade latency distributions (Becker, 1989; Van Zandt, 2000). The Weibull distributions were defined by three parameters according to the following equation:
The shape parameter (α) affects the shape of the distribution of finish times, ranging from exponential for α < 1 to nearly Gaussian with increasing magnitude of α. The scale parameter (β) largely affects the variability of the distribution of finish times. The positive location parameter (μ) shifts the lower bound of the distribution away from zero. For modeling data from each human and monkey, we allowed the GO1, GO2, and STOP Weibull distributions to have different shape, scale, and location parameter values.
We modeled the no-step condition and each of the target-step conditions using a Monte Carlo simulation with 50,000 trials per condition. On each simulated trial, finish times were sampled from the GO1 Weibull distribution, the GO2 Weibull distribution, and the STOP Weibull distribution (for the two architectures that assumed a STOP process). We denote a particular finish time sampled from the GO1 Weibull distribution as go1, from GO2 as go2, and from STOP as stop. From these sampled finish times, the predicted response (compensated or noncompensated) and saccade latency on that trial were generated for different architectures using the rules described in the next paragraph. For all architectures, the distribution of latencies in no-step trials was simply the finish times of the GO1 process alone, consistent with the race model assumption of contextual independence.
In the GO-GO architecture, noncompensated saccades were produced when GO1 was less than TSD + GO2, and compensated saccades were produced when TSD + GO2 was less than GO1. In the GO-STOP-GO architecture, noncompensated saccades were produced when GO1 was less than TSD + STOP and compensated saccades were produced when TSD + STOP was less than GO1. In the GO-STOP-GO architecture, the saccade latency on a compensated saccade was equal to TSD + STOP + GO2. For the GO-GO+STOP architecture, noncompensated saccades were produced when GO1 was less than TSD + STOP and was also less than TSD + GO2 . Compensated saccades were produced when TSD + STOP was less than GO1 or TSD + GO2 was less than GO1. For the GO-GO+STEP architecture, the saccade latency on a compensated saccade was equal to TSD + GO2.
Collating all of the individual trials from these Monte Carlo simulations produced a predicted saccade latency distribution for the no-step condition and predicted saccade latency distributions for compensated and noncompensated saccades in each target step condition (as well as a predicted compensation function relating the proportion of compensated and noncompensated saccades at each TSD). Our aim was to find Weibull parameters for GO1, GO2, and STOP that minimized the difference between predicted and observed saccade latency distributions. These distributions contained both the latencies, and frequencies of saccades, so this process also fits the compensation function.
We followed an approach to fitting models to saccade latency data recommended by Ratcliff and Tuerlinckx (2002). Specifically, we searched for parameters that minimized the lack of fit between model predictions and observed data as measured by a Pearson chi-square statistic (χ2), defined by:
The first summation over i indexes over the conditions in the experiment (i.e., no-step condition and the various target step conditions corresponding to the different values of TSD). In keeping with the standard use of a χ2 statistic, within each condition a particular observed (obs) or predicted (prd) trial can have one of a discrete number of possible outcomes indexed over j. The χ2 statistic compares the predicted frequency of each possible outcome ( obsij) with the observed frequency of each possible outcome (prdij). On no-step trials, an observation could fall into one of six latency bins defined by the 10th, 30th, 50th, 70th, and 90th percentiles, and a model prediction could also fall into one of those six defined latency bins. Similarly, on target-step trials, an observation could fall into one of six latency bins defined by the cumulative latency distribution for compensated saccades or into one of six latency bins for noncompensated saccades; a model prediction could also fall into one of those defined latency bins depending on whether the predicted trial was compensated or noncompensated. For model predictions, the 50,000 simulated trials were used to generate the predicted proportion of trials falling into each latency bin and then these were converted into a predicted frequency of trials falling into each latency bin for each condition (see Tuerlinckx, 2004) for additional details on this procedure). Note that the compensation function is not fitted explicitly because the proportion of compensated versus noncompensated trials at each TSD is given by the distributions of finish times directly.
We independently fit predicted responses from each of the three model architectures to data from each subject and task condition. Best-fitting parameters were found by minimizing the χ2 fit statistic using the subplex gradient descent optimization routine (Bogacz and Cohen, 2004 ; Rowan, 1990). This is an extension of the well-known simplex method (Nelder and Mead, 1965) that is well-suited for searching parameter spaces of stochastic models. Each parameter search was started from at least 40 randomly generated starting positions in order to avoid the possibility of settling into a local minimum in parameter space. All parameter searches were run on a parallel computer cluster consisting of several hundred dual-processor Linux systems supported by the Vanderbilt Advanced Computing Center for Research and Education.
3.6.2 Race model fits to primary saccade
Figure 12 compares the best-fitting performance of each model architecture in accounting for the data obtained in double step trials from one representative human subject. The figure displays the Weibull distributions for the component processes of the model architecture, observed and predicted compensation function, and observed and predicted cumulative latency distributions for noncompensated and compensated trials along with the no-step cumulative latency distributions. It is clear that the simplest model consisting of a race between two GO processes, the GO-GO architecture, did not fit the data very well for this subject. In contrast, the GO-STOP-GO and the GO-GO+STOP architectures fit the saccade latency distributions and reproduced the compensation function very well for this subject. Note that the GO2 distribution is earlier in the GO-STOP-GO architecture (Figure 12). Both architectures produce equivalent predictions because in the GO-STOP-GO architecture, the GO2 process is required to start later, after the STOP process finishes.
Figure 12.
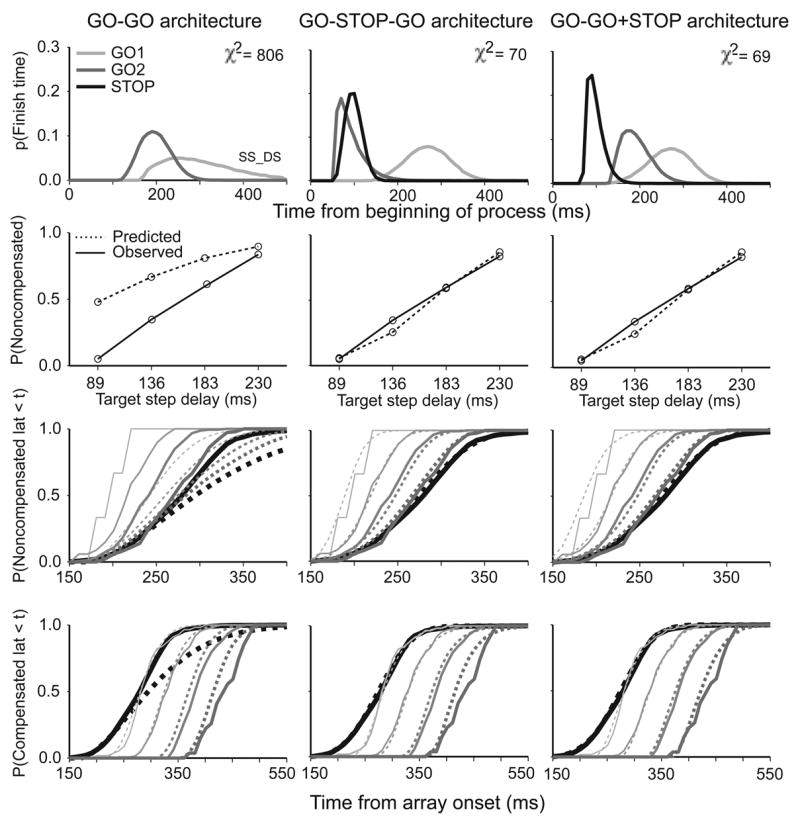
Fits to representative data of the GO-GO architecture (left column), GO-STOP-GO architecture (middle column) and GO-GO+STOP architecture (right column). Top panels illustrate density distributions if finish times of the model processes as indicated by the legend. Second panels compare observed (solid) and predicted (dotted) compensation functions. Third panels compare observed and predicted cumulative distributions of no-step trial and noncompensated saccade latencies. Fourth panels compare observed and predicted cumulative distributions of no-step trial and compensated saccade latencies. For this data set only architectures including a STOP process fit the data.
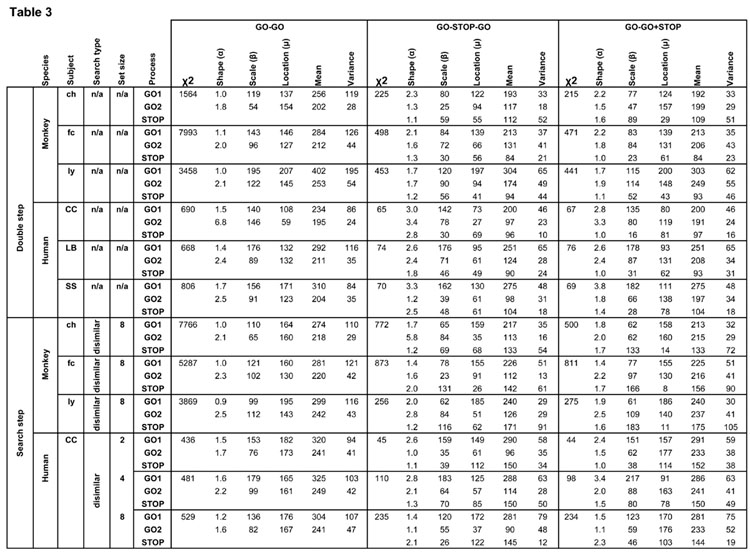
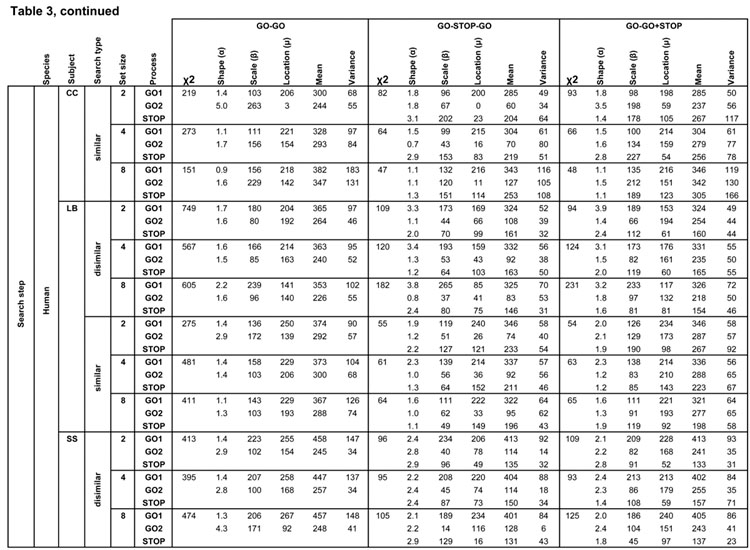
This pattern of best fitting architectures was obtained for all subjects performing both double step and search step tasks under all conditions (Table 3). In all cases, the GO-GO architecture produced fits that were substantially worse than both the GO-STOP-GO and GO-STOP+GO architectures as assessed by Akaike’s Information Criterion (AIC) statistic (Akaike, 1973). Figure 13 shows scatterplots of predicted versus observed mean saccade latencies in no-step, noncompensated, and compensated trials, averaged across TSD to show how these alternative architectures accounted for each of the 27 data sets (6 double step and 21 search step across all subjects). The GO-GO architecture systematically overestimated the latencies of saccades in no-step and noncompensated trials. In contrast, both architectures with the STOP process produced excellent predictions of mean saccade latency in each kind of trial.
Table 3.
Best fitting distribution parameters for the three competing race architectures. Rows list each task by species, subject and search condition, further divided by GO1, GO2, or STOP process. Columns indicate race architecture, chi squared fit value, and Weibull shape, scale and location parameters that describe best fitting finish time distributions of that process with the mean and variance of the finish times of each process.
Figure 13.
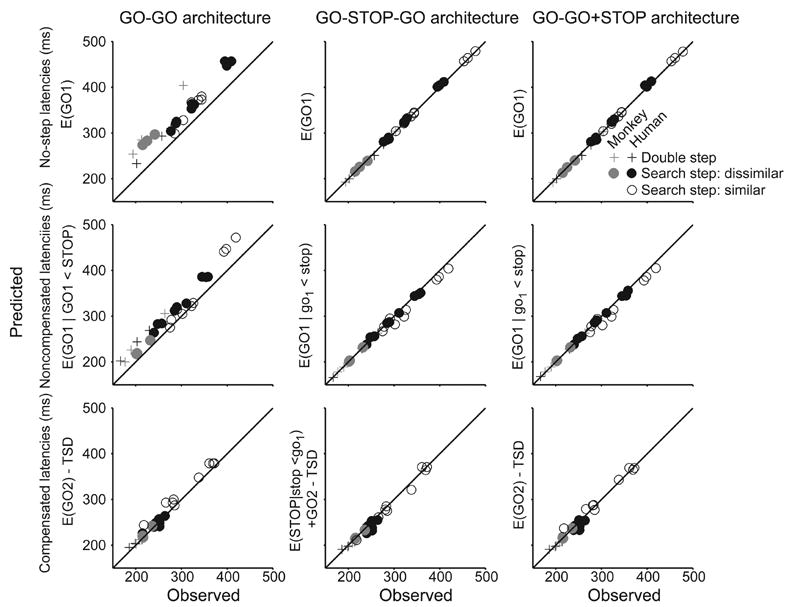
Summary of fits to mean latency of no-step saccades (top row), noncompensated saccades (middle row) and compensated saccades (bottom row) of predicted means for the GO-GO architecture (left column), GO-STOP-GO architecture (middle column) and GO-GO+STOP architecture (right column). For all data sets only architectures including a STOP process fit the data. Gray symbols show data from monkeys; black, from humans. Crosses show data from double step sessions. Filled circles show data from search step with dissimilar target and distractor; open circles, search step with similar target and distractor.
3.6.3 Race model account of target step reaction time
By instantiating a particular implementation of a stopping process, the GO-STOP-GO and GO-STOP+GO models can provide insights into what is measured by TSRT. Recall that TSRT measures the time needed to interrupt the planning of the first saccade. We calculated TSRT from the latency distributions and compensation functions produced by the model fit to each data set; this predicted TSRT was compared to the TSRT measured from the observed data (Figure 14). It is clear that the TSRT predicted by the models that included a STOP process agrees very well with the observed TSRT (Figure 14A,B). This is really just a reflection of the fact that the GO-STOP-GO and GO-GO+STOP architectures fit the saccade latencies and probability of saccade production so well.
Figure 14.
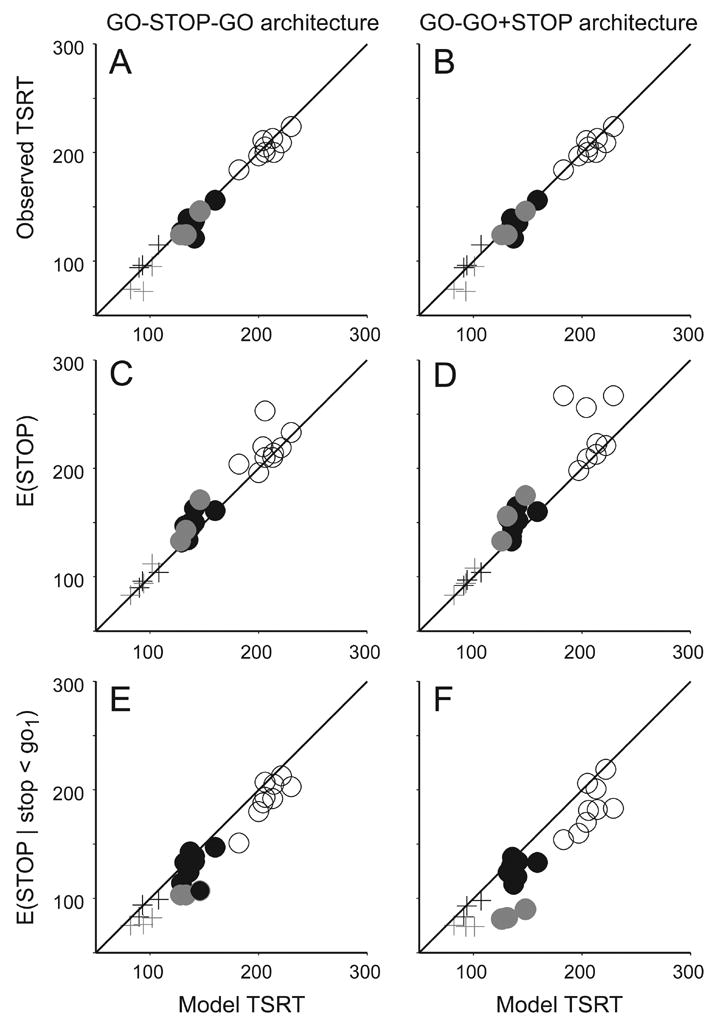
Target step reaction time. A,B. Comparison of observed TSRT to model TSRT for GO-STOP-GO (left) and GO-GO+STOP (right) architectures. C,D. Comparison of average finish times of the STOP process on all trials (E(STOP)) to model TSRT. E,F Comparison of average finish times of those STOP processes that finished before the first GO process (E(STOP | stop < go1)). Conventions as in Figure 13.
The quality of this agreement permits us to explore in more mechanistic terms what TSRT measures. In general, if TSRT measures the time needed to interrupt the preparation of the first saccade, then TSRT should correspond to some measure of the finish time of the STOP process. On the one hand, TSRT could measure the mean of the distribution of all finish times of the STOP process (i.e., the expected value of STOP, E(STOP)). However, this would entail that STOP processes that outlast GO1 could influence TSRT which is logically impossible. Therefore, alternatively, TSRT could measure the mean of only those finish times for which the STOP process finished before GO1 (i.e., E(STOP | STOP < GO1)). Figure 14 illustrates scatterplots of these two measures of STOP finish time as a function of TSRT derived from the model fits to each data set. This plot supports several conclusions. First, although TSRT varies with distractor presence and similarity to the target (Figure 8), there was generally very good agreement between the two measures of STOP finish time and TSRT. Second, for both architectures E(STOP) slightly overestimated the TSRT derived from the simulated data TSRT, and E(STOP | STOP < GO1) slightly underestimated TSRT. These deviations were significant as determined by t-tests testing whether the distribution of the differences between respective distributions were significantly different from 0 for the GO-STOP-GO architecture (t(26) = 3.61; t(26) = −6.19, for E(STOP) and E(STOP | stop < go1) respectively), and the GO-GO+STOP architecture (t(26) = 3.47; t(26) = −6.47, respectively). At the same time, these deviations were very small in absolute value, owing most likely to the small variability of STOP process finish times. Therefore, we conclude that TSRT provides a useful measure of the finish time of the STOP process, but the precise value depends on statistical sampling.
3.6.4 Race model fits to corrective saccade
According to the fits to the production of the primary saccade, whether it is a correct compensated saccade or an errant noncompensated saccade, the GO-STOP-GO and GO-GO+STOP architectures mimic one another. However, we found that another line of evidence can distinguish between them. The latency of corrective saccades can be derived from the model by assuming that the finish time of the GO2 sample following the GO1 sample is the initiation time of a corrective saccade to the final target location. Moreover, partial compensated saccades could occur if GO1 finishes before GO2 both of which finishing before STOP; in other words, the stop process is too slow to interrupt the saccade produced by GO1 but GO2 finishes early enough to affect the execution of the saccade in flight.
Figure 15 shows the predicted interval between noncompensated and corrective saccades as a function of the delay from the step until the noncompensated saccade is initiated (reprocessing time) for both the GO-STOP-GO and the GO-GO+STOP architectures with parameters from a representative subject. The general form of these plots resembles the observed data (Figure 10); however, on closer inspection diagnostic differences are evident. First, the GO-STOP-GO architecture by design cannot produce corrective saccades with latencies less than the finish time of the earliest STOP process because GO2 cannot start before STOP has finished. Therefore, intersaccade intervals less than the duration of the STOP process cannot occur. Second, the GO-STOP-GO architecture by design cannot produce partial responses with mid-flight corrections because GO2 cannot start before STOP is finished. In contrast, GO1 and GO2 can finish before STOP, albeit infrequently, in the GO-GO+STOP architecture (Figure 15C). Thus, the GO-GO+STOP but not the GO-STOP-GO architecture can account for the observations of intersaccade intervals less than ~60 ms as well as mid-flight corrections.
Figure 15.
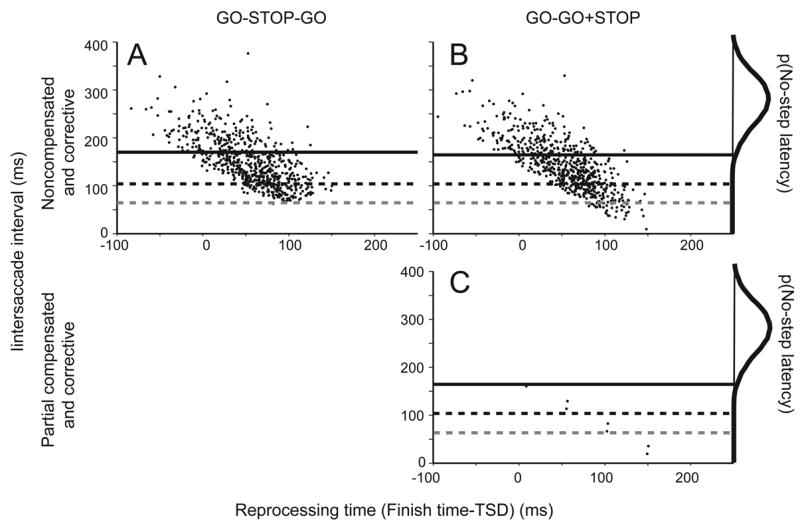
Relation of interval between noncompensated and corrective saccades to reprocessing time in data simulated from the sequential (A) and simultaneous (B–C) architectures. Marginal distribution plots latencies of saccades on no-step trials. The sequential architecture does not permit the second GO process to finish after the first but before the STOP process, but this can occur for the simultaneous architecture. The simulated partial noncompensated saccades (because GO1 finished) are rare but are followed very rapidly by corrective saccades (because GO2 finished). Solid horizontal line denotes the first percentile of no-step responses. Black dashed horizontal line is TSRT. Gray dashed horizontal line is the fastest finish time of the STOP processes occurring in the simulation.
In the data collected from humans, mid-flight corrections were observed in 5.0 ± 1.8 (min = 2.6, max = 10.3) percent of trials. Assuming that mid-flight corrections occur when GO1 finishes 0 to 50 ms (assuming a 50 ms saccade duration) before GO2 with both finishing before STOP, then the GO-STOP-GO architecture predicted no mid-flight corrections because GO2 could not start until GO1 was stopped. However, across the range of best-fit parameters the GO-GO+STOP architecture predicted mid-flight corrections in 2.2 ± 2.7 (min = 0.0, max = 9.1) percent of trials. In the model fits, the range of predicted mid-flight corrections could be accounted for by the delay of STOP relative to the delay of GO1; in other words, if the best-fit STOP process happened to be slow, then this permitted more time for GO1 and GO2 to finish first. Although the model accounted for the overall percentage of mid-flight corrections, the variability in incidence observed across subjects and conditions could not be accounted for entirely by the model. Nevertheless, the close quantitative agreement between observed and predicted incidence of mid-flight corrections is further evidence that the GO-GO+STOP architecture provides the best account of saccade production when the target can step to new locations.
4. Discussion
We investigated saccade target selection in humans and macaque monkeys in tasks in which a target stepped to a different location on random trials. Most testing was done with visual search displays in which the target step amounted to an isoluminant color change. However, to relate these data to the existing literature, testing was also done with a conventional double step procedure in which the target step was the disappearance of the target at its original location and simultaneous appearance at another location. In these double and search step trials, we found that macaque monkey performance is not qualitatively different from human performance of these tasks. We found that performance was stochastic and followed characteristic regularities. First, the probability of producing a compensated saccade to the final target location decreased with the delay of the step. Second, compensated saccades in response to the step were produced with latencies that tended to be shorter than the average latency of saccades on trials with no target step. Third, noncompensated saccades to the initial target location were produced with latencies less than the average latency of saccades on trials with no target step. Fourth, noncompensated errors to the initial target location were routinely followed by corrective saccades to the final target location with an intersaccade interval that tended to decrease with the latency of the noncompensated saccade relative to the target step (reprocessing time).
We also tested formally whether this pattern of results could be accounted for by different race model architectures. We found that the performance could not be accounted for by a race between just two stochastically independent GO processes producing the saccades to the initial or final target location. However, performance was accounted for by a race between three processes – a GO process producing the saccade to the initial target location, a STOP process interrupting that GO process, and a GO process producing the saccade to the final target location. Furthermore, if the STOP process and second GO process start at the same time then the model can account for the incidence and latency of mid-flight corrections and rapid corrective saccades. These results provide new information about the dynamics of saccade target selection and validate a particular computational account of saccade production.
4.1 Comparison of macaque and human performance
Contrary to previous accounts that report monkeys were unable to perform double step tasks (Baizer and Bender, 1989), we found that humans and monkeys demonstrated qualitatively similar performance on these tasks. The differences between the two studies may be due to an innate difference in species used in the two studies; the previous experiment used Macaca fasicularis and this study used M. mulatta and M. radiata. In the previous study it is unclear that the monkeys were sensitive to the stimulus contingencies because they also did not exhibit the well known fixation-target gap effect on saccade latency.
In our study, monkey and human performance was qualitatively indistinguishable in both double step and search step conditions. Although the set size and distractor similarity manipulations were not applied to monkeys in this study, previous work demonstrates that monkeys exhibit the same sensitivity to target target-distractor similarity as humans (e.g., Bichot and Schall, 1999; Sato and Schall, 2001; Sato, Watanabe, Thompson and Schall, 2003; Shen and Pare, 2006).
4.2 Comparison of search step with double step performance
The latencies of saccades to targets are elevated if the target is presented with distractors (Findlay, 1987; Schiller et al., 1987). We replicated this with human and monkeys, but the slowing of saccade latency by the presence of distractors was less pronounced in monkeys than in humans. We believe this difference is because the monkeys (but not the humans) were also trained to perform a memory-guided saccade task with the target presented alone. Thus, the monkeys did not initiate saccades as quickly as they might when the target appeared alone because they had more experience waiting for the fixation spot to disappear.
One of the major findings of this study is that, in spite of this difference, the overall pattern of performance in target step trials was not qualitatively different if the target appeared and stepped with or without distractors (see also Sheliga et al. 2002). In other words, subjects could respond to a target that unexpectedly changed location through a strong luminance decrement at the old location and an increment at the new location as well as to a target that changed location through an isoluminant color change at the old and new locations. Previous studies have investigated attention allocation and target selection when new stimuli are added to a search array (e.g., Godijn and Theeuwes, 2002; Theeuwes, 1991; Theeuwes, Kramer, Hahn and Irwin, 1998). Our results indicate that more subtle changes of the image can guide attention and gaze as well.
To investigate the sensitivity of target selection to the isoluminant color change, we manipulated target-distractor similarity in humans. Unfortunately, the manipulation was only marginally successful because the distractors were not similar enough to increase the display size effect for every subject. Further work is needed with more complex visual search arrays, such as targets defined by spatial configuration.
Another major finding of this study was the longer latency to react to the step in search step as compared to double step trials, as measured by TSRT. TSRT was even longer when the target and distractors were similar in color. At least two explanations can be conceived for these effects on TSRT. First, it is possible that the independence premise of the race model formulation is violated; TSRT could have been longer in the more difficult search trials because the stop process competed for resources with the go process. An alternative interpretation is that the stepped target was not as salient when presented in a search array as when presented alone and was even less salient when the target and distractor were more similar. This would introduce a longer delay in the sensory processing preceding the stop process.
The estimation of TSRT depends on the validity of the race model formulation. Some reports have provided evidence that the independence premise of the race model can be violated (e.g., Hanes and Carpenter, 1999; Özyurt, Colonius and Arndt, 2003). To examine this, we determined on a per-session basis whether noncompensated saccades were produced with latencies longer than the latencies of no step trials saccades. Because we found such violations in only three sessions and in only three target step delays of those sessions we conclude that the performance in this task is consistent with what is expected of a race.
Previous research has interpreted a delay in the saccade latencies of compensated saccades relative to no-step saccade latencies as evidence that an intervening cancellation of the first saccade must occur before a saccade to the final target location can be initiated (Becker and Jürgens, 1979). However, we have seen little evidence of this delay in both human and macaque performance in these tasks, indicating that there might not be enough time for an explicit STOP process to intervene. This difference could be due to differences in the experimental design between the two experiments. For example, in the present experiment, the target either remained at its initial location or stepped to another location at an equivalent eccentricity from the fixation point. In Becker and Jürgens’ experiment the target stepped in more ways in amplitude and direction along the horizontal meridian, away from the central point, toward the central point and across the midline. Given the executive control that can be exerted in double step saccade performance (Ray et al. 2004) it is possible that the diversity of target steps used by Becker and Jürgens resulted in a general slowing of performance.
4.3 What does target step reaction time measure?
One of the utilities of the modeling results was the ability to measure explicitly certain previously unobservable intervals, such as TSRT, the time taken to interrupt the first planned saccade. Though not explicitly fit, TSRT corresponds remarkably well with the average latency of the STOP process. The challenge of measuring the duration of stochastic processes leaves an open question whether TSRT is a measure of the overall average latency of the STOP process or is a measure of the average latency of just those STOP process instances that actually interrupted the first GO process. This distinction is difficult to make because of the low variability inherent in the distributions of the STOP process and while of theoretical interest may not be of much practical value.
4.4 Race models of double step saccade performance
Becker and Jürgens (1979) suggested that double step saccade production could be explained as the outcome of a race between processes producing the alternative saccades; however, this has never been tested formally until now. We analyzed these data according to the same logical framework as has been applied to stop signal data (Logan and Cowan, 1984). The compensation function corresponds to the inhibition function. Noncompensated saccades correspond to signal-respond (also known as non-canceled) saccades. Finally, compensated saccades correspond to signal-inhibit (also known as canceled) trials. The countermanding race model has been successfully applied to stop signal and change signal task performance (e.g., Colonius et al., 2001; De Jong, Coles, Logan and Gratton, 1990; Logan and Burkell, 1986).
A recent paper by Ludwig, Mildinhall and Gilchrist (2006) describes a stochastic accumulator model of double-step saccade performance. This model included the following characteristics: saccade direction is coded by pools of units with broad movement fields; the presentation of a target results in increased activation of the unit centered on the target location with progressively less activation in neighbouring units; the activation of each unit corresponds to evidence in favor of the target being in its response field; the activation of each unit is subject to leakage such that if the target steps out of the movement field, activation passively decays; a saccade is generated to the location coded by the unit with activation that reaches a specific threshold; the latency of the saccade is determined by the time that the threshold is reached plus a constant efferent delay; the rate of accumulation varies randomly across target onsets and within a trial; the within-trial noise is independent across units. This model could account for major features of the data including the production of averaging saccades. While this model is probably correct in many respects, it has the following shortcomings. First, the model parameters were not optimized to individual data sets. Second, the model was not shown to fit the range of error and correct saccade latencies. Third, the reduction of activation exclusively through leakage is not sufficient to account for the latency of saccades and pattern of neural modulation if double-step performance is accomplished by the same circuitry that accomplishes saccade countermanding (Boucher et al. 2007). Finally, evidence in support of one model architecture was provided, but alternative architectures were not excluded.
A major goal of this study was to evaluate different architectures of the race model and in particular to gain an insight into the nature of the stopping process. For every data set examined, the best-fitting model included a STOP process that interrupted preparation of the first saccade. We also explored how this STOP process related to the second GO process that produced the saccade to the final target location. One logical possibility is that the second GO process (GO2) begins only after STOP finishes by interrupting GO1; we refer to this as the GO-STOP-GO architecture. Another logical possibility is that GO2 starts at the same time as STOP; we refer to this as the GO-GO+STOP architecture.
Both of these architectures fit the distributions of latencies of no step, noncompensated and compensated saccades and replicated the compensation function. However, the two architectures make different predictions about the distributions of finish times of the processes that prepare the first (GO1) and second saccade (GO2). In the GO-STOP-GO model the latencies of GO2 are much shorter than those of GO1. In fact, the GO2 latencies are so short as to be physiologically implausible. On the view that GO1 and GO2 are just different manifestations of the same process, this marked difference suggests that the sequential processing inherent in the GO-STOP-GO architecture may not be a viable alternative. However, the GO-GO+STOP architecture fit to the data sets also produced GO2 latencies that were systematically shorter than those of GO1. This was necessary to fit the compensated saccade latencies that were shorter than the no step trial saccade latencies for most subjects. Evidently, under the conditions used in our study there was a facilitation of saccade programming on target step trials.
The GO-STOP-GO and GO-GO+STOP architectures could be distinguished quite clearly when examining the incidence and latency of corrective saccades produced after noncompensated saccades. Noncompensated saccades were produced if GO1 finished first. In such trials we could sample a GO2 finish time, and we found that the interval between GO2 (corrective) and GO1 (noncompensated) tended to decrease with the latency of GO1 relative to the step (reprocessing time) (Figure 15). However, due to its sequential design the GO-STOP-GO architecture could not produce intersaccade intervals less than the duration of the STOP process. In contrast, due to the parallel activation of GO2 and STOP in the GO-GO+STOP architecture, it was possible to produce very short intersaccade intervals. In fact, it was possible for the GO-GO+STOP architecture to produce some trials in which GO1 finishes before GO2 that both finish before STOP. Such rare occurrences may be seen as mid-flight corrections in which the second saccade command follows on the heels of the first without any period of fixation.
A number of investigators have described saccades with curved trajectories when multiple targets are presented (e.g., McPeek, Han and Keller, 2003; Minken, Van Opstal and Van Gisbergen, 1993; Port and Wurtz, 2003). All studies agree that such curved saccade mid-flight corrections are rare. Models have been developed to account for the curvature of mid-flight corrections (e.g., Quaia, Lefevre and Optican 1999; Arai and Keller, 2005; Walton, Sparks and Gandhi, 2005; Goossens and Van Opstal, 2006). Our model provides an account of the premotor mechanisms that explain the frequency and latency of such movements.
Therefore, we believe that the GO-GO+STOP architecture is the most plausible account of how the primate brain produces saccades. This conclusion has two implications. First, it demonstrates how concurrent saccade preparation can occur in a controlled fashion. Second, the fact that GO2 and STOP occur at the same time suggests that they may in fact be the same process.
Acknowledgments
The authors wish to thank Hari Kannan and Daniel Shima for programming support, Leanne Boucher and Stephanie Shorter-Jacobi for helpful discussions and the referees for useful comments on the manuscript. This work was supported by T32-MH064913, NSF-BCS0218507, RO1-EY08890, Robin and Richard Patton and center grants P30-EY08126 and P30-HD015052.
Footnotes
Publisher's Disclaimer: This is a PDF file of an unedited manuscript that has been accepted for publication. As a service to our customers we are providing this early version of the manuscript. The manuscript will undergo copyediting, typesetting, and review of the resulting proof before it is published in its final citable form. Please note that during the production process errors may be discovered which could affect the content, and all legal disclaimers that apply to the journal pertain.
References
- Akaike H. 2nd International Symposium on Information Theory. Budapest: 1973. Information theory and an extension of the maximum likelihood principle; pp. 267–281. [Google Scholar]
- Andersen RA, Buneo CA. Intentional maps in posterior parietal cortex. Annu Rev Neurosci. 2002;25:189–220. doi: 10.1146/annurev.neuro.25.112701.142922. [DOI] [PubMed] [Google Scholar]
- Arai K, Keller EL. A model of the saccade-generating system that accounts for trajectory variations produced by competing visual stimuli. Biol Cybern. 2005;92:21–37. doi: 10.1007/s00422-004-0526-y. [DOI] [PubMed] [Google Scholar]
- Aslin RN, Shea SL. The amplitude and angle of saccades to double-step target displacements. Vision Res. 1987;27:1925–1942. doi: 10.1016/0042-6989(87)90058-7. [DOI] [PubMed] [Google Scholar]
- Baizer JS, Bender DB. Comparison of saccadic eye movements in humans and macaques to single-step and double-step target movements. Vision Res. 1989;29:485–495. doi: 10.1016/0042-6989(89)90011-4. [DOI] [PubMed] [Google Scholar]
- Band GP, van der Molen MW, Logan GD. Horse-race model simulations of the stop-signal procedure. Acta Psychol (Amst) 2003;112:105–142. doi: 10.1016/s0001-6918(02)00079-3. [DOI] [PubMed] [Google Scholar]
- Becker W. Metrics. In: Wurtz RH, Goldberg ME, editors. Neurobiology of Saccadic Eye Movements. Amsterdam: Elsevier; 1989. pp. 13–67. [Google Scholar]
- Becker W, Jürgens R. An analysis of the saccadic system by means of double step stimuli. Vision Research. 1979;19:967–983. doi: 10.1016/0042-6989(79)90222-0. [DOI] [PubMed] [Google Scholar]
- Bichot NP, Schall JD. Saccade target selection in macaque during feature and conjunction visual search. Vis Neurosci. 1999;16:81–89. doi: 10.1017/s0952523899161042. [DOI] [PubMed] [Google Scholar]
- Bogacz R, Cohen JD. Parameterization of connectionist models. Behav Res Methods Instrum Comput. 2004;36:732–741. doi: 10.3758/bf03206554. [DOI] [PubMed] [Google Scholar]
- Boucher L, Palmeri TJ, Logan GD, Schall JD. Inhibitory control in mind and brain: An interactive race model of countermanding saccades. Psychol Rev. 2007 doi: 10.1037/0033-295X.114.2.376. [DOI] [PubMed] [Google Scholar]
- Colby CL, Goldberg ME. Space and attention in parietal cortex. Annu Rev Neurosci. 1999;22:319–49. doi: 10.1146/annurev.neuro.22.1.319. [DOI] [PubMed] [Google Scholar]
- Colonius H, Özyurt J, Arndt PA. Countermanding saccades with auditory stop signals: testing the race model. Vision Res. 2001;41:1951–1968. doi: 10.1016/s0042-6989(01)00084-0. [DOI] [PubMed] [Google Scholar]
- De Jong R, Coles MG, Logan GD, Gratton G. In search of the point of no return: the control of response processes. J Exp Psychol Hum Percept Perform. 1990;16:164–182. doi: 10.1037/0096-1523.16.1.164. [DOI] [PubMed] [Google Scholar]
- Findlay JM. Visual computation and saccadic eye movements: a theoretical perspective. Spat Vis. 1987;2:175–189. doi: 10.1163/156856887x00132. [DOI] [PubMed] [Google Scholar]
- Findlay JM, Walker R. A model of saccade generation based on parallel processing and competitive inhibition. Behav Brain Sci. 1999;22:661–674. doi: 10.1017/s0140525x99002150. [DOI] [PubMed] [Google Scholar]
- Godijn R, Theeuwes J. Programming of endogenous and exogenous saccades: evidence for a competitive integration model. J Exp Psychol Hum Percept Perform. 2002;28:1039–1054. doi: 10.1037//0096-1523.28.5.1039. [DOI] [PubMed] [Google Scholar]
- Goossens HH, Van Opstal AJ. Dynamic ensemble coding of saccades in the monkey superior colliculus. J Neurophysiol. 2006;95:2326–2341. doi: 10.1152/jn.00889.2005. [DOI] [PubMed] [Google Scholar]
- Hanes DP, Carpenter RH. Countermanding saccades in humans. Vision Res. 1999;39:2777–2791. doi: 10.1016/s0042-6989(99)00011-5. [DOI] [PubMed] [Google Scholar]
- Hanes DP, Patterson WF, 2nd, Schall JD. Role of frontal eye fields in countermanding saccades: visual, movement, and fixation activity. J Neurophysiol. 1998;79:817–834. doi: 10.1152/jn.1998.79.2.817. [DOI] [PubMed] [Google Scholar]
- Hanes DP, Schall JD. Countermanding saccades in macaque. Vis Neurosci. 1995;12:929–937. doi: 10.1017/s0952523800009482. [DOI] [PubMed] [Google Scholar]
- Komoda MK, Festinger L, Phillips LJ, Duckman RH, Young RA. Some observations concerning saccadic eye movements. Vision Res. 1973;13:1009–1020. doi: 10.1016/0042-6989(73)90140-5. [DOI] [PubMed] [Google Scholar]
- Li CS, Andersen RA. Inactivation of macaque lateral intraparietal area delays initiation of the second saccade predominantly from contralesional eye positions in a double-saccade task. Exp Brain Res. 2001;137:45–57. doi: 10.1007/s002210000546. [DOI] [PubMed] [Google Scholar]
- Lisberger SG, Fuchs AF, King WM, Evinger LC. Effect of mean reaction time on saccadic responses to two-step stimuli with horizontal and vertical components. Vision Res. 1975;15:1021–1025. doi: 10.1016/0042-6989(75)90245-x. [DOI] [PubMed] [Google Scholar]
- Logan G, Burkell J. Dependence and independence in responding to double stimulation: a comparison of stop, change, and dual-task paradigms. Journal of Experimental Psychology: Human Perception and Performance. 1986;12:549–563. [Google Scholar]
- Logan GD. On the ability to inhibit thought and action: A user’s guide to the stop signal paradigm. In: Dagenbach D, Carr T, editors. Inhibitory Processes in Attention, Memory, and Language. San Diego: Academic Press; 1994. [Google Scholar]
- Logan GD, Cowan WB. On the ability to inhibit thought and action: A theory of an act of control. Psychological Review. 1984;91:295–327. doi: 10.1037/a0035230. [DOI] [PubMed] [Google Scholar]
- Logan GD, Cowan WB, Davis KA. On the ability to inhibit simple and choice reaction time responses: a model and a method. J Exp Psychol Hum Percept Perform. 1984;10:276–291. doi: 10.1037//0096-1523.10.2.276. [DOI] [PubMed] [Google Scholar]
- Ludwig CJ, Mildinhall JW, Gilchrist ID. A population coding account for systematic variation in saccadic dead time. J Neurophysiol. 2006;97:795–805. doi: 10.1152/jn.00652.2006. [DOI] [PubMed] [Google Scholar]
- McPeek RM, Han JH, Keller EL. Competition between saccade goals in the superior colliculus produces saccade curvature. J Neurophysiol. 2003;89:2577–2590. doi: 10.1152/jn.00657.2002. [DOI] [PubMed] [Google Scholar]
- Minken AW, Van Opstal AJ, Van Gisbergen JA. Three-dimensional analysis of strongly curved saccades elicited by double-step stimuli. Exp Brain Res. 1993;93:521–533. doi: 10.1007/BF00229367. [DOI] [PubMed] [Google Scholar]
- Murthy A, Ray S, Shorter-Jacobi SM, Priddy EG, Schall JD, Thompson KG. Frontal eye field contributions to rapid corrective saccades. J Neurophysiology. 2007;97:1457–1469. doi: 10.1152/jn.00433.2006. [DOI] [PubMed] [Google Scholar]
- Nelder JA, Mead R. A Simplex Method for Function Minimization. The Computer Journal. 1965;7:308–313. [Google Scholar]
- Osman A, Kornblum S, Meyer DE. The point of no return in choice reaction time: controlled and ballistic stages of response preparation. J Exp Psychol Hum Percept Perform. 1986;12:243–258. doi: 10.1037//0096-1523.12.3.243. [DOI] [PubMed] [Google Scholar]
- Ottes FP, Van Gisbergen JA, Eggermont JJ. Metrics of saccade responses to visual double stimuli: two different modes. Vision Res. 1984;24:1169–1179. doi: 10.1016/0042-6989(84)90172-x. [DOI] [PubMed] [Google Scholar]
- Özyurt J, Colonius H, Arndt PA. Countermanding saccades: evidence against independent processing of go and stop signals. Percept Psychophys. 2003;65:420–428. doi: 10.3758/bf03194573. [DOI] [PubMed] [Google Scholar]
- Quaia C, Lefevre P, Optican LM. Model of the control of saccades by superior colliculus and cerebellum. J Neurophysiol. 1999;82:999–1018. doi: 10.1152/jn.1999.82.2.999. [DOI] [PubMed] [Google Scholar]
- Port NL, Wurtz RH. Sequential activity of simultaneously recorded neurons in the superior colliculus during curved saccades. J Neurophysiol. 2003;90:1887–1903. doi: 10.1152/jn.01151.2002. [DOI] [PubMed] [Google Scholar]
- Ratcliff R, Tuerlinckx F. Estimations parameters of the diffusion model: Approaches to dealing with contaminant reaction times and parameter variability. Psychonomic Bulletin and Review. 2002;9:438–481. doi: 10.3758/bf03196302. [DOI] [PMC free article] [PubMed] [Google Scholar]
- Ray S, Schall JD, Murthy A. Programming of double-step saccade sequences: modulation by cognitive control. Vision Res. 2004;44:2707–2718. doi: 10.1016/j.visres.2004.05.029. [DOI] [PubMed] [Google Scholar]
- Rowan T. Functional Stability Analysis of Numerical Algorithims. Austin: University of Texas at Austin; 1990. [Google Scholar]
- Sato T, Schall JD. Pre-excitatory pause in frontal eye field responses. Exp Brain Res. 2001;139:53–58. doi: 10.1007/s002210100750. [DOI] [PubMed] [Google Scholar]
- Sato TR, Watanabe K, Thompson KG, Schall JD. Effect of target-distractor similarity on FEF visual selection in the absence of the target. Exp Brain Res. 2003;151:356–363. doi: 10.1007/s00221-003-1461-1. [DOI] [PubMed] [Google Scholar]
- Schiller PH, Sandell JH, Maunsell JH. The effect of frontal eye field and superior colliculus lesions on saccadic latencies in the rhesus monkey. J Neurophysiol. 1987;57:1033–1049. doi: 10.1152/jn.1987.57.4.1033. [DOI] [PubMed] [Google Scholar]
- Sheliga BM, Brown VJ, Miles FA. Voluntary saccadic eye movements in humans studied with a double-cue paradigm. Vision Res. 2002;42:1897–1915. doi: 10.1016/s0042-6989(02)00101-3. [DOI] [PMC free article] [PubMed] [Google Scholar]
- Shen K, Pare M. Guidance of eye movements during visual conjunction search: local and global contextual effects on target discriminability. J Neurophysiol. 2006;95:2845–2855. doi: 10.1152/jn.00898.2005. [DOI] [PubMed] [Google Scholar]
- Theeuwes J. Exogenous and Endogenous Control of Attention - the Effect of Visual Onsets and Offsets. Perception and Psychophysics. 1991;49:83–90. doi: 10.3758/bf03211619. [DOI] [PubMed] [Google Scholar]
- Theeuwes J, Kramer AF, Hahn S, Irwin DE. Our eyes do not always go where we want them to go: Capture of the eyes by new objects. Psychological Science. 1998;9:379–385. [Google Scholar]
- Townsend JT, Ashby FG. Stochastic modeling of elementary psychological processes. Cambridge: Cambridge University Press; 1983. [Google Scholar]
- Van Gisbergen JA, Van Opstal AJ, Roebroek JGH. Stimulus-induced midflight modification of saccade trajectories. In: O’Regan JK, Lévy-Schoen A, editors. Eye movements: from physiology to cognition. Dourdan, France: Elsevier; 1987. pp. 27–36. [Google Scholar]
- Van Zandt T. How to fit a response time distribution. Psychonomic Bulletin and Review. 2000;7:424–465. doi: 10.3758/bf03214357. [DOI] [PubMed] [Google Scholar]
- van Zoest W, Donk M, Theeuwes J. The role of stimulus-driven and goal-driven control in saccadic visual selection. J Exp Psychol Hum Percept Perform. 2004;30:746–759. doi: 10.1037/0096-1523.30.4.749. [DOI] [PubMed] [Google Scholar]
- Walton MM, Sparks DL, Gandhi NJ. Simulations of saccade curvature by models that place superior colliculus upstream from the local feedback loop. J Neurophysiol. 2005;93:2354–2358. doi: 10.1152/jn.01199.2004. [DOI] [PMC free article] [PubMed] [Google Scholar]
- Wolfe JM. What can 1 million trials tell us about visual search. Psychological Science. 1998;9:33–39. [Google Scholar]


