

Abstract
Characterization of the human blood plasma proteome is critical to the discovery of routinely useful clinical biomarkers. We used an Accurate Mass and Time (AMT) tag strategy with high-resolution mass accuracy capillary liquid chromatography Fourier-Transform Ion Cyclotron Resonance Mass Spectrometry (cLC-FTICR MS) to perform a global proteomic analysis of pilot study samples as part of the HUPO Plasma Proteome Project. HUPO reference serum and citrated plasma samples from African Americans, Asian Americans, and Caucasian Americans were analyzed, in addition to a Pacific Northwest National Laboratory reference serum and plasma. The AMT tag strategy allowed us to leverage two previously published “shotgun” proteomics experiments to perform global analyses on these samples in triplicate in less than 4 days total analysis time. A total of 722 (22% with multiple peptide identifications) International Protein Index (IPI) redundant proteins, or 377 protein families by ProteinProphet, were identified over the 6 individual HUPO serum and plasma samples. The samples yielded a similar number of identified redundant proteins in the plasma samples (average 446 +/−23) as found in the serum samples (average 440+/−20). These proteins were identified by an average of 956+/−35 unique peptides in plasma and 930+/−11 unique peptides in serum. In addition to this high-throughput analysis, the AMT tag approach was used with a Z-score normalization to compare relative protein abundances. This analysis highlighted both known differences in serum and citrated plasma such as fibrinogens, and reproducible differences in peptide abundances from proteins such as soluble activin receptor-like kinase 7b and glycoprotein m6b. The AMT tag strategy not only improved our sample throughput, and provided a basis for estimated quantitation.
Abbreviations used: Fourier-Transform Ion Cyclotron Resonance Mass Spectrometry (FTICR MS), sodium dodecyl sulfate-polyacrylamide gel electrophoresis (SDS-PAGE), micro-capillary liquid chromatography (cLC), mass spectrometry (MS), putative mass and time tag (PMT tag), accurate mass and time tag (AMT tag), International Protein Index (IPI), Human Proteome Organization (HUPO), Plasma Proteome Project (PPP)
Keywords: proteomics, blood, plasma, serum, cLC-FTICR MS, mass spectrometry, cluster analysis, HUPO
Introduction
The rapid expansion of proteomic analyses in recent years due to the development of powerful enabling technologies parallels the ongoing genomics expansion. Based on the experience gained from the large-scale genomics projects, there is widespread recognition that the proteomics field needs to invest early on in significant multi-laboratory efforts devoted to improving data quality [1], to making cross-laboratory and cross-platform data comparisons [2], and to developing data standards [3]. One such effort is the Plasma Proteomics Initiative, one of the first endeavors of the Human Proteome Organization Plasma Proteome Project (HUPO PPP) [4], which also includes liver and brain initiatives [5].
The Plasma Proteomics Initiative is timely, as blood plasma and serum are widely recognized as body fluids of great promise for human health for diagnostics, e.g., disease prognostics and clinical monitoring [2, 4, 6–18]. Two of the most compelling reasons for studying human plasma are 1) the universal availability of sufficient blood plasma and serum for method development and validation and 2) the long-standing use of plasma and serum as a source of clinically relevant information [6,19]. The union between the venerable applications of clinical chemistry and powerful new technologies in the form of proteomics is driving a renaissance in human blood plasma and serum analysis.
To gain the most utility and understanding from this renaissance, many issues need to be addressed. One of these issues is to encourage open and direct comparisons of methods and technologies, using sample(s) made commonly available to many laboratories [3–5] and facilitating the development of a central repository for results with unified data standards. With such a centralized and unified data system in place, a much greater impact of proteomic efforts will be realized, such as more effective mining of results, development of better data analysis tools, more confident protein identifications, and a deeper understanding of the relative strengths and weaknesses of various technologies. The development of a single comprehensive protein database for peptide/protein identifications will lead to better coverage and allow differences among plasma analyses to be dealt with directly [2]. Another advantage is that the results from these combined efforts will also lead to overall improvements in the confidence of identifications that were obtained by different techniques.
A recent approach for obtaining comprehensive high-throughput proteomics is the Accurate Mass and Time (AMT) tag technology pioneered at Pacific Northwest National Laboratory (PNNL), which is based on high resolution liquid chromatography (LC) separations and high mass accuracy measurements and is extensively described elsewhere [20–22]. With this approach, normalized LC elution profiles are determined for peptides identified by extensive traditional ion trap “shotgun” proteomics experiment(s). Note, the present work employed peptide identifications from two previous studies [15,17]. The peptide identifications (and thus their known exact masses) and complementary reversed-phase capillary LC-elution times are stored in a database to serve as peptide markers (i.e., mass and time tags) for future studies. These tags are then used with the relatively high-throughput, high mass accuracy, and high resolution of capillary LC-Fourier Transform Ion Cyclotron Resonance Mass Spectrometry (cLC-FTICR MS) to identify peptides based on matching elution and mass values [20–22], i.e., establishing AMT tags. Ideally, once peptides have been identified with an ion-trap MS, routine MS/MS measurements are replaced with cLC-FTICR MS measurements. This approach provides improved quantitation as well as much higher throughput. The major limitation is that peptides must have been previously identified in an MS/MS spectrum [20,21] or, alternatively, be subjected to additional experiments for identification [23].
Here, we report on the results obtained from using the AMT tag technology to analyze 6 Becton-Dickinson Diagnostics-prepared HUPO PPP sera and citrated plasmas [4] along with an in-house reference serum [15] and citrated plasma. Our approach involved using the high-throughput technology to assess the reproducibility and relative confidence of peptide/protein identifications, and make inter-sample comparisons. The resulting comparisons were clustered to calculate and illustrate correlations among samples and triplicate runs. The clustered data were also used to demonstrate the possibility of using this technique to detect known differences between serum and citrated plasma and discover new differences. For example zonadhesin was present in our citrated plasma samples, but depleted in our serum samples. This observation was consistent in the HUPO PPP database, as the only other identification of zonadhesin was in a plasma sample presented by Laboratory 12. However, in both laboratories this identification was made from a single peptide and therefore will require further efforts to verify the possible role (if any) of zonadhesin in plasma versus serum. Where possible peptide/protein abundances defined by ion current values were compared to protein concentrations determined by a certified clinical analyzer, the Behring Nephelometer II (BN II), from Dade Behring (Haab et al., in review, for HUPO special issue).
The cLC-FTICR MS analysis of eight samples in triplicate was performed in only 4 days total instrument analysis time. These results demonstrate that the AMT tag approach can be used to compare samples at levels comparable to a more typical multidimensional-separation using an ion trap mass spectrometer (Ref. the compiled HUPO data sets pending). Furthermore, these results demonstrate the basis for a more quantitative and higher-throughput global proteomics approach.
Materials and Methods
All reagents were purchased from Sigma, unless noted otherwise. All samples were approved by our IRB and conform to HIPAA regulations.
Human blood serum and plasma
Human sera and plasmas prepared specifically for HUPO PPP by BD Diagnostics were received on dry ice and placed directly at −80 °C upon receipt for long-term storage. The PNNL reference serum and citrated plasma consist of different aliquots of the same anonymous female source described previously (Golden West Biologicals, Temecula, CA) [15]. Upon receipt, these samples were aliquoted into 1 mL units and were also stored long-term at −80 °C (Table 1.).
Table 1. Sample abbreviation table.
The abbreviation, source, and lot number for the plasma and sera analyzed in triplicate by the AMT tag approach for the HUPO PPP.
| Abbr. | Source | Lot # |
|---|---|---|
| B3-CIT | HUPO (BD Diagnostics) | BDAA01 CIT-Plasma |
| B3-SERUM | HUPO (BD Diagnostics) | BDAA01 Serum |
| B2-CIT | HUPO (BD Diagnostics) | BDAFA01 CIT-Plasma |
| B2-SERUM | HUPO (BD Diagnostics) | BDAFA01 Serum |
| B1-CIT | HUPO (BD Diagnostics) | BDCA02 CIT-Plasma |
| B1-SERUM | HUPO (BD Diagnostics) | BDCA02 Serum |
| RefP | PNNL Ref (Golden West Biologicals) | M99869 CIT-Plasma |
| RefS | PNNL Ref (Golden West Biologicals) | M99869 Serum |
Depletion of immunoglobulins and trypsin digestion
The immunoglobulins (Ig) were depleted by affinity adsorption chromatography using protein A/G. 200 μL of each sera/plasma was diluted with an equal amount of 20 mM Sodium Phosphate, pH 7.5 and added to an equal volume of UltraLink Immobilized protein A/G beads (Pierce Chemical Co., Rockford, IL) that had been pre-equilibrated with 20 mM sodium phosphate, pH 7.8 as a 50% slurry. This slurry was incubated with gentle rocking for 20 minutes at 4 °C. Immunoglobulin-depleted serum was separated from the protein A/G beads by centrifugation using an Eppendorf microcentrifuge at 13,000 rpm. The beads were then washed 2 times with 5 volumes of PBS (150 mM NaCl, 10 mM sodium phosphate, pH 7.3) and the washes pooled with the decanted immunoglobulin-depleted serum. Bradford protein assays were performed with the equivalent of 1 mg of sample that was denatured with 6 M urea and 1 mM DTT. The denatured protein samples were diluted 1:6 with PBS and then digested with 20 μg modified-trypsin (Promega, Madison, WI). Depletion and digestion quality was accessed by SDS-PAGE using a 4–12% gradient NuPage gel (Invitrogen, Carlsbad, CA) and stained with GelCode Blue (Pierce, Rockford, IL) (Figure 1).
Figure 1. SDS-PAGE for quality assessment of Ig-depletion and trypsin digestion of plasma samples.
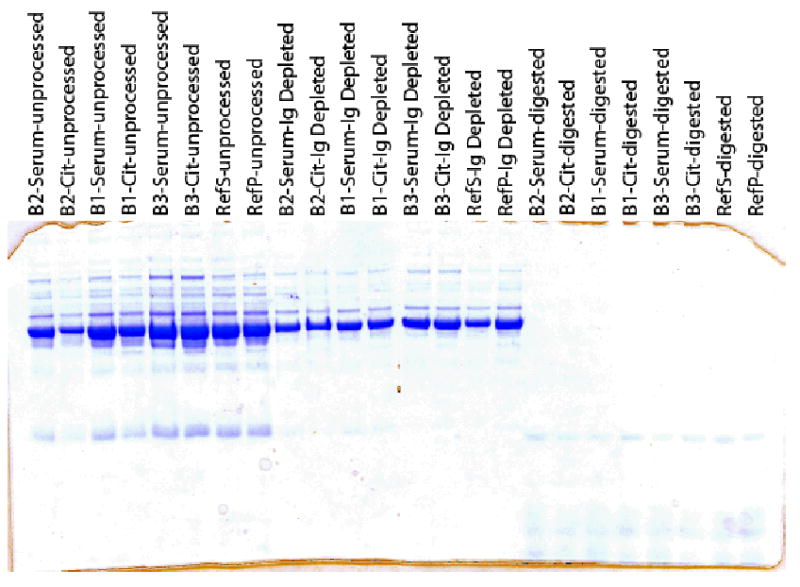
A 4–12% NuPage gel stained with GelCode Blue illustrating the sera and plasma’s before and after Ig depletion and trypsin digestion.
Peptide clean-up
Eight LC-18 SPE columns (Supelco, Bellefonte, PA) were placed on a Supelco Vacuum manifold (Supelco, Bellefonte, PA). The columns were wetted with 3 times 1 mL volumes of methanol and equilibrated with 3 times 1 mL volumes of water. Each trypsin-digested peptide mixture was applied to an individual column and washed 3 times with 1 mL water. The peptides were eluted from each column with 3 times 0.5 mL 80% ACN, 0.1% acetic acid, 0.01% trifluoroacetic acid, and water and collected in a 2 mL Eppendorf tube. The eluted peptides were lyophilized using a Speed-Vac and reconstituted to 5 μg/μL with 0.05% trifluoroacetic acid and 0.2% acetic acid in water.
Capillary reversed-phase LC
Reversed-phase LC separations were performed using an in-house capillary LC system with a 60 cm long column (150 μm i.d. X 360 μm o.d., Polymicro Technologies, Phoenix, AZ) packed with 5 μm Jupiter C18 particles (Phenomenex, Torrance, CA). The mobile phases consisted of (A) 0.05% trifluoroacetic acid and 0.2% acetic acid in water and (B) 90% ACN and 0.1% trifluoroacetic acid in water. Peptides were injected on the column using a 10 μL loop at a flow rate of 1.8 nL/min. The column was re-equilibrated with 5% B for 20 minutes and peptides were eluted with a linear gradient from 5% to 70% B over 80 minutes. The capillary LC column was interfaced to either an ion trap mass spectrometer (ThermoFinnigan, San Jose, CA) or to a PNNL-modified 9.4 T Bruker-FTICR mass spectrometer using electrospray ionization [24]. The peptide loading quantity was either 10 or 5 μg for the ion trap MS or FTICR-MS, respectively.
Ion-trap MS
The ThermoFinnigan ion trap mass spectrometer (ThermoFinnigan, San Jose, CA) was configured as published previously [15]. Briefly, the mass spectrometer was configured to cover the m/z range of 400–2000 followed by 3 MS/MS scans on the 3 most intense precursor masses from the preceding MS scan. The tandem spectra were generated using a collisional energy of 45%. A dynamic mass exclusion window of 3 min was used.
SEQUEST identification of peptides
Tandem mass spectra were analyzed by SEQUEST (Bioworks 3.0, ThermoFinnigan, San Jose, CA) [25–29], which performs its analyses by cross-correlating experimentally acquired mass spectra with theoretical idealized mass spectra generated from a database of protein sequences. These idealized spectra are weighted largely with b and y fragment ions, i.e. fragments resulting from the amide-linkage bond from the N- and C- termini, respectively. For these analyses, no enzyme rule restrictions were applied to the possible cleavage sites available for peptide generation from the protein database. The peptide mass tolerance was 3.0 and the fragment ion tolerance was 0.0. The resulting identifications were then filtered according to the HUPO specific rules (See the next section). The FASTA protein database was searched against the July 2003 version of the International Protein Index (IPI; http://www.ebi.ac.uk/IPI/IPIhelp.html), generated by the European Bioinformatics Institute, as selected by the HUPO PPP members, to facilitate inter-laboratory comparisons of the proteomic analyses [4].
Putative mass and time tag database from SEQUEST results
The data used to establish the mass and time tag database were obtained from multiple sample sources. The raw LC-ion trap data from our previous multidimensional analysis [15] were reanalyzed for this work along with individual ion trap analyses of each HUPO sample described herein (Table 1). These combined peptide identifications were used to populate the database that was subsequently used for generating the AMT tag results, which were uploaded to the HUPO database in December of 2003. This initial set of results, referred to as the HUPO-Dec_Submission set, were derived using liberal SEQUEST filters, as described elsewhere [22,30]. Additional peptide identifications were added to the mass and time tag database from a second extensive multidimensional effort using an undepleted plasma sample [17]. These results were not available for upload at the December HUPO-PPP submission deadline, but were subsequently uploaded to HUPO in July 2004. These later results are used here for the primary data analysis referred to as the HUPO-Jul_Submission set, internally designated as MT_Human_X112. The HUPO-Jul_Submission set also used SEQUEST data filters modeled after the HUPO filters. These data filters are: tryptic on at least the N- or C- terminus and a minimum DelCN value of 0.1 with +1, +2, and +3 charge states, using minimum XCorr values of 1.9, 2.2, and 3.75, respectively. The major exception was that at the time of data analysis Rsp was not captured in our data and therefore was not filtered with the HUPO expected <=4. Subsequently, we determined that ~20% of all AMT tag peptide identifications and ~12% of those that were identified with high matched confidence had a value of >4 for Rsp. The false positive identification rate for peptide identifications was 32%; if the filter also contained the requirement for an Rsp <=4, the false-positive rate was 15% using the approach described in Qian et al. 2005 [31].
FTICR MS
A Bruker Daltonics 9.4 tesla FTICR mass spectrometer was modified and configured for high-throughput proteomics use as described by Belov et al. [24]. Briefly, the FTICR mass spectrometer was combined with the capillary LC system (described above) and modified for concurrent internal mass calibration and auto-sampling. Injected samples contained tryptically digested peptides equivalent to 5 μg protein. These analyses typically result in analyzed peptides with <5 part per million (ppm) mass measurement accuracy (MMA), depending on the dynamic range of the measurements, see example spectrum in Figure 2 [24]. While the total analysis time was 4 days of instrument time, the analyses were performed as time became available on the cLC-FTICR MS. Complete acquisition was performed over a period of less than a month; B1-Cit and B1-Serum samples were analyzed first and the others as analysis time was available.
Figure 2. Example cLC-FTICR mass spectrum illustrating resolution and mass accuracy.
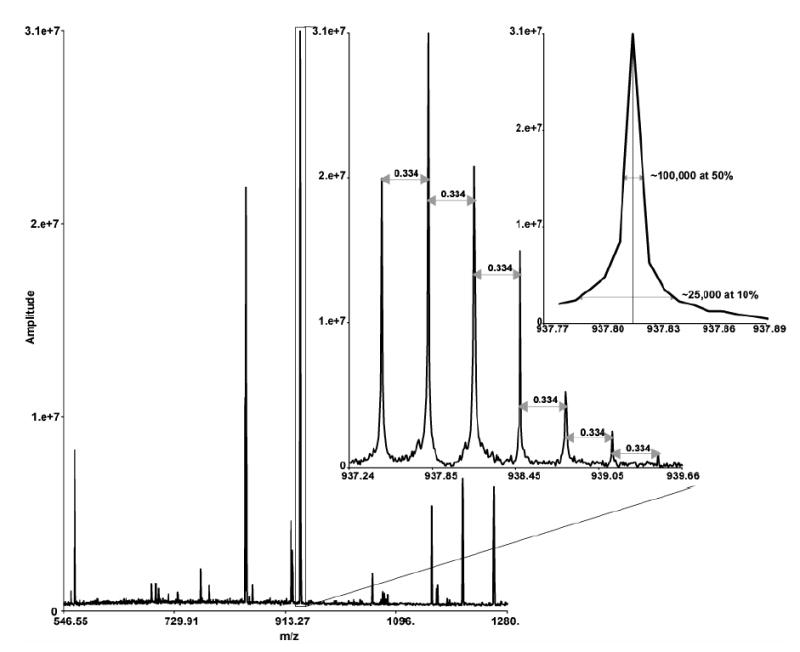
A peptide identification (VVSMDENFHPLNELIPLVYIQDPK) from alpha-2-macroglobulin with an average mass error of −0.4 ppm compared to the calculated mass. This peptide identification was made in scan 2000 and the normalized elution times for this identification were constrained to scan numbers 1994–2012.
cLC-FTICR MS data analysis
Each sample was analyzed in triplicate by cLC-FTICR MS. The resultant data were processed using the PRISM Data Analysis system, a series of software tools developed in-house. The first step involved de-isotoping the MS data to give the monoisotopic mass, charge, and intensity of the major peaks in each mass spectrum. Following this step, the data were examined in a two-dimensional fashion to identify the groups of mass spectral peaks that were observed in sequential spectra. Each group, which was generally ascribed to one detected species and referred to as a unique mass class (UMC), has a median mass, central normalized elution time (NET), and abundance estimate, computed by summing the intensities of the MS peaks that comprise the total UMC.
The peptide identities of UMCs were determined by comparing the measured mass and NET of each UMC to the calculated mass and observed NET of each of the 57,578 peptide identifications in the database; therefore the peak elutions were matched between processes. Search tolerances were ±6 ppm for the mass and ±5% of the total normalized run time for the elution time. This peak matching process gives a list of peptide identifications with scaled ion current values for each sample (Figure 2 is an example of a matched peak). An abundance of each protein (i.e., ORF) was estimated by averaging the peptide abundance values from the ion current. The peak matching confidence level for these identifications was defined as “high” when an AMT tag peptide was identified in at least 2 of the 3 replicates, and referred to throughout the text as high matched confidence. The identification was defined as “low” confidence if the peak was matched in only 1 of 3 replicates. When a peptide was identified in one sample, but not another, e.g. fibrinogen in plasma but not serum, the protein abundance of the missing protein was set at ½ the lowest ion current value observed in all 24 cLC-FTICR MS runs.
The false-positive rate of the AMT tag process was estimated by peak matching against a combined forward and reverse database. This approach estimated the overall false-positive rate as 8% for this dataset (calculated with combined databases as performed by Gygi and coworkers [32]), a substantial reduction from the 32% estimated using the HUPO SEQUEST filters without the Rsp filter. A second method to evaluate false positive error of the AMT tag approach is to use the mass error plot to estimate “false positive background”, i.e. those measurements that contribute to a “noise” baseline. The number of identifications that fall below the baseline are false positives, and the “true positive identifications”, are those that contribute to the peak centered at 0 ppm MMA. This value was calculated to be ~10% for this dataset (data not shown). To identify the level of degeneracy in the protein identifications ProteinProphet [33] was used as described in Qian et al. 2005 [34]. This analysis which provides a compressed number of identifications, distinguished 377 protein families.
OmniViz cluster and visual analysis
The AMT tag results were exported into comma-delimited files that contained IPI reference number, protein annotation, peptide (when prepared by peptide), and ion current for peptides or average ion current for proteins. This file was imported into OmniViz 3.6 (OmniViz, Maynard, MA) [35]. OmniViz was then configured to cluster the normalized data values for the triplicate datasets. As stated above, missing data were filled with a value ½ the lowest detected ion current value for an identified peptide (0.017 for this dataset, while the maximum scaled ion current was 282.475). These values were normalized by using the “Standard by Row” normalization in OmniViz to enable comparisons between samples. This normalization is also referred to as the Z-score and is calculated as follows:
Where X is the individual value, μx is the mean of the values from that row, and σx is the standard deviation of the values from that row. Generally, Z-scores differences between samples of at a least a value of 2 or greater (i.e., more than 2 standard deviations different) was considered significant. Z-score is a commonly used normalization method for microarray [36], in addition to being used for broader applications. The resulting data were then clustered using hierarchical clustering with 24 clusters by magnitude and shape. Additionally, OmniViz was used to visualize and cluster the high matched confidence peptide identifications (rolled up to proteins) and to generate Spearman’s pair-wise correlations for peptide abundance by sample. Since, the specific source of peptides can only be inferred from ProteinProphet [33] the peptides to redundant protein identifications were not used for subsequent cluster analysis and visualization.
Results
Putative mass and time (PMT) tag database
SEQUEST analysis of μLC-MS/MS data generated previously [15,17] against the July 2003 International Protein Index database was used to generate the PMT tag databases used for this work. The numbers of spectra analyzed by SEQUEST are summarized for both the HUPO-Dec_Submission set and the HUPO-Jul_Submission set (269,416 and 653,340 respectively) in Table 2. This table also includes the numbers of peptides that passed our standard SEQUEST filters for both datasets [27,29] and the numbers of PMT tags with an XCorr of >2.0. The multidimensional analysis of the PNNL reference serum [15] as used for the HUPO-Dec_Submission set was complemented by merging a second similar extensive multidimensional analysis [17] in the HUPO-Jul_Submission set. By merging the two datasets along with the use of stricter SEQUEST filters (see Methods) for the PMT tags, the overall confidence of the resulting peptide/protein identifications (i.e., AMT tags) was improved. Combining multidimensional analyses has been shown elsewhere to increase the completeness of a proteomic analysis [32,37,38]. Recent analyses of human plasma and other samples provided the basis for estimating the false-positives rates for SEQUEST results, although the filter rules were similar, but not identical to those used here for populating the PMT tag database [39,40]. The false-positive values for PMT identifications were 16–32%, depending on the calculation [39,40]. In this analysis, using the same approach as used previously published [31] we calculated a false positive rate of 32% for the filters used here for the mass and time tag database.
Table 2. Putative mass and time tag database summary.
PMT tag database statistics for both the 2003 HUPO-Dec_Submission set and the 2004 HUPO-Jul_Submission set (peptides identified 2 or more times are in parenthesis).
| LC-MS/MS Data Results type | HUPO-Dec_Submission | HUPO-Jul_Submission |
|---|---|---|
| Spectra analyzed by SEQUEST | 269,416 | 653,340 |
| Filtered peptide identificationsa | 17,018 | 51,591 |
| Unique peptides identifieda | 2,257 | 4,579 |
| Unique peptides identified 2 or more timesa | 1,087 | 2,393 |
| Peptide identifications (Washburn et al.)a | 17,018 | 51,591 |
| Peptide identifications (XCorr > 2.0)b | 34,319 | 77,284 |
| Peptide identifications (HUPO-like)c | 19,527 | 57,578 |
Peptides identification filtered by relatively routine criteria designed by the developers of SEQUEST [27,29] with the exception of manual analysis.
SEQUEST peptide identification criteria used previously with the AMT approach for microbial proteomics [22,30], internal designation MT_Human_P79.
SEQUEST filters with more stringent cut-offs, at least partially tryptic and a minimum DelCN of 0.1 with +1, +2, and +3 charge states using minimum XCorr values of 1.9, 2.2, 3.75 respectively with the exception of Rsp <=4, internal designation MT_Human_X112.
Summary of peptide/protein identifications by AMT tags
Any peptide identified by using the AMT tag approach was mapped to all proteins that contained that specific peptide to allow HUPO PPP the greatest latitude in making decisions with regard to reducing redundancy. For example, by eliminating redundancy, the total number of proteins identified were reduced by about half using ProteinProphet [33] (722 redundant proteins to 377 non- redundant proteins). All peptide-protein pairs (i.e. every peptide possible source from the IPI database was counted in the redundant protein numbers) were counted and the 2806 identifications from 1493 unique peptides represented the largest possible number of peptide-protein identifications for the 2004 HUPO-Jul_Submission set (Table 3). The high matched confidence, operationally defined as those found in at least 2 of 3 triplicates, peptide-protein pairs reduced to 2298 peptide-protein pairs from 1225 high confidence peptide identifications for the 2004 HUPO-Jul_Submission set (Table 3). Each AMT tag peptide mapped to an average of two proteins due to the degeneracy of the human protein FASTA file and the nature of human proteins. Those peptide identifications that mapped to multiple proteins tended to be higher confidence (by reproducibility) than those mapped to a single protein entry (data not shown).
Table 3. Accurate mass and time tag data summary.
AMT tag database statistics for both the 2003 HUPO-Dec_Submission set and the 2004 HUPO-Jul_Submission set. High matched confidence was defined here as an AMT tag measured in at least 2 of 3 triplicates. Unique peptide-protein pairs are those peptides that map to a single protein.
| AMT tag Date Results Type | HUPO- Dec_Submissiona | HUPO- Jul_Submissionb |
|---|---|---|
| All Possible Peptide-Protein Pairs | 4473 | 2806 |
| High Matched Confidence Peptide- Protein Pairs | 2811 | 2298 |
| Unique Peptide-Protein pairs | 2802 | 1493 |
| High Matched Confidence Unique Peptides | 1704 | 1225 |
| All Putative Proteins | 2625 | 842 |
| High Matched Confidence Proteins | 1366 | 585 |
The false-positive peptide identifications were high (32%) for the PMT mass and time tag database based on SEQUEST results. However, the use of high MMA and NETs afforded by the AMT tag approach significantly improved the confidence in peptide identifications over SEQUEST analyses alone [21,22]. The estimated false-positive errors for these AMT identifications are estimated between 8–10% depending on the method used.
The total instrument time required for cLC-FTICR MS analysis of 8 samples in triplicate (i.e., 24 cLC-FTICR runs) was 4 days. The results from our high throughput analyses are comparable to protein identifications obtained at most of the other laboratories participating in the HUPO plasma pilot project (see the HUPO PPP compilation paper). Because our results were analyzed in triplicate, we were able to increase the general confidence in an AMT tag peptide identification. Using the HUPO-Jul_Submission set PMT tag database, 585 proteins were identified with high confidence by reproducibility (Table 3).
Protein concentration estimates from ion current
The average of the ion current for all the peptides identified for a particular protein were compared with the concentrations determined by certified assays performed on the BN II at Dade Behring (Haab et al. 2003 in Review, HUPO PPP website) (Figure 3). A linear correlation on a log-log plot was used to describe the relationship between MS “abundance” defined by ion current and the concentration measured by BN II immunoassay technology. Note that the correlation between proteins measured by MS versus by immunoassay techniques will be imperfect, due in part to factors such as the ambiguity in the IPI protein entries actually measured by the BN II, mapping of multiple peptides to multiple proteins, variations in ionization efficiencies, epitope specificity of immunoassays, and multiple subunits and isoforms, e.g. fibrinogens, etc. (Figure 3).
Figure 3. Correlation between protein abundance estimate from cLC-FTICR-MS and protein concentrations measured by standard clinical chemistry methods.
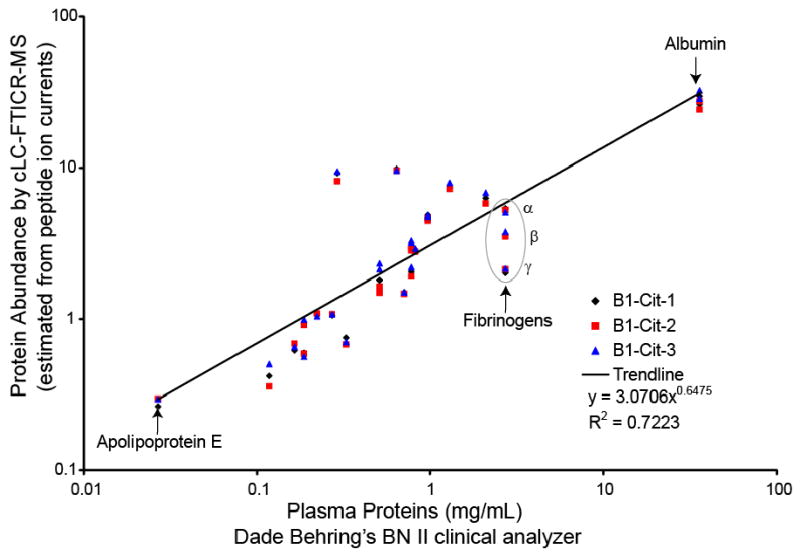
Average peptide ion currents from cLC-FTICR MS and measurements performed on BN II clinical analyzer (Dade Behring) were compared for 18 proteins in the B1-CIT sample. The triplicate ion current value for each analysis was plotted with multiple protein entries where appropriate (e.g., fibrinogen was mapped to multiple IPI numbers representing fibrinogen α, β, and γ). Selected proteins are also shown on the graph for perspective. The proteins on the graph in order of increasing abundance are: apoplipoprotein E, plasminogen, complement C4, ceruloplasmin, transthyretin, antithrombin-III, apolipoprotein A-II, fibronectin, alpha-1-acid glycoprotein 1, hemopexin, complement component 3, haptoglobin, alpha-2-macroglobulin, alpha-1-antitrypsin, apolipoprotein A-I, transferrin, fibrinogen, albumin.
Global protein analysis
The high confidence protein identifications from the HUPO-Jul_Submission set were analyzed using hierarchical cluster analysis with the OmniViz™ program. Normalization by Z-score on the calculated protein abundance values was used to facilitate cross-comparisons between samples based on the ion current measure of protein abundance used in Figure 3. Although differences in normalized ion currents were observed for different samples, in general the samples are very similar and the Z-score values reflect this general similarity (Figure 4). A cluster containing reproducible differences between serum and plasma samples is shown in Figure 5. This cluster partly illustrates the obvious difference in abundance of fibrinogens in plasma and serum; the clotting process removes fibrinogen from serum. A number of proteins, including some hypothetical proteins, appeared to be present at relatively higher concentrations in plasma than in serum, e.g., zonadhesin. This protein has some known functions related to sperm and would appear unlikely to be present in plasma, but interestingly, this protein contains 5 von Willebrand D domains, which are common in blood proteins and are involved in clotting [41]. Zonadhesin was also reported by Hefta and collegues (laboratory 12). Activin-like receptors appeared to be found preferentially in plasma and were reported by us, as well as by Hefta and collegues (laboratory 12), and Wang and collegues (laboratory 12). For each sample, 787±68 high confidence peptides were identified and an average of 430±23 redundant high confidence proteins putatively identified (Table 4). The protein composition of plasma vs. serum revealed both expected and unexpected results. Figure 5 shows a group of proteins differentially abundant in plasma and serum identified by non-supervised clustering. A more detailed view of individual plasma / serum pairs is constructed by calculating the abundance ratio (ion current) for all ‘high confidence’ protein identifications common to the sample pair. For example, the African American plasma – serum (B2-CIT & B2-Serum) contained 365 high confidence proteins common to both samples (Figure 6). Of these, 59 (16%) were 2-fold, or more abundant in plasma than in serum, representing proteins that are retained in the clot. In addition to the anticipated fibrinogens and other clotting proteins, 18/59 were consistently depleted in all four plasma / serum sample pairs analyzed. This consistency suggests that the depletion of these proteins (e.g. melanoma inhibitory activity protein 2; sodium/calcium exchanger 2 precursor, titin, zonadhesin precursor, etc.) in serum is a real phenomena.
Figure 4. Corescape view of the 842 high matched confidence proteins normalized by Z-score.
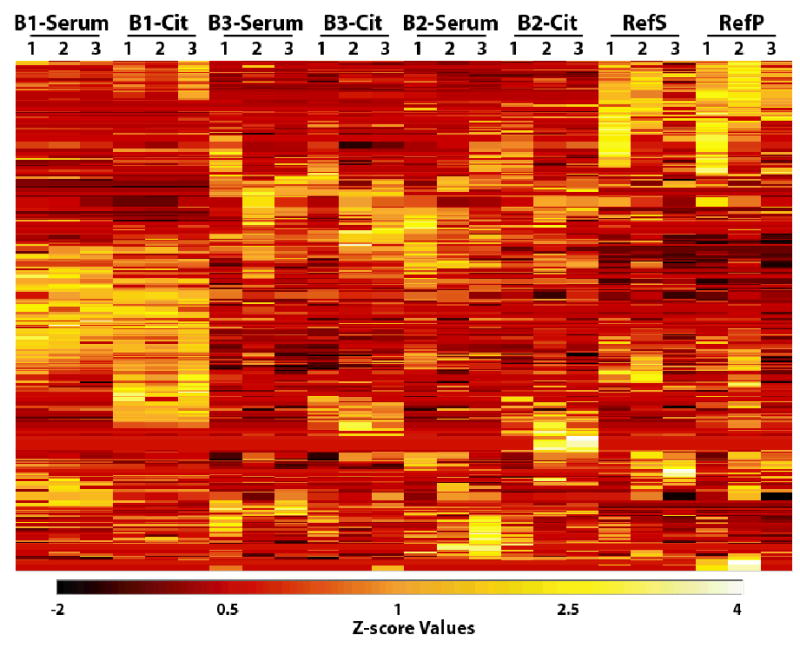
This view was generated from a cluster analysis of Z-score normalized protein abundances using triplicate data for each sample. A number of proteins that appear to be present in relatively higher amounts can be observed in the B1-SERUM and B1-CIT samples. This view shows a high similarity with the results from the B3-SERUM, B3-CIT, B2-SERUM, and B2-CIT samples. The RefS and RefP are more similar to each other than to the HUPO samples.
Figure 5. Identification of proteins differentially abundant in citrated-plasma and serum.
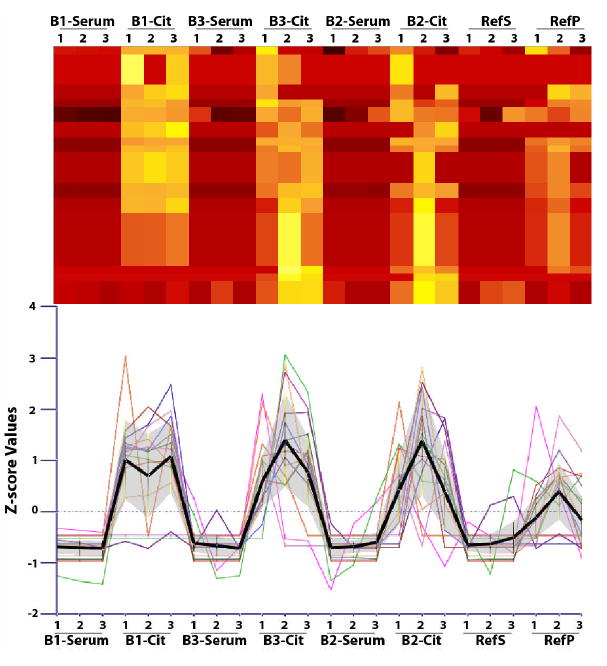
This illustration shows a heat map of a serum/plasma specific cluster from results in Figure 4 and a profile plot. The black profile shows the average value of this cluster and the grey region above and below that profile represents one standard deviation from the measurements.
Table 4. Summary of peptide/protein identifications using the AMT tag approach.
A summary of peptide and protein identification statistics by sample.
|
High Matched Confidence Unique |
All Unique |
CVa |
Peptide Dynamic Rangeb | ||||
|---|---|---|---|---|---|---|---|
| Peptide | Protein | Peptide | Protein | Mean | Median | ||
| B3-CIT | 750 | 435 | 939 | 634 | 33.9 | 29.3 | 4585 |
| B3-SERUM | 682 | 379 | 926 | 633 | 39.7 | 36.4 | 3524 |
| B2-CIT | 792 | 455 | 1008 | 664 | 37.9 | 34.8 | 4361 |
| B2-SERUM | 713 | 428 | 915 | 634 | 38.7 | 35.2 | 3717 |
| B1-CIT | 864 | 441 | 975 | 572 | 19.0 | 13.5 | 3260 |
| B1-SERUM | 847 | 425 | 937 | 542 | 19.9 | 15.4 | 4234 |
| RefP | 860 | 447 | 1104 | 706 | 41.9 | 37.6 | 5028 |
| RefS | 787 | 433 | 1016 | 701 | 41.7 | 37.6 | 5168 |
Coefficient of variation was calculated from average of the ion current values of all confident protein identifications.
Dynamic range was based on the highest and lowest observed ion current values of an identified peptide.
Figure 6. Abundance ratio of proteins in B2-CIT to B2-Serum.
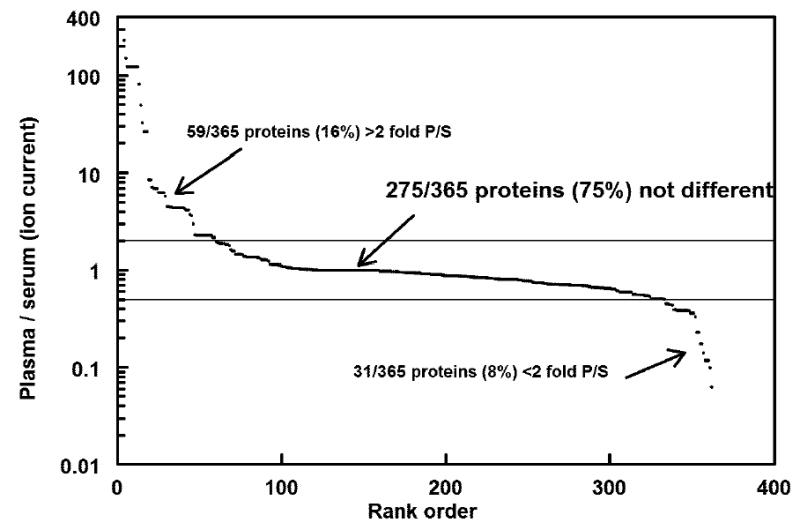
365 proteins were identified with high matched confidence and ranked by the plasma/serum abundance (ion current) ratio. Ratios greater than 2 fold identify plasma proteins that were depleted in serum.
More unexpectedly, approximately 30 proteins (8%) are 2-fold more abundant in serum than in plasma. Nine proteins were consistently more abundant in serum in all four plasma / serum sample pairs analyzed. These serum-enriched proteins include cell division cycle protein 91-like 1, Phosphorylase kinase (alpha 1), splice form 2 of P46020 Phosphorylase B kinase alpha regulatory chain, and a hypothetical protein. This phenomenon was validated independently by micro-ELISA analysis of several cytokines in these same HUPO samples which revealed that RANTES and PDGF-AA were consistently more abundant in serum in all four plasma / serum sample pairs. This apparent enrichment in serum is more difficult to explain than depletion in serum, although several processes could be proposed. First, removal of clot-associated proteins simplifies the composition of the serum compared to plasma. The resultant simplification in the peptide mixture could facilitate more effective measurement of certain peptides in serum than in plasma. Secondly, it is a conceivable that the serum-enriched proteins are derived from platelet activation. We found thirteen proteins previously associated with platelets [42,43]. These 13 proteins include cytoskeleton, and protein processing, and other proteins not specifically expressed in platelets. Unfortunately none of these 13 proteins was enriched in serum and thus the potential role of platelets to the phenomena of serum enrichment is not clear. Thirdly, the apparent serum enrichment could be an artifact of differential post-translational modifications in plasma vs. serum. The AMT tag approach identifies peptides, including modified peptides, which were previously identified. For example, if serum contained higher phosphorylase activity than plasma, the unphosphorylated peptide would be higher in serum than in plasma resulting in the observation that the protein was enriched in serum.
A pair-wise Spearman’s correlation of peptide abundance was performed and interesting visible features resulted (Figure 7). The columns were allowed to associate with the most closely correlated counterpart, i.e., the analyses that are most similar are next to each other in Figure 7. Interestingly, the HUPO sera grouped together, which shows higher correlation, as did the HUPO plasma analyses. The PNNL reference samples correlated into a separate group, appropriately revealing that serum and plasma were from a different female-only commercial source (Figure 7).
Figure 7. Pairwise Spearman’s correlations of peptide abundance by analysis.
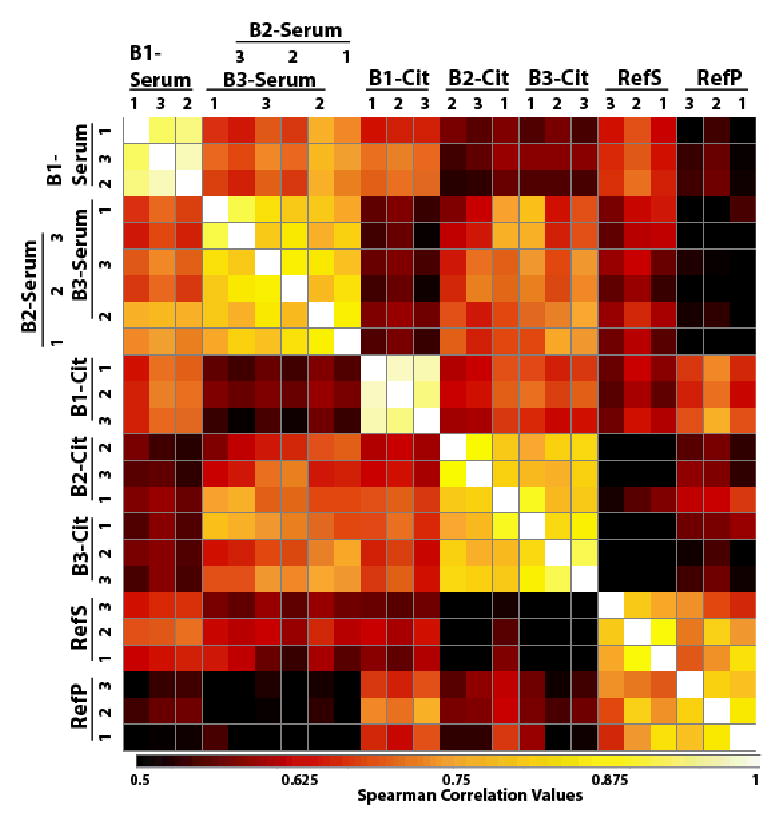
Pairwise correlations [53] of the peptide abundances with the columns and rows are set to pair up by the highest correlation. The darker squares represent the least correlated and the lightest the most highly correlated (scale is set to low value of 0.5 to give a greater visual range to the various values). Highest correlations are within individual samples except in the case of Asian-American and African-American serum samples that exhibited intermixed similarity. In general, the sera and the plasmas were more closely correlated with the exception of the PNNL Ref samples that were from a different source and contained only female serum/plasma.
Discussion
Application of FTICR-MS as a proteomic technology bridge
Over the past decade, proteomics has largely focused on technology development. Many of the major proteomic technologies have specific niches, e.g., MudPIT or similar “shotgun” proteomics for discovering new proteins in samples with some quantitation [27], SELDI-MS for searching for new drug targets and disease markers along with MS spectra algorithms for potentially identifying individuals with disease or a propensity for disease [44], and protein microarrays for measuring the concentrations of known proteins for research applications and potentially disease diagnosis (see another HUPO PPP related paper by Haab et al. submitted). For our study, we used the AMT tag technology that bridges the gaps among some of these other major technologies.
Advantages of the this approach include an estimate of concentration, putative identification of proteins with patterns of interest.. This method and similar approaches are likely to be of greater use in the coming years with the recent additional commercialization and competition of FTICR instrumentation. Some instruments, such as those with linear ion traps with FTICR mass analyzers are particularly exciting in that the AMT tag approach could be undertaken with simultaneous enrichment of a PMT tag database. MALDI approaches could also be used to attain similar types of information determined by the AMT tag approach.
The recent introduction of linear ion traps combined with FTICR mass spectrometers provides new opportunities to take advantage of the high mass accuracy and faster scan times of these instruments. Especially exciting are approaches that may potentially revive many top-down proteomics approaches, including the work of Speicher and colleagues and Karger and collegues in this special issue [45]. A second approach complimentary to the AMT approach taken here is extend the confidence of peptide identifications by MS/MS/MS or MS3 [46]. These authors illustrated that MS3 combined with the high MMA improved peptide identification by Mascot.
Confidence in any MS-based proteomic approach
Considerable research effort has been directed at determining appropriate data filters, protease cleavage states, mass measurement accuracy, and the number of peptide identifications required for a confident protein identification [15, 17, 27, 32, 46–50]. Blood serum and plasma are increasingly proving to be a more difficult to fully characterize with traditional proteomic technologies, as shown by both the HUPO and other efforts. Critical assumptions involving data filters and peptide identifications that have been used effectively in other proteomic efforts will likely need to be modified for plasma and other body fluids and tissues [39, 51].
Importantly, the identification confidence for peptides does not directly correlate to the identification confidence for proteins identified from these peptides. This distinction has not been sufficiently emphasized in the past. Most methodologies have attempted to limit false-positive peptide identifications to typically <1% of the total number of peptide identifications; however, the false-positive estimates for human proteomics are still regarded as higher. The false-positive incidences for proteins are often considered to be of similar magnitude as the peptides. However, protein misidentifications are actually greater because even correct peptide identifications can result proteins with multiple identifications. Thus, the false-positive incidence for proteins identified by single peptide identifications should be viewed as having a higher false-positive rate than that for peptide identifications.
A second issue in establishing the confidence of protein identifications concerns the use of a protease cleavage state in peptide identifications. One school of thought has been that nearly all peptides result from highly specific digestion by the exogenous protease, typically trypsin, and thus all confident peptide identifications should conform to fully tryptic digestion patterns (e.g., [10, 48]). Alternatively, complex protein mixtures processed by endogenous proteases may contain unexpected amino- and carboxy- termini, resulting in non-tryptic cleavage states (e.g., [15, 18, 27]). Regardless, there is general agreement that identifications based on partially digested, missed digestion sites, and digestion inconsistent with the exogenous protease of choice are much less confident than peptide identifications that completely conform to the expected specificity of the exogenous protease used for a proteomic analysis. At the same time there are clearly many examples of peptides that are found in plasma that are not derived by the most common exogenous protease and would result in, at best, “partially” tryptic peptides; examples with trypsin are angiotensinogen I, angiotensinogen II, and vassopressin (G.DRVYIHPFHL.V, G.DRVYIHPF.H, and A.CYFQNCPRG.G, respectively). These potential partially-tryptic peptides arise from the normal biological processing of inactive precursor molecules. Thus, peptides that do not conform to the protease used should be carefully considered in the context of the underlying biology and the goals of a proteomic experiment.
In order to maintain consistency with the other laboratories analyzing HUPO samples, our present peptide identifications require at least a partially-tryptic state. It should be noted that HUPO criteria also had an Rsp <= 4 filter, which tends to offset the partially-tryptic misidentifications. At the time of this analysis our peak matching process was not set-up to use Rsp criteria.
A third issue related to protein identification confidence is the application of various analysis tools and data filters to MS/MS data for peptide identification. For example, numerous filtering methods for SEQUEST data are available [15, 27, 32, 47, 49, 50]; all try to set the best balance for sensitivity and specificity. In the development of our AMT tags, we conformed to the data analysis approaches used by other laboratories involved with HUPO plasma samples with the exception of using Rsp ≤4 (see Methods).
Peptide/protein redundancy
Due in part to the large number of redundant entries in the July 2003 IPI protein database, as well as the presence of conserved peptide and protein sequences in the human genome, each peptide was mapped, on average, to two different protein entries. In many cases it was impossible or undesirable to “identify” a specific protein from the peptides observed. For example, haptoglobin alleles 1 and 2, and haptoglobin-related protein all contain a great deal of sequence identity. The three proteins haptoglobin-1, haptoglobin-2, and haptoglobin-related protein are used as examples of the information that would be lost if protein identifications required peptides unique to a single protein (Table 5). Haptoglobin-1 or haptoglobin-2 would be considered non-detected over the entire analysis because no specific unique peptides are present (Table 5). Furthermore, only the B1-CIT sample contained a peptide that was unique to only haptoglobin-2 (only in the HUPO-Dec_Submission set). This observation corresponded to other measurements that showed the B1-CIT/B1-SERUM sample had the highest haptoglobin-2 concentration relative to the B3-CIT/B3-SERUM samples and that the B2-CIT/B2-SERUM samples contained no haptoglobin-2 (personal communication of Alex Rai).
Table 5. Example of peptide overlap between human proteins, using haptoglobin.
Haptoglobin-1, haptoglobin-2, and haptoglobin-related protein derived peptide identifications and possible source. Unique peptides assigned to a single protein are in the shaded rows. High matched confidence peptide identifications were those that were found to be identified by the AMT tag approach in at least one specific sample in 2 or 3 triplicates. NP under confidence shows peptides not present in the 2004 HUPO-Jul_Submission set, but was found with the previous 2003 HUPO-Dec_Submission set.
| Confidence | Peptide | Haptoglobin 1 | Haptoglobin 2 | Haptoglobin related protein |
|---|---|---|---|---|
| High | SPVGVQPILNEHTF | ✓ | ✓ | ✓ |
| High | AVGDKLPECEAVCGKPK | ✓ | ✓ | ✓ |
| High | DIAPTLTLYVGK | ✓ | ✓ | ✓ |
| High | DIAPTLTLYVGKK | ✓ | ✓ | ✓ |
| High | ILGGHLDAK | ✓ | ✓ | ✓ |
| High | KQLVEIEK | ✓ | ✓ | ✓ |
| High | NPANPVQR | ✓ | ✓ | ✓ |
| High | QLVEIEK | ✓ | ✓ | ✓ |
| High | SCAVAEYGVYVK | ✓ | ✓ | ✓ |
| High | VTSIQDWVQK | ✓ | ✓ | ✓ |
| High | VMPICLPSK | ✓ | ✓ | ✓ |
| High | TSIQDWVQK | ✓ | ✓ | ✓ |
| High | GSFPWQAK | ✓ | ✓ | ✓ |
| High | LRTEGDGVYTLNNEK | ✓ | ✓ | |
| High | YQEDTCYGDAGSAFAVHDLEEDTWYATGILSFDK | ✓ | ✓ | |
| High | VVLHPNYSQVDIGLIK | ✓ | ✓ | |
| High | HYEGSTVPEK | ✓ | ✓ | |
| High | HYEGSTVPEKK | ✓ | ✓ | |
| High | VMPICLPSKDYAEVGR | ✓ | ✓ | |
| High | SPVGVQPILNEHTFCAGMSK | ✓ | ✓ | |
| High | TEGDGVYTLNNEK | ✓ | ✓ | |
| High | VGYVSGWGR | ✓ | ✓ | |
| High | YVMLPVADQDQCIR | ✓ | ✓ | |
| High | DYAEVGR | ✓ | ✓ | |
| High | GYVSGWGR | ✓ | ✓ | |
| High | PPEIAHGYVEHSVR | ✓ | ✓ | |
| High | TEGDGVYTLNDK | ✓ | ✓ | |
| High | TEGDGVYTLNDKK | ✓ | ✓ | |
| High | LRTEGDGVYTLNDK | ✓ | ✓ | |
| High | LRTEGDGVYTLNDKK | ✓ | ✓ | |
| High | VGYVSGWGQSDNFK | ✓ | ||
| High | VVLHPNYHQVDIGLIK | ✓ | ||
| Low | AVGDKLPECEAVCGK | ✓ | ✓ | ✓ |
| Low | NYAEVGR | ✓ | ||
| NP | AVGDKLPECEADDGCPKPPEIAHGYVEHSVR | ✓ | ||
| NP | LPECEADDGCPKPPEIAHGYVEHSVR | ✓ | ||
| NP | SPVGVQPILNEHTFCVGMSK | ✓ |
Identification sensitivity vs. specificity
A constant concern with all MS-based proteomics approaches involves false-positive and -negative identifications. Another aspect of the same problem stems from the need to balance sensitivity and specificity in various proteomic analyses. Following direction from the HUPO PPP group, both high and low confidence (based on reproducibility) results were included in the data analysis of the HUPO-Jul_Submission set. “High matched confidence” identifications were based upon detection via our peak matching software of at least 2 of 3 triplicates. As a result of revised preferences of the HUPO PPP group, we used stricter SEQUEST rules for peptide identifications in our PMT tag database. Because the AMT tag analysis approach is constrained by the MS/MS data in the PMT tag database, our reported identifications represent only a subset of the SEQUEST identifications from the IPI July 2003 protein database. In a preliminary analysis, there were approximately 1000 high abundance and highly reproducible UMCs (mass and time features) in the B1-CIT sample that did not map to PMT tags (data not shown).
Throughput and differential analysis
An advantage of the AMT tag strategy is increased throughput compared with other “shotgun” proteomics approaches. Additionally, this high throughput strategy provides a basis for comparative analysis of the results. Depending on the fractionation approach and MS conditions used, a multi-dimensional analysis (i.e., strong cation exchange followed by LC-MS/MS) typically requires the minimum of a day to many weeks. However, by employing the AMT tag approach, we were able to leverage peptides identifications from two previous multi-week multi-dimensional analyses [15,17] to serve as the reference mass and time tag database to identify peptides in triplicate analyses from eight samples in only 4 days total instrument time. The throughput of this analysis is significantly higher than traditional “shotgun” proteomics. Another advantage of the rapid turn over of the chromatography and instrumentation is that replicate sample results are more comparable, albeit there were some differences in unnormalized peptide abundances when significant time lapsed during analysis (Figure 4).
A major disadvantage of the AMT tag approach used here is that peptides must be observed before they show up as in the subsequent analysis. Data directed methodologies would also need to be applied to adjust to new relevent features found in clinical samples. Also, analysis of the plasma and serum samples in this study make it clear that even the AMT tag method will not be completely successful without protein depletion or enrichment procedures. A recent enrichment example using the AMT tag approach in another system [52] shows promise when used with depletion strategies.
Acknowledgments
The authors would like to thank Mary Lipton, Gordon Anderson, Eric Strittmatter, BD Diagnostic and their blood donors, Gil Omenn, and Sam Hanash who made specific contributions that helped lead to this publication. This work was performed in the Environmental Molecular Sciences Laboratory, a U.S. Department of Energy (DOE) national scientific user facility at PNNL, with special thanks to Harold Udseth and Ronald Moore. We would also like to acknowledge Mark Gritz and David Koppenaal for their support and encouragement. Portions of this work were supported, by Battelle Columbus Operations (IR&D) and the National Institutes of Health (NCI CA78722). The Proteomics National Center for Research Resources is gratefully acknowledged for use of previously acquired MS/MS spectra in plasma (RR18522) and by Battelle Columbus Operations (IR&D). PNNL is operated by Battelle for the DOE under Contract No. DE-AC06-76RLO 1830.
Footnotes
Supplemental results are provided on the public HUPO PPP website (site pending), Results for Laboratory Number 28.
References
- 1.Baldwin MA. Protein identification by mass spectrometry: Issues to be considered. Mol Cell Proteomics. 2003 doi: 10.1074/mcp.R300012-MCP200. [DOI] [PubMed] [Google Scholar]
- 2.Anderson NL, Polanski M, Pieper R, Gatlin T, Tirumalai RS, Conrads TP, Veenstra TD, Adkins JN, Pounds JG, Fagan R, Lobley A. The human plasma proteome: A nonredundant list developed by combination of four separate sources. Mol Cell Proteomics. 2004;3:311–326. doi: 10.1074/mcp.M300127-MCP200. [DOI] [PubMed] [Google Scholar]
- 3.Taylor CF, Paton NW, Garwood KL, Kirby PD, Stead DA, Yin Z, Deutsch EW, Selway L, Walker J, Riba-Garcia I, Mohammed S, Deery MJ, Howard JA, Dunkley T, Aebersold R, Kell DB, Lilley KS, Roepstorff P, Yates JR, 3rd, Brass A, Brown AJ, Cash P, Gaskell SJ, Hubbard SJ, Oliver SG. A systematic approach to modeling, capturing, and disseminating proteomics experimental data. Nat Biotechnol. 2003;21:247–254. doi: 10.1038/nbt0303-247. [DOI] [PubMed] [Google Scholar]
- 4.Omenn GS. The human proteome organization plasma proteome project pilot phase: Reference specimens, technology platform comparisons, and standardized data submissions and analyses. Proteomics. 2004;4:1235–1240. doi: 10.1002/pmic.200300686. [DOI] [PubMed] [Google Scholar]
- 5.Hanash S. HUPO initiatives relevant to clinical proteomics. Mol Cell Proteomics. 2004;3:298–301. doi: 10.1074/mcp.R400004-MCP200. [DOI] [PubMed] [Google Scholar]
- 6.Anderson NL, Anderson NG. The human plasma proteome: History, character, and diagnostic prospects. Mol Cell Proteomics. 2002;1 doi: 10.1074/mcp.r200007-mcp200. [DOI] [PubMed] [Google Scholar]
- 7.Rose K, Bougueleret L, Baussant T, Bohm G, Botti P, Colinge J, Cusin I, Gaertner H, Gleizes A, Heller M, Jimenez S, Johnson A, Kussmann M, Menin L, Menzel C, Ranno F, Rodriguez-Tome P, Rogers J, Saudrais C, Villain M, Wetmore D, Bairoch A, Hochstrasser D. Industrial-scale proteomics: From liters of plasma to chemically synthesized proteins. Proteomics. 2004;4:2125–2150. doi: 10.1002/pmic.200300718. [DOI] [PubMed] [Google Scholar]
- 8.Wu SL, Choudhary G, Ramstrom M, Bergquist J, Hancock WS. Evaluation of shotgun sequencing for proteomic analysis of human plasma using HPLC coupled with either ion trap or fourier transform mass spectrometry. J Proteome Res. 2003;2:383–393. doi: 10.1021/pr034015i. [DOI] [PubMed] [Google Scholar]
- 9.Wu S-L, Amato H, Biringer R, Choudhary G, Shieh P, Hancock WS. Targeted proteomics of low-level proteins in human plasma by lc/msn: Using human growth hormone as a model system. J Proteome Res. 2002;1:459–465. doi: 10.1021/pr025537l. [DOI] [PubMed] [Google Scholar]
- 10.Marshall J, Jankowski A, Furesz S, Kireeva I, Barker L, Dombrovsky M, Zhu W, Jacks K, Ingratta L, Bruin J, Kristensen E, Zhang R, Stanton E, Takahashi M, Jackowski G. Human serum proteins preseparated by electrophoresis or chromatography followed by tandem mass spectrometry. J Proteome Res. 2004;3 doi: 10.1021/pr034039p. [DOI] [PubMed] [Google Scholar]
- 11.Anderson L, Anderson NG. High resolution two-dimensional electrophoresis of human plasma proteins. Proc Natl Acad Sci U S A. 1977;74:5421–5425. doi: 10.1073/pnas.74.12.5421. [DOI] [PMC free article] [PubMed] [Google Scholar]
- 12.Liotta LA, Ferrari M, Petricoin E. Clinical proteomics: Written in blood. Nature. 2003;425:905. doi: 10.1038/425905a. [DOI] [PubMed] [Google Scholar]
- 13.Merrick BA. The human proteome organization (HUPO) and environmental health. EHP Toxicogenomics. 2003;111:1–5. [PubMed] [Google Scholar]
- 14.Graham R. Growing plasma proteome sets stage for new diagnostics. J Proteome Res. 2004;3:163. [PubMed] [Google Scholar]
- 15.Adkins JN, Varnum SM, Auberry KJ, Moore RJ, Angell NH, Smith RD, Springer DL, Pounds JG. Toward a human blood serum proteome: Analysis by multidimensional separation coupled with mass spectrometry. Mol Cell Proteomics. 2002;1:947–955. doi: 10.1074/mcp.m200066-mcp200. [DOI] [PubMed] [Google Scholar]
- 16.Pieper R, Gatlin CL, Makusky AJ, Russo PS, Schatz CR, Miller SS, Su Q, McGrath AM, Estock MA, Parmar PP, Zhao M, Huang ST, Zhou J, Wang F, Esquer-Blasco R, Anderson NL, Taylor J, Steiner S. The human serum proteome: Display of nearly 3700 chromatographically separated protein spots on two-dimensional electrophoresis gels and identification of 325 distinct proteins. Proteomics. 2003;3:1345–1364. doi: 10.1002/pmic.200300449. [DOI] [PubMed] [Google Scholar]
- 17.Shen Y, Jacobs JM, Camp DG, 2nd, Fang R, Moore RJ, Smith RD, Xiao W, Davis RW, Tompkins RG. Ultra-high-efficiency strong cation exchange lc/rplc/ms/ms for high dynamic range characterization of the human plasma proteome. Anal Chem. 2004;76:1134–1144. doi: 10.1021/ac034869m. [DOI] [PubMed] [Google Scholar]
- 18.Tirumalai RS, Chan KC, Prieto DA, Issaq HJ, Conrads TP, Veenstra TD. Characterization of the low molecular weight human serum proteome. Mol Cell Proteomics. 2003 doi: 10.1074/mcp.M300031-MCP200. [DOI] [PubMed] [Google Scholar]
- 19.Burtis CA, Ashwood ER. Tietz fundamentals of clinical chemistry. Fifth Ed. W. B. Saunders Company; Philadelphia: 2001. [Google Scholar]
- 20.Pasa-Tolic L, Masselon C, Barry RC, Shen Y, Smith RD. Proteomic analyses using an accurate mass and time tag strategy. Biotechniques. 2004;37:626–633. doi: 10.2144/04374RV01. [DOI] [PubMed] [Google Scholar]
- 21.Anderson KK, Monroe ME, Daly DS. Estimating probabilities of peptide assignments to LC-FTICR-MS observations. Proc of the Intern Conf METMBS. 2004:151–156. [Google Scholar]
- 22.Smith RD, Anderson GA, Lipton MS, Pasa-Tolic L, Shen Y, Conrads TP, Veenstra TD, Udseth HR. An accurate mass tag strategy for quantitative and high-throughput proteome measurements. Proteomics. 2002;2:513–523. doi: 10.1002/1615-9861(200205)2:5<513::AID-PROT513>3.0.CO;2-W. [DOI] [PubMed] [Google Scholar]
- 23.Masselon C, Pasa-Tolic L, Tolic N, Anderson DJ, Bogdanov B, Vilkov AN, Shen Y, Zhao R, Qian W-J, Lipton MS, Camp DG, 2nd, Smith RD. Targeted comparative proteomics by liquid chromatography-tandem fourier transform mass spectrometry. Anal Chem. 2005;76 doi: 10.1021/ac049043e. [DOI] [PMC free article] [PubMed] [Google Scholar]
- 24.Belov ME, Anderson GA, Wingerd MA, Udseth HR, Tang K, Prior DC, Swanson KR, Buschbach MA, Stritmatter EF, Moore RJ, Smith RD. An automated high performance capillary liquid chromatography-fourier transform ion cyclotron resonance mass spectrometer for high-throughput proteomics. J Am Soc Mass Spectrom. 2004;15:212–232. doi: 10.1016/j.jasms.2003.09.008. [DOI] [PubMed] [Google Scholar]
- 25.Yates JR, 3rd, Carmack E, Hays L, Link AJ, Eng JK. Automated protein identification using microcolumn liquid chromatography-tandem mass spectrometry. Methods Mol Biol. 1999;112:553–569. doi: 10.1385/1-59259-584-7:553. [DOI] [PubMed] [Google Scholar]
- 26.Yates JR, 3rd, McCormack AL, Eng JK. Analytical and Chemistry News & Features. 1996. pp. 534–540. [Google Scholar]
- 27.Washburn MP, Wolters D, Yates JR., 3rd Large-scale analysis of the yeast proteome by multidimensional protein identification technology. Nat Biotechnol. 2001;19:242–247. doi: 10.1038/85686. [DOI] [PubMed] [Google Scholar]
- 28.Link AJ, Eng J, Schieltz DM, Carmack E, Mize GJ, Morris DR, Garvik BM, Yates JR., 3rd Direct analysis of protein complexes using mass spectrometry. Nat Biotechnol. 1999;17:676–682. doi: 10.1038/10890. [DOI] [PubMed] [Google Scholar]
- 29.Eng JK, McCormack AL, Yates JR. An approach to correlate tandem mass-spectral data of peptides with amino-acid-sequences in a protein database. Journal of the American Society for Mass Spectrometry. 1994;5:976–989. doi: 10.1016/1044-0305(94)80016-2. [DOI] [PubMed] [Google Scholar]
- 30.Lipton MS, Pasa-Tolic L, Anderson GA, Anderson DJ, Auberry DL, Battista JR, Daly MJ, Fredrickson J, Hixson KK, Kostandarithes H, Masselon C, Markillie LM, Moore RJ, Romine MF, Shen Y, Stritmatter E, Tolic N, Udseth HR, Venkateswaran A, Wong KK, Zhao R, Smith RD. Global analysis of the deinococcus radiodurans proteome by using accurate mass tags. Proc Natl Acad Sci U S A. 2002;99:11049–11054. doi: 10.1073/pnas.172170199. [DOI] [PMC free article] [PubMed] [Google Scholar]
- 31.Qian W-J, Liu T, Monroe ME, Strittmatter EF, Jacobs JM, Kangas LJ, Petritis K, Camp DG, 2nd, Smith RD. Probability-based evaluation of peptide and protein identifications from tandem mass spectrometry and sequest analysis: The human proteome. J Proteome Res. 2005 doi: 10.1021/pr0498638. [DOI] [PubMed] [Google Scholar]
- 32.Peng J, Elias JE, Thoreen CC, Licklider LJ, Gygi SP. Evaluation of multidimensional chromatography coupled with tandem mass spectrometry (lc/lc-ms/ms) for large-scale protein analysis: The yeast proteome. J Proteome Res. 2003;2:43–50. doi: 10.1021/pr025556v. [DOI] [PubMed] [Google Scholar]
- 33.Nesvizhskii AI, Keller A, Kolker E, Aebersold R. A statistical model for identifying proteins by tandem mass spectrometry. Anal Chem. 2003;75:4646–4658. doi: 10.1021/ac0341261. [DOI] [PubMed] [Google Scholar]
- 34.Qian W-J, Monroe ME, Liu T, Jacobs JM, Anderson GA, Shen Y, Moore RJ, Anderson DJ, Zhang R, Calvano SE, Lowry SF, Xiao W, Moldawer LL, Davis RW, Tompkins RG, Camp DG, 2nd, Smith RD. Quantitative proteome analysis of human plasma following in vivo lipopolysaccharide administration using 16o/18o labeling and the accurate mass and time tag approach. Mol Cell Proteomics. 2005 doi: 10.1074/mcp.M500045-MCP200. [DOI] [PMC free article] [PubMed] [Google Scholar]
- 35.Saffer JD, Burnett VL, Chen G, van der Spek P. Visual analytics in the pharmaceutical industry. IEEE Comput Graph Appl. 2004;24:10–15. doi: 10.1109/mcg.2004.40. [DOI] [PubMed] [Google Scholar]
- 36.Cheadle C, Vawter MP, Freed WJ, Becker KG. Analysis of microarray data using z score transformation. J Mol Diagn. 2003;5:73–81. doi: 10.1016/S1525-1578(10)60455-2. [DOI] [PMC free article] [PubMed] [Google Scholar]
- 37.Durr E, Yu J, Krasinska KM, Carver LA, Yates JR, Testa JE, Oh P, Schnitzer JE. Direct proteomic mapping of the lung microvascular endothelial cell surface in vivo and in cell culture. Nat Biotechnol. 2004;22:985–992. doi: 10.1038/nbt993. [DOI] [PubMed] [Google Scholar]
- 38.Jacobs JM, Mottaz HM, Yu LR, Anderson DJ, Moore RJ, Chen WN, Auberry KJ, Strittmatter EF, Monroe ME, Thrall BD, Camp DG, 2nd, Smith RD. Multidimensional proteome analysis of human mammary epithelial cells. J Proteome Res. 2004;3:68–75. doi: 10.1021/pr034062a. [DOI] [PubMed] [Google Scholar]
- 39.Qian W-J, Liu T, Monroe ME, Strittmatter EF, Jacobs JM, Kangas LJ, Petritis K, Camp DG, 2nd, Smith RD. Probability-based evaluation of peptide and protein identifications from tandem mass spectrometry and sequest analysis: The human proteome. J Proteome Res. 2004 doi: 10.1021/pr0498638. [DOI] [PubMed] [Google Scholar]
- 40.Strittmatter EF, Kangas LJ, Petritis K, Mottaz HM, Anderson GA, Shen Y, Jacobs JM, Camp DG, 2nd, Smith RD. Application of peptide lc retention time information in a discriminant function for peptide identification by tandem mass spectrometry. J Proteome Res. 2004;3:760–769. doi: 10.1021/pr049965y. [DOI] [PubMed] [Google Scholar]
- 41.Voorberg J, Fontijn R, van Mourik JA, Pannekoek H. Domains involved in multimer assembly of von willebrand factor (vwf): Multimerization is independent of dimerization. EMBO J. 1990;9:797–803. doi: 10.1002/j.1460-2075.1990.tb08176.x. [DOI] [PMC free article] [PubMed] [Google Scholar]
- 42.Garcia A, Prabhakar S, Brock CJ, Pearce AC, Dwek RA, Watson SP, Hebestreit HF, Zitzmann N. Extensive analysis of the human platelet proteome by two-dimensional gel electrophoresis and mass spectrometry. Proteomics. 2004;4:656–668. doi: 10.1002/pmic.200300665. [DOI] [PubMed] [Google Scholar]
- 43.O'Neill EE, Brock CJ, von Kriegsheim AF, Pearce AC, Dwek RA, Watson SP, Hebestreit HF. Towards complete analysis of the platelet proteome. Proteomics. 2002;2:288–305. doi: 10.1002/1615-9861(200203)2:3<288::aid-prot288>3.0.co;2-0. [DOI] [PubMed] [Google Scholar]
- 44.Petricoin EF, Ardenkani AA, Hitt BA, Levine PJ, Fusaro VA, Steinberg SM, Mills GB, Simone C, Fishman DA, Kohn EC, Liotta LA. Use of proteomic patterns in serum to identify ovarian cancer. The Lancet. 2002;359:572–577. doi: 10.1016/S0140-6736(02)07746-2. [DOI] [PubMed] [Google Scholar]
- 45.Wu SL, Jardine I, Hancock WS, Karger BL. A new and sensitive on-line liquid chromatography/mass spectrometric approach for top-down protein analysis: The comprehensive analysis of human growth hormone in an e. Coli lysate using a hybrid linear ion trap/fourier transform ion cyclotron resonance mass spectrometer. Rapid Commun Mass Spectrom. 2004;18:2201–2207. doi: 10.1002/rcm.1609. [DOI] [PubMed] [Google Scholar]
- 46.Olsen JV, Mann M. Improved peptide identification in proteomics by two consecutive stages of mass spectrometric fragmentation. Proc Natl Acad Sci U S A. 2004;101:13417–13422. doi: 10.1073/pnas.0405549101. [DOI] [PMC free article] [PubMed] [Google Scholar]
- 47.Wolters DA, Washburn MP, Yates JR., 3rd An automated multidimensional protein identification technology for shotgun proteomics. Anal Chem. 2001;73:5683–5690. doi: 10.1021/ac010617e. [DOI] [PubMed] [Google Scholar]
- 48.Olsen JV, Ong S-E, Mann M. Trypsin cleaves exclusively c-terminal to arginine and lysine residues. Mol Cell Proteomics. 2004 doi: 10.1074/mcp.T400003-MCP200. [DOI] [PubMed] [Google Scholar]
- 49.MacCoss MJ, Wu CC, Yates JR. Probability-based validation of protein identifications using a modified sequest algorithm. Anal Chem. 2002;74 doi: 10.1021/ac025826t. [DOI] [PubMed] [Google Scholar]
- 50.Keller A, Nesvizhskii AI, Kolker E, Aebersold R. Empirical statistical model to estimate the accuracy of peptide identifications made by ms/ms and database search. Anal Chem. 2002;74:5383–5392. doi: 10.1021/ac025747h. [DOI] [PubMed] [Google Scholar]
- 51.Lopez-Ferrer D, Martinez-Bartolome S, Villar M, Campillos M, Martin-Maroto F, Vazquez J. Statistical model for large-scale peptide identification in databases from tandem mass spectra using sequest. Anal Chem. 2004;ASAP 11-07-04 doi: 10.1021/ac049305c. [DOI] [PubMed] [Google Scholar]
- 52.Liu T, Qian WJ, Strittmatter EF, Camp DG, 2nd, Anderson GA, Thrall BD, Smith RD. High-throughput comparative proteome analysis using a quantitative cysteinyl-peptide enrichment technology. Anal Chem. 2004;76:5345–5353. doi: 10.1021/ac049485q. [DOI] [PubMed] [Google Scholar]
- 53.Hays WL. Statistics. Fifth Ed. Harcourt Brace College Publishers; Austin: 1994. [Google Scholar]