

Abstract
Background
Some patients with bipolar disorder (BD) demonstrate neuropsychological deficits even when stable. However, it remains unclear whether these differ qualitatively from those seen in schizophrenia (SZ).
Method
We compared the nature and severity of cognitive deficits shown by 106 patients with SZ and 66 patients with BD to 316 healthy adults (NC). All participants completed a cognitive battery with 19 individual measures. After adjusting their test performance for age, sex, race, education, and estimated premorbid IQ, we derived regression-based T-scores for each measure and the six cognitive domains.
Results
Both patient groups performed significantly worse than NCs on most (BD) or all (SZ) cognitive tests and domains. The resulting effect sizes ranged from 0.37 to 1.32 (mean = 0.97) across tests for SZ patients and from 0.23 to 0.87 (mean = 0.59) for BD patients. The Pearson correlation of these effect sizes was 0.71 (p < 0.001).
Conclusions
Patients with bipolar disorder suffer from cognitive deficits that are milder but qualitatively similar to those of patients with schizophrenia. These findings support the notion that schizophrenia and bipolar disorder show greater phenotypic similarity in terms of the nature than severity of their neuropsychological deficits.
Keywords: bipolar disorder, schizophrenia, cognitive testing, neuropsychology, biomarker
INTRODUCTION
Despite the historical and current nosological distinction between bipolar disorder (BD) and schizophrenia (SZ), there is emerging evidence that these conditions might share some genetic susceptibility (Craddock et al 2006; Potash 2006). Not only do BD and SZ share certain phenomenological characteristics, they also have similar ages of onset, sex distributions, and prevalence (Bramon and Sham 2001). Family studies suggest partial disease overlap, possibly related to the presence of psychosis, brain imaging studies reveal similarities (Pearlson et al 1997; Pearlson et al 1989), and molecular studies have identified genomic regions that might represent shared genetic susceptibility (Berrettini 2004). Indeed, Crow (1997) argued that schizophrenia does not reflect a natural category, and that we ought to conceptualize psychoses on a continuum. Conversely, Goldberg (1999) pointed out some obvious distinctions between SZ and BD, including differences in their clinical course, associated levels of functional impairment, and response to medications (Goldberg et al 1993; Gourovitch et al 1999).
One obstacle to elucidating susceptibility genes in BD and SZ is the difficulty defining heritable phenotypes (Leboyer et al 1998), as phenotypic misclassification reduces the power of linkage studies. Consequently, determining whether SZ and BD are characterized by similar or different neuropsychological profiles could be useful, especially if they are distinct enough to serve as illness markers (Glahn et al 2006; Glahn et al 2003).
Previous research has shown that individuals with SZ demonstrate impaired performance across a broad range of neuropsychological tests. Although no cognitive profile is recognized as a “signature” of SZ, patients typically demonstrate especially severe impairments of complex attention, psychomotor speed, new learning/memory, and abstraction or executive functioning (Bilder et al 2000; Bowie and Harvey 2005; Censits et al 1997; Flashman and Green 2004; Heinrichs 2005; Hill et al 2002). Milder impairments of these abilities have been found in SZ patients who appear cognitively normal (Kremen et al 2000). Yet while their presence and persistence are well-documented, the specificity of these cognitive deficits remains unclear.
Some patients with acute BD have cognitive deficits that can be as severe as those seen in SZ (Albus et al 1996; McGrath et al 1997; Verdoux and Liraud 2000). Even when stable, BD patients have been shown to demonstrate mild, selective impairments of verbal learning and memory and sustained attention (Dickerson et al 2001; Gourovitch et al 1999; Martinez-Aran et al 2004; Rubinsztein et al 2000; Seidman et al 2002; van Gorp et al 1999; Zubieta et al 2001). In a few studies, stable BD patients have shown impairments of psychomotor speed, card sorting, verbal fluency, and visual memory (Quraishi and Frangou 2002), but they rarely show impaired general intelligence, motor function, praxis, selective attention, or language.
Comparisons of cognitive functioning in SZ and BD have been reported (Daban et al 2006). Seidman et al (2002) compared 15 patients with BD, 87 with SZ, and 94 healthy controls (NC) using cognitive tests assigned to eight domains. The SZ patients performed significantly worse than NCs in all but one domain, with effect sizes (Cohen’s d) ranging from 0.26 to 1.68 (mean d = 1.09) across domains. The BD patients scored significantly lower than NCs in four domains, with effect sizes of -0.04 to 0.96 (mean d = 0.56). Dickerson et al (2004) compared 229 patients with SZ, 117 with BD, and 100 NCs using the Repeatable Battery for the Assessment of Neuropsychological Status (RBANS; Randolph 1998). Patients with SZ performed significantly worse than NCs on every RBANS subscale, with effect sizes of 0.61 to 1.27 (mean d = 1.09). Patients with BD scored significantly lower than NCs on the RBANS total score and four of five subscales, with effect sizes ranging from 0.12 to 0.79 (mean d = 0.52).
Both Seidman et al (2002) and Dickerson et al (2004) observed that the cognitive profiles produced by their SZ and BD groups were qualitatively similar, but neither measured the degree of similarity. When we correlated cognitive domain effect sizes shown by patients with SZ and BD in Seidman et al’s study, the Pearson r was 0.81 (p = 0.015). When we correlated the effect sizes shown by SZ and BD patients on the RBANS in Dickerson et al (2004), the Pearson r was 0.93 (p < 0.007). These findings suggest that the cognitive deficits in SZ and BD differ in severity but are qualitatively similar. However, because neither group of investigators adjusted their effect size estimates for demographic differences between patient and control groups, estimates of their correlation could be grossly inaccurate.
The present study aimed to compare the nature and severity of cognitive deficits shown by adults with schizophrenia or bipolar I disorder relative to healthy adults. Because our groups differed demographically, we used multiple regression to derive demographically-adjusted T-scores for all 19 test variables. The latter were then assigned to one of six cognitive domains. These demographically-adjusted test and domain scores were used to assess the similarity of neuropsychological profiles produced by patients with SZ or BD. We reasoned that, if their cognitive deficits differ in both nature and severity, then their cognitive deficit effect sizes should be uncorrelated. This would support the goal of elucidating cognitive illness markers that distinguish SZ from BD. If their cognitive profiles differ in severity but are qualitatively similar, then the correlation of their effect sizes should correlate highly. This would decrease the likelihood of elucidating distinct cognitive illness markers. A correlation of intermediate magnitude would suggest that the cognitive profiles of patients with SZ and BD differ substantially but perhaps not enough to serve as useful illness markers.
METHOD
Participants
Altogether, 172 patients were recruited for one of four studies of cognitive functioning in BD or SZ. Most were recruited from outpatient clinics, inpatient services, or a psychiatric day hospital affiliated with the Johns Hopkins University and Hospital, although 49 were recruited via flyers or newspaper/radio advertising. The patient samples included 106 adults with schizophrenia (not schizoaffective or schizophreniform disorder) and 66 adults with bipolar I disorder. Most (75%) of the BD patients reported a history of psychotic symptoms (i.e., hallucinations or delusions) when acutely manic or depressed. Patients were diagnosed according to criteria of the Diagnostic and Statistical Manual of Mental Disorders–Fourth Edition (DSM-IV; American Psychiatric Association 1994). In order to minimize the effects of illness acuity on both clinician ratings and cognitive test performance, most patients were recruited and tested as outpatients. However, 3 patients with BD and 11 with SZ were tested immediately prior to discharge from the hospital, when their attending physicians determined that they were stable. Potential BD and SZ study participants were excluded from the analysis if they had any history of mental retardation, dementia, stroke, traumatic brain injury with more than 1 hr loss of consciousness, or any type of substance dependence within the preceding 12 months.
In addition, 394 adults (NC) were recruited from the Baltimore, Maryland and Hartford, Connecticut metropolitan areas via random digit dialing or calling randomly selected listings from residential telephone directories for participation in the Aging, Brain Imaging, and Cognition (ABC) study. Excluded from the ABC sample were 78 participants who had a history of substance dependence within the preceding 12 months or any history of dementia, stroke, mental retardation, traumatic brain injury with greater than 1 hr loss of consciousness, other medical or neurological conditions commonly associated with cognitive impairment (e.g., multiple sclerosis, Parkinson’s disease), schizophrenia, bipolar disorder, or current major depression, or who scored below 24/30 on the Mini-Mental State Exam (MMSE; Folstein et al 1975). This left a final sample of 316 healthy participants. The Johns Hopkins Medicine Institutional Review Board approved all the studies from which subjects were drawn, and each person gave written informed consent to participate.
Procedures
Clinical diagnoses of patients were based on the Diagnostic Interview for Genetic Studies (DIGS; Nurnberger et al 1994), Structured Clinical Interview for DSM-IV Axis I Disorders-Clinician Version (SCID-CV; First et al 1997), or Mini International Neuropsychiatric Interview (MINI; Sheehan et al 1998), which were administered by a board-certified psychiatrist or licensed clinical psychologist. Current symptom severity also was rated by the clinician based on the Scales for the Assessment of Positive and Negative Symptoms (SAPS and SANS, respectively) (Andreasen and Olsen 1982) for most patients. Prior to making a diagnosis, the study clinician reviewed all available psychiatric records. Healthy controls also underwent a diagnostic and clinical assessment by a study psychiatrist or psychologist. This included a structured psychiatric interview, the Schedule for Clinical Assessment in Neuropsychiatry (SCAN; Wing 1996), review of medical history, and physical and neurological examinations.
The neuropsychological assessment of all participants consisted of nine tests that assessed a broad spectrum of cognitive abilities and required about two hours to administer. The tests yielded 19 measures. Each measure was assigned to one of six cognitive domains following Heinrichs & Zakzanis (1998) and others (Seidman et al 2002; Zubieta et al 2001). Four of our individual tests also are included in the Measurement and Treatment Research to Improve Cognition in Schizophrenia (MATRICS) cognitive test battery (Nuechterlein and Green 2006). The individual tests, specific variables drawn from each, and internal consistency (coefficients alpha) for the cognitive domains to which variables were assigned are shown in Table 1.
Table 1.
Neuropsychological test variables together with the cognitive domains they comprise and Cronbach’s alpha for each domain
| Cognitive
domain |
Neuropsychological tests and measures used | Cronbach’s
alpha |
|---|---|---|
| Psychomotor speed | Grooved Pegboard (GPT); times for each hand (Klove 1963) Trail Making (TMT); times for parts A and B (Reitan 1958) | .833 |
| Attention | Brief Test of Attention (BTA); total correct (Schretlen 1997) Conners’ Continuous Performance Test (CPT); hit RT, hit RT standard error, and d’ (Conners 1995) | .703 |
| Executive | Nelson modified Wisconsin Card Sorting Test (mWCST; categories completed, perseverative errors) (Nelson 1976) | .829 |
| Fluency | Letter Word Fluency (letters S & P); Category Word Fluency (animals, supermarket items); Design Fluency (novel drawings) (Kingery et al in press) | .693 |
| Verbal memory | Hopkins Verbal Learning Test-Revised (HVLT-R); words recalled on trials 1-3, delayed recall, delayed recognition discrimination (Brandt and Benedict 2001) | .824 |
| Visual memory | Brief Visuospatial Memory Test-Revised (BVMT-R); designs recalled on trials 1-3, delayed recall, delayed recognition discrimination) (Benedict 1997) | .817 |
Data analysis began with the derivation of demographically-adjusted T-scores for all study participants. The general procedure for these adjustments has been described elsewhere (Heaton et al 2004; Ivnik et al 1992). Briefly, we first converted the NC group’s raw scores on all 19 cognitive measures to scaled scores (M=10; SD=3) using the cumulative frequency distribution of each measure. We then regressed these scaled scores on age, age-squared, sex, race (white vs. black), years of education, and estimated premorbid IQ based on the revised National Adult Reading Test (NART-R; Blair and Spreen 1989). For these analyses we entered the predictor variables en bloc, saved the standardized residuals, and converted the latter to T-scores (M = 50; SD = 10). We next converted the BD and SZ patients’ raw test scores to scaled scores based on the NC distributions, and applied the multiple regression equations derived from the NC data to compute demographically-predicted scores for the patients. These predicted scores were subtracted from each patient’s actual scaled scores, and the differences were divided by the standard deviation of the NC group’s residuals for each measure. Finally, the resulting values were converted to T-scores for direct comparison with those produced by healthy controls. An advantage of these procedures is that they allow for the direct comparison of cognitive test performances produced by patient groups that differ from each other and from the healthy controls on any demographic characteristic. The reason is that the demographically-adjusted T-score distribution approximates a mean of 50 and standard deviation of 10 for every cognitive test in any NC subgroup selected on the basis of age, sex, race, years of education, or estimated premorbid IQ.1
Hypothesized differences between patients and healthy controls were tested using two multivariate analyses of variance (MANOVAs) in which diagnostic group (NC vs. SZ vs. BD) served as the between-groups factor. In one MANOVA, demographically-adjusted T-scores for all 19 cognitive measures served as the dependent variables. In the other, the six cognitive domain scores, defined by the mean of the demographically-adjusted T-scores that comprised each, served as the dependent variables. Planned contrasts compared each patient group to the healthy controls, and post hoc comparisons with Bonferroni corrections were used to compare differences between the two patient groups on the individual tests and six cognitive domains. Finally, we computed Cohen’s d effect sizes (Cohen 1988) of the differences between each patient group’s mean scores (across cognitive domains and individual tests) compared to healthy controls, and correlated these in order to assess the similarity of their cognitive profiles. If SZ and BD are characterized by qualitatively distinct cognitive deficits, we reasoned that their effect sizes would be uncorrelated, as shown by small Pearson rs. Conversely, if SZ and BD involve cognitive deficits that differ in severity but are qualitatively similar, then correlation of their effect sizes should yield large rs. Finally, if SZ and BD patients suffer from both common and distinct cognitive deficits, then their effect sizes should be characterized by correlations of intermediate magnitude.
RESULTS
As shown in Table 2, MANOVA and chi-square analyses revealed that the three groups differed significantly in age, years of education, and NART-R estimated premorbid IQ. Based on planned comparisons, both patient groups were significantly younger than healthy controls. The SZ, but not BD, patients also completed fewer years of schooling and produced lower estimates of premorbid IQ than healthy controls. Bonferroni-adjusted post hoc comparisons revealed that BD patients completed significantly more years of schooling and produced higher premorbid IQ estimates than SZ patients, but that the two groups did not differ in age. Chi-square analyses revealed significant associations between diagnostic group and both sex and race, with one exception: the BD and NC groups did not differ in sex.
Table 2.
Demographic characteristics1 of the patient and healthy control groups
| Characteristic | NC
(n = 316) |
SZ
(n = 106) |
BD
(n = 66) |
Statistic | p < |
|---|---|---|---|---|---|
| Age (years) | 54.5 ±18.6a | 40.0 ±11.1b | 41.5 ±11.5b | F(2,483) = 39.6 | 0.001 |
| Sex (male:female %) | 44:56a | 69:31b | 38:62a | 0.001 | |
| Race (w:b:o %) | 81:17:2a | 40:55:6b | 67:29:5c | 0.001 | |
| Education (years) | 14.3 ±3.0a | 12.0 ±2.4b | 14.8 ±3.0a | F(2,483) = 27.6 | 0.001 |
| Est. premorbid IQ | 105.2 ±10.1a | 96.5 ±10.5b | 103.7 ±10.9a | F(2,483) = 28.3 | 0.001 |
| Age at onset (years) | – | 22.9 ±7.5 | 24.9 ±9.0 | t(98.5) = -1.5 | 0.163 |
| Illness duration (years) | – | 17.1 ±10.5 | 16.3 ±11.1 | t(143) = 0.5 | 0.647 |
| # Hospitalizations | – | 5.4 ±6.5 | 4.2 ±4.4 | t(143) = 1.2 | 0.244 |
| SANS (sum) | – | 10.0 ±6.4 | 2.5 ±2.9 | t(83.6) = 7.8 | 0.001 |
| SAPS (sum) | – | 5.1 ±4.1 | 1.8 ±2.6 | t(90.6) =4.3 | 0.001 |
| Typical antipsychotic (%) | – | 34 | 4 | 0.001 | |
| Atypical antipsychotic (%) | – | 75 | 47 | 0.001 | |
| Any antidepressant (%) | – | 23 | 48 | 0.001 | |
| Lithium (%) | – | 4 | 50 | 0.001 | |
| Any anticonvulsant (%) | – | 13 | 42 | 0.001 |
Note: For three-group analyses, different subscripts denote significant (p < .05) differences. SZ = schizophrenia; BD = bipolar disorder; NC = normal control. Estimated premorbid IQ based on the NART-R (Blair and Spreen 1989).
Shown as mean ±standard deviation unless otherwise indicated.
2For race, w = white, b = black, o = “other.”
As also shown in Table 2, independent sample t-tests and chi-square analyses revealed that the SZ and BD patients did not differ significantly in age at illness onset, number of prior psychiatric hospital admissions, or illness duration. The SZ patients manifested more severe negative (SANS) and positive (SAPS) symptoms than BD patients, and the groups differed significantly in the proportions being treated with five classes of psychotropic medication. More SZ than BD patients were receiving typical and atypical antipsychotic medications. More BD than SZ patients were receiving lithium, antidepressants, and anticonvulsants.
Multivariate analyses of variance revealed significant overall differences among the three groups for the demographically-adjusted individual test (Wilks’λ = 0.525; F(38,934) = 9.23; p < 0.0001; partial η2 = 0.275) and cognitive domain (Wilks’λ = 0.572; F(12,960) = 25.76; p < 0.0001; partial η2 = 0.244) scores. As shown in Table 3, planned contrasts confirmed that the SZ group performed significantly (p <0.001) worse than NCs on every cognitive measure and in every cognitive domain. The BD group performed significantly (p < 0.01) worse than NCs on every cognitive domain and on all but one (Conners’ CPT hit reaction time; p = 0.068) of the individual cognitive test scores. Bonferroni-adjusted post hoc comparisons showed that SZ patients performed significantly (p < 0.05) worse than BD patients on 11 of the 19 individual tests and 5 of the 6 cognitive domains. The BD patients did not perform worse than SZ patients on any measure, but they performed as poorly as SZ patients on tests of attention (BTA, CPT), word and design fluency (VFT, DFT) and recognition discrimination (HVLT-R, BVMT-R).
Table 3.
Means (±standard deviations) of raw neuropsychological test scores and demographically-adjusted T-score means for the six cognitive domains by group, with univariate F statistics1
| Domain/Variable | NC | SZ | BD | F(df) | p < |
|---|---|---|---|---|---|
| Psychomotor speed | 50.0 ±7.5a | 36.5 ±8.2b | 41.7 ±9.8c | F(2,485) = 122.7 | 0.0001 |
| GPT dominant hand | 80.4 ±27.6a | 89.9 ±23.1b | 80.3 ±24.5c | F(2,485) = 74.8 | 0.0001 |
| GPT non-dom. hand | 90.0 ±32.6a | 102.1 ±29.6b | 93.2 ±34.0c | F(2,485) = 68.6 | 0.0001 |
| Trail Making, Part A | 34.2 ±16.2a | 47.0 ±20.2b | 37.1 ±18.3c | F(2,485) = 62.1 | 0.0001 |
| Trail Making, Part B | 89.6 ±56.9a | 146.1 ±91.7b | 104.3 ±72.7c | F(2,485) = 77.0 | 0.0001 |
| Attention | 50.4 ±7.4a | 40.6 ±9.0b | 43.1 ±9.1b | F(2,485) = 68.2 | 0.0001 |
| BTA total | 15.5 ±3.7a | 11.9 ±4.0b | 14.0 ±4.0b | F(2,485) = 61.5 | 0.0001 |
| CPT hit RT | 428.8 ±68.0a | 439.6 ±82.9b | 442.2 ±89.5b | F(2,485) = 6.2 | 0.003 |
| CPT hit RTSE | 6.6 ±2.8a | 9.3 ±4.4b | 10.2 ±10.6b | F(2,485) = 27.1 | 0.0001 |
| CPT d’ | 3.2 ±1.1a | 2.6 ±1.1b | 3.0 ±1.1b | F(2,485) = 37.3 | 0.0001 |
| Executive function | 50.0 ±9.0a | 40.1 ±12.7b | 45.3 ±11.0c | F(2,485) = 38.7 | 0.0001 |
| mWCST categories | 5.4 ±1.2a | 3.9 ±1.9b | 5.0 ±1.7c | F(2,485) = 40.6 | 0.0001 |
| mWCST persev. | 2.4 ±3.8a | 6.6 ±7.1b | 2.6 ±3.0c | F(2,485) = 25.0 | 0.0001 |
| Fluency | 50.0 ±7.6a | 40.6 ±9.0b | 44.0 ±8.2c | F(2,485) = 61.3 | 0.0001 |
| Letters S & P | 28.5 ±9.1a | 21.9 ±9.4b | 26.3 ±7.8b | F(2,485) = 18.6 | 0.0001 |
| Categories | 45.1 ±11.4a | 34.4 ±10.5b | 42.3 ±11.7c | F(2,485) = 39.2 | 0.0001 |
| Designs | 14.4 ±7.1a | 8.3 ±4.7b | 11.3 ±6.1b | F(2,485) = 47.5 | 0.0001 |
| Verbal memory | 50.0 ±8.2a | 38.9 ±9.1b | 44.7 ±10.9c | F(2,485) = 65.7 | 0.0001 |
| HVLT-R trials 1-3 | 24.7 ±4.7a | 18.7 ±4.9b | 23.8 ±6.1c | F(2,485) = 61.1 | 0.0001 |
| HVLT-R delay | 8.8 ±2.6a | 5.7 ±2.6b | 7.8 ±3.2c | F(2,485) = 66.5 | 0.0001 |
| HVLT-R recognition | 10.4 ±1.6a | 9.1 ±2.2b | 10.0 ±2.1b | F(2,485) = 21.2 | 0.0001 |
| Visual memory | 50.0 ±8.2a | 39.5 ±11.4b | 43.9 ±10.4c | F(2,485) = 55.2 | 0.0001 |
| BVMT-R trials 1-3 | 22.6 ±7.2a | 17.3 ±7.4b | 22.0 ±6.7c | F(2,485) = 56.5 | 0.0001 |
| BVMT-R delay | 8.8 ±2.6a | 6.8 ±3.0b | 8.3 ±2.7c | F(2,485) = 55.1 | 0.0001 |
| BVMT-R recognition | 5.6 ±0.7a | 5.3 ±1.1b | 5.4 ±0.9b | F(2,485) = 15.0 | 0.0001 |
Note: See Table 1 for descriptions of neuropsychological test measures that comprised each cognitive domain. NC = healthy control, SZ = schizophrenia, BD = bipolar disorder. Bonferroni-corrected post hoc comparisons were used to evaluate pairwise group differences (denoted by subscripts).
Note that demographically-adjusted scores for both individual test and mean domain scores were used for all MANOVAs.
We next computed Cohen’s (1988) d effect size estimates of the performance difference between each patient group and the healthy controls for the 19 cognitive test variables and six domain scores. This involved subtracting the mean score for each measure/domain from the NC group’s mean score on the same measure/domain, and dividing the difference by the pooled standard deviations (Rosnow and Rosenthal 1996), separately for each patient group. For SZ patients, the resulting effect sizes ranged from d = 0.37 to 1.32 (M = 0.97; SD = 0.30) across the 19 individual measures and from 0.91 to 1.71 (M = 1.22; SD = 0.27) across the 6 cognitive domains. For BD patients, the effect sizes ranged from d = 0.23 to 0.87 (M = 0.59; SD = 0.18) across the 19 individual test scores and from 0.47 to 0.96 (M = 0.71; SD = 0.19) across the 6 cognitive domains.
Finally, in order to compare the patterns of cognitive deficits shown by SZ and BD patients, we conducted two analyses. The first of these was a profile analysis (Stevens 2002) in which we compared the mean cognitive domain demographically-adjusted T-scores produced by the two patient groups. We used this approach to compare differences in mean scores for adjacent (or successive) domains shown by each patient group. For example, the difference between executive functioning and verbal memory shown by patients with SZ was compared to the same difference shown by patients with BD. The overall MANOVA yielded a non-significant effect (F(5, 166) = 1.96; p = 0.087) of diagnosis on the “slopes” of cognitive profiles, indicating that the cognitive profiles shown by SZ and BD patients did not differ significantly in form. Conversely, the effect of diagnosis on overall “elevation” of the profiles was highly significant (F(1, 170) = 14.67; p < 0.0001), replicating the earlier finding that patients with SZ and BD showed markedly different degrees of cognitive impairment. In order to further compare the cognitive functioning of SZ and BD groups, we also correlated their effect sizes. The Pearson r of the effect sizes produced by each group on the 19 individual test scores was 0.71 (p < 0.001). The Pearson r of the two groups’ cognitive domain effect sizes was nearly identical (r = 0.72; p = 0.105), but fell short of statistical significance because it was based on 6 rather than 19 pairs of effect sizes. In any case, squaring these correlations suggests that just over 50% of the variance in the pattern of neuropsychological deficits produced by SZ and BD patients is shared, despite differences in the overall severity of their deficits. While these correlations are lower than those obtained by Seidman et al (2002) and Dickerson et al (2004), the qualitative similarity of demographically-adjusted individual test and cognitive domain scores produced by our SZ and BD patient groups can be discerned in Figures 1 and 2.
Figure 1. Mean effect sizes for six cognitive domains based on demographically-adjusted T-scores produced by patients with schizophrenia (SZ) and bipolar I disorder (BD) compared to healthy adults.
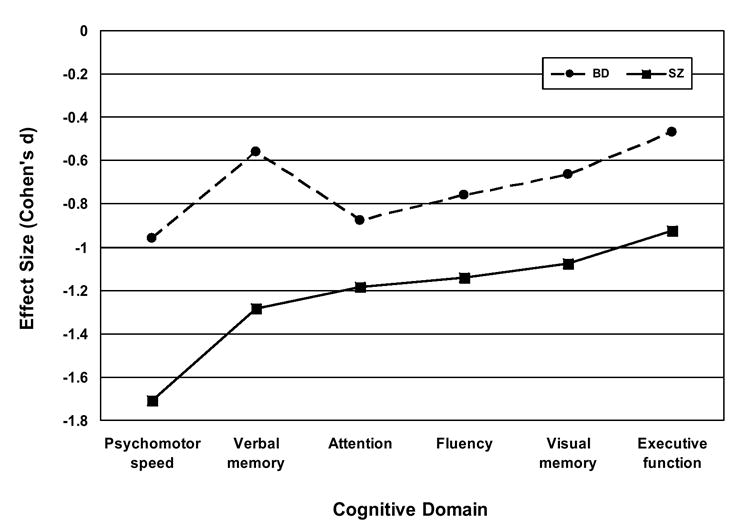
MANOVA planned contrasts confirmed that each patient group differed significantly from healthy controls on every cognitive domain (p < 0.01). Bonferroni-corrected post hoc comparisons showed the SZ and BD groups differed significantly (p < 0.5) on all domains except Divided and sustained attention.
Figure 2. Effect sizes for 19 individual test scores based on demographically-adjusted T-scores produced by patients with schizophrenia (SZ) and bipolar I disorder (BD) compared to healthy adults.
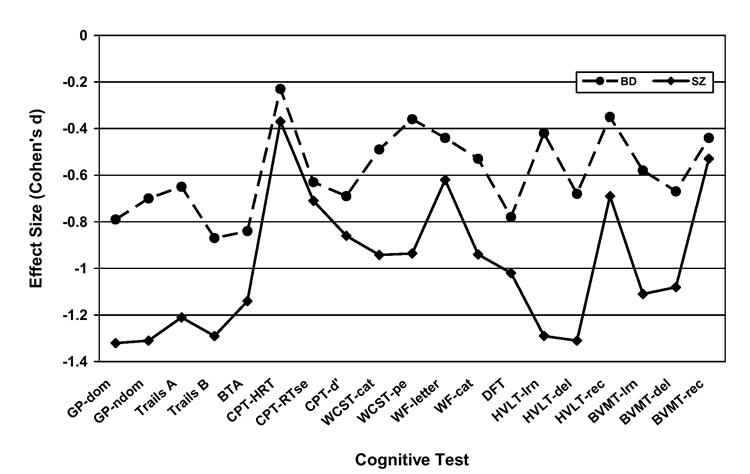
MANOVA planned contrasts confirmed that each patient group performed significantly (p < 0.01) worse than healthy adults on every measure except CPT Hit RT, on which the BD group did not differ significantly from healthy controls. Bonferroni-corrected post hoc comparisons showed the SZ and BD patient groups differed significantly (p < 0.05) on 11 of 19 measures. Note: GP-dom and GP-ndom = Grooved Pegboard dominant and non-dominant hands; Trails = Trail Making Test; BTA = Brief Test of Attention; CPT-HRT, CPT-RTse, and CPT-d’ = Continuous Performance Test hit reaction time, hit RT standard error, and discrimination; WCST-cat and WCST-pe = Wisconsin Card Sorting Test categories and perseverative errors; WF-letter and WF-cat = Word Fluency letters (S & P) and categories (animals & supermarket items); DFT = Design Fluency Test; HVLT-lrn, HVLT-del, HVLT-rec and BVMT-lrn, BVMT-del, BVMT-rec = Hopkins Verbal Learning Test and Brief Visuospatial Memory test learning, delayed recall, and recognition discrimination, respectively.
DISCUSSION
Three major findings emerged from this study. First, compared to healthy adults, patients with schizophrenia showed severe, pervasive cognitive impairments. Second, while our relatively stable patients with BD also demonstrated impairment on most cognitive measures, their deficits were significantly milder than those of patients with SZ on 11 of 19 individual measures and in 5 of 6 cognitive domains. Third, the cognitive deficit effect sizes shown by SZ and BD patient groups correlated quite highly, indicating that the two groups exhibited qualitatively similar patterns of cognitive impairment despite differences in the overall severity of their deficits.
The finding that patients with schizophrenia showed severe, pervasive cognitive deficits is consistent with many previous studies. Based on a meta-analysis of 204 studies that included 7,420 schizophrenic patients and 5,865 healthy controls, Heinrichs and Zakzanis (1998) found that the mean weighted effect sizes for 22 cognitive test variables ranged from 0.46 to 1.41, with a mean of 0.89. In the present study, based on demographically-adjusted scores, we found that the effect sizes for 19 cognitive test variables ranged from 0.37 to 1.32, with a mean of 0.97. When these variables were assigned to six cognitive domains that are conceptually similar to several described by Heinrichs and Zakzanis (1998) and Seidman et al (2002), and which include several measures that comprise the MATRICS battery (Nuechterlein and Green 2006), the effect sizes were larger, ranging from 0.91 to 1.71, with a mean of 1.22. Notably, the two largest effects found by Heinrichs and Zakzanis involved measures of verbal memory and psychomotor speed, which is precisely what we found. Likewise, Seidman et al (2002) found that SZ patients showed their greatest impairment in domains that the investigators called perceptual-motor speed, abstraction/executive functioning, and verbal declarative memory. Two of these correspond most closely to the domains (psychomotor speed, verbal learning/memory) in which our SZ patients also demonstrated maximal impairment. Finally, our findings also are quite consistent with those of Dickerson et al (2004), who found that SZ patients were most impaired relative to NCs on measures that constitute the RBANS Attention and Immediate and Delayed Memory subtests. Notably, the RBANS Attention subtest includes a measure (Coding) that we, Heinrichs and Zakzanis (1998), and Seidman et al (2002) all refer to as perceptual-motor or psychomotor speed. Thus, the range and mean of the observed effect sizes, as well as the specific cognitive domains that comprised the largest of them in this study, were strikingly similar to those found in previous comparisons of schizophrenic patients and healthy adults.
Also consistent with previous research, our patients with bipolar disorder showed milder and more selective cognitive deficits than those with schizophrenia. Effect sizes ranged from 0.23 to 0.87, with a mean of 0.59 across all 19 cognitive measures when we compared bipolar patients to healthy controls. Based on their review of 42 studies, Quraishi and Frangou (2002) concluded that even BD patients who are described as remitted frequently show mild residual cognitive deficits, most frequently of sustained attention and verbal memory. As depicted in Figures 1 and 2, these were among the largest differences between BD patients and NCs found in the present study. Indeed, after adjusting for differences in demographic background and estimated premorbid IQ, patients with bipolar disorder demonstrated impairments of sustained and divided attention that were proportionately as severe as those shown by patients with schizophrenia. Similarly, Seidman et al (2002) and Dickerson et al (2004) also reported finding moderately large effect sizes for deficits in attention and verbal learning/memory among their BD patients relative to healthy adults. Also consistent with their reports, the BD patients in our study outperformed SZ patients in every cognitive domain. These differences reached statistical significance for every domain except attention. In sum, these findings support three inferences: First, relatively stable patients with bipolar disorder demonstrate cognitive impairments. Second, their deficits are milder and more selective than those seen in schizophrenia. Third, after adjusting for demographic differences, their impairments of sustained and divided attention appear to be as severe as those shown by patients with schizophrenia.
Perhaps most importantly, in this study, patients with schizophrenia and bipolar disorder produced neuropsychological profiles that differed in severity but were qualitatively similar. As shown in Figures 1 and 2, their neuropsychological profiles are not identical, but correlation of the effect sizes shown by BD and SZ patients yielded a Pearson r of 0.71 for the 19 individual tests and 0.72 for the six cognitive domains. Squaring these values suggests that roughly 50% of the variance in cognitive profiles is shared between patient groups. While the correlations that we found are smaller than those obtained by Seidman et al (r = 0.81) and Dickerson et al (r = 0.93), these investigators did not adjust the cognitive test performance effect sizes for group differences in demographic background or estimated premorbid IQ. Since age, education, sex, race, and estimated premorbid IQ all affect cognitive abilities to varying degrees, differences between SZ and BD patients in these respects are likely to weaken rather than strengthen the correlation between their neuropsychological profiles. In any case, consistent with the reports of Seidman et al (2002) and Dickerson et al (2004), the present findings suggest that SZ and BD share greater phenotypic similarity in terms of the pattern than severity of their neurocognitive deficits. While this does not eliminate the possibility of identifying neuropsychological patterns that reliably distinguish between SZ and BD, the qualitative similarity of their cognitive deficits suggests that measures of other biological characteristics, such as electrophysiological or neuroanatomic abnormalities, might be more likely to yield useful biological illness markers.
For the present study we treated both schizophrenia and bipolar disorder as unitary entities. Some researchers argue for separating patients with psychotic BD from those without psychosis, based on differences in genetics and brain abnormalities (Glahn et al 2006; Pearlson et al 1995; Potash 2006), and stress the similarity of psychotic BD and SZ. We currently are gathering data on a larger sample of patients with BD, and we aim to construct psychotic and non-psychotic subgroups of sufficient size to support such analyses. Likewise, although we grouped patients with SZ according to whether or not they manifested the deficit syndrome (Carpenter and Kirkpatrick 1988), comparison of the cognitive functioning of these subgroups will be presented in a subsequent article.
One weakness of this study is that measures of current affective symptoms were not administered. Consequently, although 63 of the 66 patients with BD were assessed as outpatients, and all of the patients were relatively stable, we do not know how many were euthymic at testing. However, the bipolar patients showed fewer negative and positive symptoms than schizophrenic patients. In addition, roughly equal proportions of both groups were assessed while inpatients. This reduces the likelihood that differences in the severity of their cognitive deficits are attributable to differences in illness acuity between the two groups. Another potential weakness of this study involves the possibility that misdiagnosis contributed to the qualitative similarity of cognitive profiles shown by our BD and SZ groups. While we cannot exclude this possibility, the systematic differences in the overall severity of cognitive deficits shown by BD and SZ patients argues against this, as does the fact that other investigators have found even greater qualitative similarities between these patient groups.
An important and novel strength of this study involves the use of regression-based adjustments for demographic characteristics and estimated premorbid IQ. This approach standardizes the difference between an individual’s actual obtained test scores and those predicted on the basis of his or her demographic characteristics and estimated premorbid IQ. Regression-based demographic adjustments of test scores (Heaton et al 2004) obviate the need to match patient and control groups on demographic variables because their influence is statistically “removed” from each individual’s test scores. The effectiveness of this approach is demonstrated by the fact that non-overlapping subgroups of healthy controls (e.g., those with ≤ 12 vs. >12 years of education) did not differ significantly on a single t-test in 95 statistical comparisons (see footnote above). In fact, the adjusted T-scores of every NC subgroup approximated a mean of 50 and standard deviation of 10. When applied to patient groups, this approach improves diagnostic classification by increasing the sensitivity, without decreasing the specificity, of neuropsychological measures (Testa and Schretlen 2006). In effect, the cognitive deficits and corresponding effect sizes shown by SZ and BD patients in this study reflect impairments that are unrelated to group differences in age, sex, race, education, and estimated premorbid IQ. Meehl (1970) noted that matching patients with schizophrenia and healthy controls might “correct” out genuine illness-related variance. The same could be said of including a term for education in regression formulas used to residualize test performance for demographic characteristics and estimated premorbid IQ. However, when all predictors are entered into the regression models, education accounted for very little incremental variance (as shown by its relatively small beta weight) in any test score. In addition, the cognitive test effect sizes obtained in this study were remarkably similar to those reported for comparable measures in previous research. This suggests that including a term for education did not greatly reduce group differences in cognitive test performance, which is the principal risk of “over-correcting” scores. In any case, this is the first study to compare the cognitive impairments shown by patients with BD and SZ using regression-based demographic adjustment as far as we know.
Qualitative similarities between the neuropsychological profiles produced by our patients with schizophrenia and bipolar disorder are consistent with the view that these disorders might represent a “continuum of psychosis” (Crow 1997) or share some genetic biological overlap (Berrettini 2004). They support continuing research on the traditional distinction between SZ and BD. For example, pooling patients without regard to diagnosis, and then defining clusters by clinical symptoms, neurocognitive functioning, and other putative biomarkers might prove useful for linkage and gene expression analyses of homogeneous subgroups that cross diagnostic boundaries.
Acknowledgments
The research was supported by the NIH (MH60504 & MH43775 to GDP and DJS), NARSAD (to NGC, VAR and DJS), and Stanley Foundation (to NGC).
Dr. Schretlen receives royalties for the Brief Test of Attention. None of the other authors has a conflict of interest related to the research reported in this article.
Footnotes
To verify this, we divided the NC sample into five pairs of subgroups based on median splits for age, education, and estimated premorbid IQ, and by sex (male vs. female) and race (white vs. black). We then compared the demographically-adjusted T-scores produced by each subgroup. All 190 means (19 tests X 5 demographic characteristics X 2 subgroups for each characteristic) ranged from 48.0 to 50.7, and none of the 95 Student t-tests reached statistical significance (p <0.05). Indeed, all but one of the obtained p values exceeded 0.12.
Publisher's Disclaimer: This is a PDF file of an unedited manuscript that has been accepted for publication. As a service to our customers we are providing this early version of the manuscript. The manuscript will undergo copyediting, typesetting, and review of the resulting proof before it is published in its final citable form. Please note that during the production process errors may be discovered which could affect the content, and all legal disclaimers that apply to the journal pertain.
References
- Albus M, Hubmann W, Wahlheim C, Sobizack N, Franz U, Mohr F. Contrasts in neuropsychological test profile between patients with first-episode schizophrenia and first-episode affective disorders. Acta Psychiatr Scand. 1996;94:87–93. doi: 10.1111/j.1600-0447.1996.tb09830.x. [DOI] [PubMed] [Google Scholar]
- American Psychiatric Association. Diagnostic and statistical manual of mental disorders : DSM-IV. 4. Washington, DC: American Psychiatric Association; 1994. [Google Scholar]
- Andreasen NC, Olsen S. Negative v positive schizophrenia. Definition and validation. Arch Gen Psychiatry. 1982;39:789–794. doi: 10.1001/archpsyc.1982.04290070025006. [DOI] [PubMed] [Google Scholar]
- Berrettini W. Bipolar disorder and schizophrenia: convergent molecular data. Neuromolecular Medicine. 2004;5:109–117. doi: 10.1385/NMM:5:1:109. [DOI] [PubMed] [Google Scholar]
- Bilder RM, Goldman RS, Robinson D, Reiter G, Bell L, Bates JA, et al. Neuropsychology of first-episode schizophrenia: initial characterization and clinical correlates. Am J Psychiatry. 2000;157:549–559. doi: 10.1176/appi.ajp.157.4.549. [DOI] [PubMed] [Google Scholar]
- Blair JR, Spreen O. Predicting premorbid IQ: A revision of the National Adult Reading Test. Clinical Neuropsychologist. 1989;3:129–136. [Google Scholar]
- Bowie CR, Harvey PD. Cognition in schizophrenia: impairments, determinants, and functional importance. Psychiatr Clin North Am. 2005;28:613–633. 626. doi: 10.1016/j.psc.2005.05.004. [DOI] [PubMed] [Google Scholar]
- Bramon E, Sham PC. The common genetic liability between schizophrenia and bipolar disorder: a review. Current Psychiatry Reports. 2001;3:332–337. doi: 10.1007/s11920-001-0030-1. [DOI] [PubMed] [Google Scholar]
- Carpenter WT, Jr, Kirkpatrick B. The heterogeneity of the long-term course of schizophrenia. Schizophr Bull. 1988;14:645–652. doi: 10.1093/schbul/14.4.645. [DOI] [PubMed] [Google Scholar]
- Censits DM, Ragland JD, Gur RC, Gur RE. Neuropsychological evidence supporting a neurodevelopmental model of schizophrenia: a longitudinal study. Schizophr Res. 1997;24:289–298. doi: 10.1016/s0920-9964(96)00091-6. [DOI] [PMC free article] [PubMed] [Google Scholar]
- Cohen J. Statistical power analysis for the behavioral sciences. 2. Hillsdale, NJ: Lawrence Earlbaum Associates; 1988. [Google Scholar]
- Craddock N, O’Donovan MC, Owen MJ. Genes for schizophrenia and bipolar disorder? Implications for psychiatric nosology. Schizophr Bull. 2006;32:9–16. doi: 10.1093/schbul/sbj033. [DOI] [PMC free article] [PubMed] [Google Scholar]
- Crow TJ. Is schizophrenia the price that Homo sapiens pays for language? Schizophr Res. 1997;28:127–141. doi: 10.1016/s0920-9964(97)00110-2. [DOI] [PubMed] [Google Scholar]
- Daban C, Martinez-Aran A, Torrent C, Tabares-Seisdedos R, Balanza-Martinez V, Salazar-Fraile J, et al. Specificity of cognitive deficits in bipolar disorder versus schizophrenia. A systematic review. Psychother Psychosom. 2006;75:72–84. doi: 10.1159/000090891. [DOI] [PubMed] [Google Scholar]
- Dickerson F, Boronow JJ, Stallings C, Origoni AE, Cole SK, Yolken RH. Cognitive functioning in schizophrenia and bipolar disorder: comparison of performance on the Repeatable Battery for the Assessment of Neuropsychological Status. Psychiatry Res. 2004;129:45–53. doi: 10.1016/j.psychres.2004.07.002. [DOI] [PubMed] [Google Scholar]
- Dickerson FB, Sommerville J, Origoni AE, Ringel NB, Parente F. Outpatients with schizophrenia and bipolar I disorder: Do they differ in their cognitive and social functioning? Psychiatry Res. 2001;102:21–27. doi: 10.1016/s0165-1781(01)00247-5. [DOI] [PubMed] [Google Scholar]
- First MB, Spitzer RL, Gibbon M, Williams JBW. Structured Clinical Interview for DSM-IV Axis I Disorders - Clinical Version (SCID-CV) Washington, DC: American Psychiatric Press; 1997. [Google Scholar]
- Flashman LA, Green MF. Review of cognition and brain structure in schizophrenia: profiles, longitudinal course, and effects of treatment. Psychiatr Clin North Am. 2004;27:1–18. vii. doi: 10.1016/S0193-953X(03)00105-9. [DOI] [PubMed] [Google Scholar]
- Folstein MF, Folstein SE, McHugh PR. “Mini-mental state”. A practical method for grading the cognitive state of patients for the clinician. J Psychiatr Res. 1975;12:189–198. doi: 10.1016/0022-3956(75)90026-6. [DOI] [PubMed] [Google Scholar]
- Glahn DC, Bearden CE, Cakir S, Barrett JA, Najt P, Serap Monkul E, et al. Differential working memory impairment in bipolar disorder and schizophrenia: effects of lifetime history of psychosis. Bipolar Disord. 2006;8:117–123. doi: 10.1111/j.1399-5618.2006.00296.x. [DOI] [PubMed] [Google Scholar]
- Glahn DC, Therman S, Manninen M, Huttunen M, Kaprio J, Lonnqvist J, Cannon TD. Spatial working memory as an endophenotype for schizophrenia. Biol Psychiatry. 2003;53:624–626. doi: 10.1016/s0006-3223(02)01641-4. [DOI] [PubMed] [Google Scholar]
- Goldberg TE. Some fairly obvious distinctions between schizophrenia and bipolar disorder. Schizophr Res. 1999;39:127–132. doi: 10.1016/s0920-9964(99)00111-5. discussion 161-122. [DOI] [PubMed] [Google Scholar]
- Goldberg TE, Gold JM, Greenberg R, Griffin S, Schulz SC, Pickar D, et al. Contrasts between patients with affective disorders and patients with schizophrenia on a neuropsychological test battery. Am J Psychiatry. 1993;150:1355–1362. doi: 10.1176/ajp.150.9.1355. [DOI] [PubMed] [Google Scholar]
- Gourovitch ML, Torrey EF, Gold JM, Randolph C, Weinberger DR, Goldberg TE. Neuropsychological performance of monozygotic twins discordant for bipolar disorder. Biological Psychiatry. 1999;45:639–646. doi: 10.1016/s0006-3223(98)00148-6. [DOI] [PubMed] [Google Scholar]
- Heaton RK, Miller SW, Taylor MJ, Grant I. Revised comprehensive norms for an expanded Halstead-Reitan Battery: Demographically adjusted neuropsychological norms for African American and Caucasian adults. Lutz, FL: Psychological Assessment Resources, Inc.; 2004. [Google Scholar]
- Heinrichs RW. The primacy of cognition in schizophrenia. Am Psychol. 2005;60:229–242. doi: 10.1037/0003-066X.60.3.229. [DOI] [PubMed] [Google Scholar]
- Heinrichs RW, Zakzanis KK. Neurocognitive deficit in schizophrenia: a quantitative review of the evidence. Neuropsychology. 1998;12:426–445. doi: 10.1037//0894-4105.12.3.426. [DOI] [PubMed] [Google Scholar]
- Hill SK, Ragland JD, Gur RC, Gur RE. Neuropsychological profiles delineate distinct profiles of schizophrenia, an interaction between memory and executive function, and uneven distribution of clinical subtypes. J Clin Exp Neuropsychol. 2002;24:765–780. doi: 10.1076/jcen.24.6.765.8402. [DOI] [PMC free article] [PubMed] [Google Scholar]
- Ivnik RJ, Malec JF, Smith GE, Tangalos EG. Mayo’s Older Americans Normative Studies: WAIS--R norms for ages 56 to 97. The Clinical Neuropsychologist. 1992;6:1–30. [Google Scholar]
- Kremen WS, Seidman LJ, Faraone SV, Toomey R, Tsuang MT. The paradox of normal neuropsychological function in schizophrenia. J Abnorm Psychol. 2000;109:743–752. doi: 10.1037//0021-843x.109.4.743. [DOI] [PubMed] [Google Scholar]
- Leboyer M, Bellivier F, Nosten-Bertrand M, Jouvent R, Pauls D, Mallet J. Psychiatric genetics: search for phenotypes. Trends Neurosci. 1998;21:102–105. doi: 10.1016/s0166-2236(97)01187-9. [DOI] [PubMed] [Google Scholar]
- Martinez-Aran A, Vieta E, Reinares M, Colom F, Torrent C, Sanchez-Moreno J, et al. Cognitive function across manic or hypomanic, depressed, and euthymic states in bipolar disorder. Am J Psychiatry. 2004;161:262–270. doi: 10.1176/appi.ajp.161.2.262. [DOI] [PubMed] [Google Scholar]
- McGrath J, Scheldt S, Welham J, Clair A. Performance on tests sensitive to impaired executive ability in schizophrenia, mania and well controls: acute and subacute phases. Schizophr Res. 1997;26:127–137. doi: 10.1016/s0920-9964(97)00070-4. [DOI] [PubMed] [Google Scholar]
- Meehl PE. Nuisance variables and the ex post facto design. In: Radner M, Winokur S, editors. Minnesota studies in the philosophy of science. Minneapolis: University of Minnesota Press; 1970. [Google Scholar]
- Nuechterlein KH, Green MF. MATRICS Consensus Cognitive Battery. Lutz, FL: Psychological Assessment Resources, Inc.; 2006. [Google Scholar]
- Nurnberger JI, Jr, Blehar MC, Kaufmann CA, York-Cooler C, Simpson SG, Harkavy-Friedman J, et al. Diagnostic interview for genetic studies. Rationale, unique features, and training. NIMH Genetics Initiative. Arch Gen Psychiatry. 1994;51:849–859. doi: 10.1001/archpsyc.1994.03950110009002. discussion 863-844. [DOI] [PubMed] [Google Scholar]
- Pearlson GD, Barta PE, Powers RE, Menon RR, Richards SS, Aylward EH, et al. Ziskind-Somerfeld Research Award 1996. Medial and superior temporal gyral volumes and cerebral asymmetry in schizophrenia versus bipolar disorder. Biol Psychiatry. 1997;41:1–14. doi: 10.1016/s0006-3223(96)00373-3. [DOI] [PubMed] [Google Scholar]
- Pearlson GD, Kreger L, Rabins PV, Chase GA, Cohen B, Wirth JB, et al. A chart review study of late-onset and early-onset schizophrenia. Am J Psychiatry. 1989;146:1568–1574. doi: 10.1176/ajp.146.12.1568. [DOI] [PubMed] [Google Scholar]
- Pearlson GD, Wong DF, Tune LE, Ross CA, Chase GA, Links JM, et al. In vivo D2 dopamine receptor density in psychotic and nonpsychotic patients with bipolar disorder. Arch Gen Psychiatry. 1995;52:471–477. doi: 10.1001/archpsyc.1995.03950180057008. [DOI] [PubMed] [Google Scholar]
- Potash JB. Carving chaos: genetics and the classification of mood and psychotic syndromes. Harv Rev Psychiatry. 2006;14:47–63. doi: 10.1080/10673220600655780. [DOI] [PubMed] [Google Scholar]
- Quraishi S, Frangou S. Neuropsychology of bipolar disorder: a review. J Affect Disord. 2002;72:209–226. doi: 10.1016/s0165-0327(02)00091-5. [DOI] [PubMed] [Google Scholar]
- Randolph C. RBANS Manual, Repeatable Battery for the Assessment of Neuropsychological Status. San Antonio, TX: The Psychological Corporation (Harcourt); 1998. [Google Scholar]
- Rosnow RL, Rosenthal R. Computing contrasts, effect sizes, and counternulls on other people’s published data: General procedures for research consumers. Psychological Methods. 1996;1:331–340. [Google Scholar]
- Rubinsztein JS, Michael A, Paykel ES, Sahakian BJ. Cognitive impairment in remission in bipolar affective disorder. Psychol Med. 2000;30:1025–1036. doi: 10.1017/s0033291799002664. [DOI] [PubMed] [Google Scholar]
- Seidman LJ, Kremen WS, Koren D, Faraone SV, Goldstein JM, Tsuang MT. A comparative profile analysis of neuropsychological functioning in patients with schizophrenia and bipolar psychoses. Schizophr Res. 2002;53:31–44. doi: 10.1016/s0920-9964(01)00162-1. [DOI] [PubMed] [Google Scholar]
- Sheehan DV, Lecrubier Y, Sheehan KH, Amorim P, Janavs J, Weiller E, et al. The Mini-International Neuropsychiatric Interview (M.I.N.I.): the development and validation of a structured diagnostic psychiatric interview for DSM-IV and ICD-10. J Clin Psychiatry. 1998;59(Suppl 20):22–33. quiz 34-57. [PubMed] [Google Scholar]
- Stevens JP. Applied multivariate statistics for the social sciences. 4. Lawrence Erlbaum Associates, Publishers; 2002. [Google Scholar]
- Testa SM, Schretlen DJ. Diagnostic utility of regression based norms in schizophrenia. The Clinical Neuropsychologist. 2006;20:206. [Google Scholar]
- van Gorp WG, Altshuler L, Theberge DC, Mintz J. Declarative and procedural memory in bipolar disorder. Biological Psychiatry. 1999;46:525–531. doi: 10.1016/s0006-3223(98)00336-9. [DOI] [PubMed] [Google Scholar]
- Verdoux H, Liraud F. Neuropsychological function in subjects with psychotic and affective disorders. Relationship to diagnostic category and duration of illness. European Psychiatry. 2000;15:236–243. doi: 10.1016/s0924-9338(00)00238-8. [DOI] [PubMed] [Google Scholar]
- Wing J. SCAN and the PSE tradition. Soc Psychiatry Psychiatr Epidemiol. 1996;31:50–54. doi: 10.1007/BF00801900. [DOI] [PubMed] [Google Scholar]
- Zubieta JK, Huguelet P, O’Neil RL, Giordani BJ. Cognitive function in euthymic bipolar I disorder. Psychiatry Res. 2001;102:9–20. doi: 10.1016/s0165-1781(01)00242-6. [DOI] [PubMed] [Google Scholar]