Abstract
This paper presents a new method for forming high quality ultrasonic strain images. To achieve this goal, three radio-frequency (RF) echo frames are selected by an automated performance assessment method and used to generate two parent strain images located in the same physical grid from which a high quality composite strain image (CSI) may be calculated by averaging. The automatic performance evaluation method combines the consistency among the two parent strain images and the accuracy of motion tracking into a single summary “displacement quality measure” (DQM).
The proposed algorithm is evaluated with data sets acquired from in vivo breast tissue data. Our results show that that the proposed strain formation method shows substantial potential to outperform other methods available in the literature.
Keywords: Ultrasonic strain imaging, performance assessment, elastography, elasticity imaging
INTRODUCTION
Ultrasonic strain imaging emulates manual palpation where tissue is pressed to feel differences in hardness. Unlike manual palpation, ultrasonic strain imaging shows great sensitivity for breast tumor differentiation (Garra et al. 1997; Hall et al. 2003) and characterization of vascular plaques (de Korte et al. 1997). General steps in ultrasonic strain imaging (USI) include deforming the imaged tissue using an external or internal stimulus, measuring tissue response given a pair of conventional ultrasound echo signals (either radiofrequency (RF) or quadrature echo data) before and after the stimulus is applied, and estimating strain from the measured tissue motion to derive “relative hardness” information of the tissue. Both the complexity and sophistication of USI systems have increased dramatically over the past fifteen years, as summarized in several review papers (Gao et al. 1996; Parker et al. 1996; Ophir et al. 1999; Greenleaf et al. 2003; Hall 2003).
Thus far, consistently obtaining high quality in vivo strain images has been a challenge because strain estimation algorithms have limited accuracy and precision when motion is complex. Much effort has been concentrated on algorithm development for tissue motion estimation. Established approaches range from simple correlation-based algorithms (Ophir et al. 1991; O’Donnell et al. 1994; Bamber and Bush 1996; Chaturvedi et al. 1998; Zhu and Hall 2002) to sophisticated optical flow based techniques (Yeung et al. 1998; Maurice and Bertrand 1999; Zhu et al. 1999) or highly regularized algorithms (Pellot-Barakat et al. 2004; Revell et al. 2005). The performance of different motion estimation algorithms (USI systems) are typically evaluated using tissue-mimicking phantom experiments (Hall et al. 1997; Madsen et al. 2003) or theoretical analysis (Bilgen and Insana 1997a; Bilgen and Insana 1997b; Kallel et al. 1997; Varghese and Ophir 1997a; Varghese and Ophir 1997b; Insana and Cook 1999; Cook et al. 2000; Insana et al. 2000; Kaluzynski et al. 2001). Tissue-mimicking elasticity imaging phantoms (Hall et al. 1997; Madsen et al. 2003; Madsen et al. 2005; Madsen et al. 2006) have played important roles in calibrating and validating motion estimation algorithms. However, constructing phantoms which can reproduce the pathological and anatomical variability observed in clinical data may be unrealistic. On the other hand, there are many theoretical or semi-theoretical approaches (Bilgen and Insana 1997a; Bilgen and Insana 1997b; Kallel et al. 1997; Varghese and Ophir 1997a; Varghese and Ophir 1997b; Insana and Cook 1999; Cook et al. 2000; Insana and Bamber 2000; Insana et al. 2000; Kaluzynski et al. 2001) for assessing the performance of ultrasonic strain imaging. Notably, Varghese, et al. (Kallel et al. 1997; Varghese and Ophir 1997a; Varghese and Ophir 1997b) developed a strain filter approach, where the elastographic signal-to-noise ratio, defined as a ratio of the mean value of the estimated strain and the standard deviation of the estimated strain errors, was used to assess the noise level among strain measurements of uniform phantoms. However, applying these theories to in vivo clinical data poses great challenges, as previously discussed (Jiang et al. 2006).
In this study we propose a retrospective processing approach to improve the quality of strain images wherein three RF frames can be selected retrospectively to achieve the “best possible” composite strain images as determined by a displacement quality metric (DQM) for strain images (Jiang et al. 2006). Our preliminary results showed that the assessed performance scores are consistent with human observer evaluation (Jiang et al. 2006). Note that the proposed approach for strain image formation is not restricted to a particular motion tracking algorithm. A modified block-matching algorithm (Zhu and Hall 2002) is adopted for our convenience.
The rest of the paper is structured as follows. A description of the proposed composite strain imaging algorithm is given in Section II, where the underlying rationale is revisited. Experiments with in vivo breast tissue data are described in Section III, results are summarized in Section IV, those results are discussed in Section V and conclusions are drawn in Section VI.
METHODS
Figure 1 illustrates how a composite strain image can be obtained, where one reference echo frame RFi, one preceding target echo frame RFi−j and one trailing target echo frame RFi−k are selected. k and j are positive integers representing different time separations from the ith reference echo frame to the two target echo frames, respectively. Implementation details are given in Section II-C. For each reference frame RFi in a sequence of RF echo frames, those two target frames can be determined by different frame-pairing techniques, as described in Section II-D. The “displacement quality metric” (DQM) of a composite strain image is evaluated by the following empirical equation (Jiang et al. 2006):
Fig. 1.
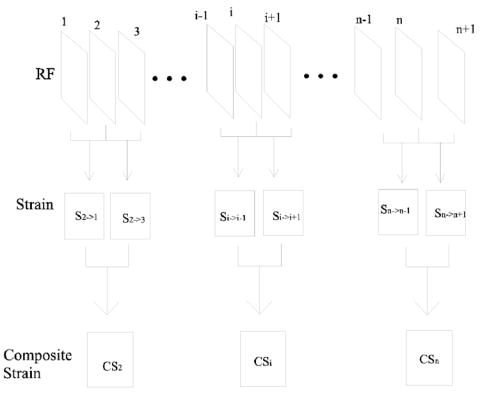
An illustration of ultrasonic composite strain imaging.
| (1) |
| (2) |
where ρrf1 and ρrf2 denote signal similarity measures by Eqn. (3-b) between the first pair (i.e. the motion-compensated preceding target frame RFi−j_M_i and the reference echo frame RFi in Fig.1) and the second pair (i.e. the motion-compensated trailing target frame RFi+k_M_i and the reference echo frame RFi in Fig. 1) of RF echo fields, respectively. The subscript i+k_M_i indicates the (i+k)th echo frame is used to motion-compensate for the ith echo frame by a cubic spline interpolation. ρs is also the signal similarity measure by Eqn. (3-b) between two resulting parent strain fields (axial strains between the reference frame and the two target frames, respectively).
The similarity metric is defined as the normalized cross-correlation (Beauchamp and Yuen, 1979) between two stationary random signals α(x) and β(x) with no time lag,
| (3-a) |
where R denotes the correlation function.
For discrete signals, Eqn. (3-a) is equivalent to the following
| (3-b) |
where N and M are the width and height of the data of interest, respectively. Note that all parameters are computed globally (i.e. over the entire image) in Eqn. (1) and the estimated DQM value is a bounded quantity ranging from zero to one.
Rationale
The rationale behind the proposed strain formation algorithm begins with the classic definition of the signal-to-noise ratio (SNR) in electrical engineering. Given a stationary random signal w(t) = s(t) + n(t), the SNR can be defined as (Bellanger 1984),
| (4) |
where s(t) is the underlying signal and n(t) is the uncorrelated noise. Treating the two estimated parent strain images, α(x) and β(x), as two different realizations of the same tissue elasticity map, s(x), corrupted by different realizations of uncorrelated noise, ni(x):
| (5) |
| (6) |
where x is a two-dimensional (or three-dimensional) coordinate system and η and λ are scalar variables (deformations in these two strain signals could be different). This model is justified given that for small quasi-static deformations (typically 1% axial strain), elastic moduli of biological tissue are nearly constant (Fung 1993) and a linear stress-strain relationship is a reasonable approximation for small incremental strain, the two strain signals that are typically separated by a small time delay (typically < 0.1 seconds) such that viscous effects are minimal (Krouskop et al. 1998), and Belaid et al. (Belaid et al. 1994) have shown through simulations that noise in strains estimated from RF echo signals is Gaussian distributed.
Given a sequence of RF echo data acquired under freehand scanning, there are variations in frame-to-frame deformations (Hall et al., 2003). Therefore, those two parent strain images might represent different frame-average strains. Normalization to compensate for differing frame-average strain prior to averaging is justified. Therefore, the composite strain image γ(x) obtained by a weighted averaging of α(x) and β(x) is defined as
| (7) |
where s(x) represents the strain distribution and the weights for those two parent strain images are 1/λ and 1/η, respectively.
If the noise in these two parent strain images, α(x) and β(x), are both reasonably low (e.g. SNR > 5), the SNR of the composite strain image γ(x) (SNRγ) can be assessed by estimating normalized cross-correlation between α(x) and β(x) (see Appendix A),
| (8) |
Note that a similar derivation for tracking in blood flow imaging was reported by Friemel et al. (Friemel et al. 1998). The composite strain image has a superior signal-to-noise ratio, compared to either of its parent strain images, if the SNR in the parent strain images are reasonably close (i.e. SNRα/SNRβ < 3). Since both parent strain images reside in the same physical grid, the benefit of a lower noise composite strain image comes without the penalty of lower spatial resolution.
Local Fidelity Measures
Alternatively, the measures of motion tracking accuracy and strain image consistency (Eqn. 3) can be computed over smaller regions (on the order of the B –mode point spread function dimensions) to form local DQM images (or, individually, local displacement accuracy and strain consistency maps), as opposed to estimating a single value globally (Jiang et al. 2006). The calculation of local displacement accuracy map is similar to that in the “trashogram” method (Kaluzynski et al. 2001) but is performed on a pair of motion compensated RF echo signals.
If the strain image consistency is estimated over a small area, we can assume that local strain variations are small and therefore can be neglected. In other words, local strains are treated as constants in such a small area. Therefore, the locally estimated SNR is the square or the elastographic signal-to-noise ratio (SNRe; Varghese and Ophir 1997) which applies to a homogeneous field. Under those conditions the locally estimated ρs may be indicative of the local SNR:
| (9) |
where m is the mean of strain measurements and σ is the standard deviation among strain measurements.
Implementation
The proposed strain formation algorithm was implemented in MATLAB® (Mathworks Inc., Natick, MA), as illustrated in Fig. 1. The proposed method consists of the following major steps:
Obtain a triplet of RF frames (e,g, RFi−j, RFi and RFi+k in Fig. 1) and perform motion tracking twice where the ith RF echo frame (RFi) is the reference frame, and the (i−j)th and (i+k)th frames are the target frames. Methods for selection of those three frames are discussed in the next subsection. At this step, two displacement fields (di→i−j and di→i+k) containing both lateral (perpendicular to the acoustic beam direction) and axial (parallel to the acoustic beam direction) displacement components from the ith frame to the (i−j)th and (i+k)th frames, respectively, are calculated. Two parent strain images are formed (Si→i−j and Si→i+k) which reside in the coordinate system of the ith RF echo frame.
Compensate for the motion between RF echo frames RFi and RFi−j using the measured deformation field di→i−j, and then estimate the local normalized cross correlations (a two-dimensional matrix) between RFi and RFi−j_M_i (the motion-compensated version of RFi−j). Similarly, compensate for the motion between RF echo frames RFi and RFi+k using the measured deformation field di→i+k, and estimate the local normalized cross correlations between RFi and RFi+k_M_i. The scalar quantities ρrf (both globally and locally, Eqn. (2)) are estimated to assess the motion tracking accuracy.
Calculate the normalized cross correlations (a two-dimensional matrix) between two parent strain images (Si→i−j and Si→i+k). The scalar quantity ρs can be calculated (both globally and locally, Eqn. (3-b)) to assess strain image consistency.
Construct a composite strain image (e.g. CSi) by weighted averaging of two parent strain images (e.g. Si→i−j and Si→i+k). The weights are used to normalize the frame-average strain of each parent strain image prior to averaging.
Calculate the DQM using Eqn. (1) and assign this value to the composite strain (e.g. CSi).
The B-mode, strain and (local) ”fidelity” images (e.g., DQM, ρrf, ρs, point-wise SNR) can be displayed side by side.
Repeat Step 1—5 for each triplet of RF echo frames in a sequence.
Selection of Three RF Echo Frames
There are at least three different methods for selecting three RF echo frames to form a composite strain image: (1) selecting three consecutive echo frames; (2) selecting three echo frames separated by a desired amount of deformation (Lubinski et al. 1999; Hall et al. 2003); and (3) selecting three echo frames to produce a composite strain image with the highest possible DQM (given a specific tracking algorithm).
Method 1 is the simplest approach, but the drawbacks are obvious. Since in vivo freehand scanning results in non-uniform quality in consecutive strain images (Hall et al. 2003), the composite strain image will be corrupted if quality in one of the parent strain images is much worse than that of the other. Moreover, if frame-to-frame deformation is small both parent strain images could be low contrast resulting in a low quality composite strain image. Method 2 is motivated by the fact that strain image quality is typically a function of the applied deformation and the strain image quality appears to be “optimal” at about 1% applied strain (Lubinski et al. 1999; Hall et al. 2003). Once the center RF echo frame (the ith RF echo frame) is selected, the other two RF echo frames (the (i−j)th and (i+k)th RF echo frames) are chosen to obtain nominally 1% frame-average strain in both parent strain images.
The DQM is a more reliable metric of the quality of strain images than the frame-average strain (Jiang et al. 2006). Therefore, in Method 3 the (i−j)th and (i+k)th RF echo frames are chosen to obtain the highest DQM for their child composite strain image CSi. Obviously, an exhaustive search for the highest DQM is time consuming and such a search should be limited to a reasonably small range i−j < i < i+k. A span of five RF frames in each direction is used in current implementation (j = k = 5).
NUMERICAL EXAMPLES
Approval for the human subject study was obtained from the appropriate Institutional Review Boards and the study was also compliant with the Health Insurance Portability and Accountability Act. Seven data sets (two fibroadenomas, three cancers and two cysts, approximately 700 RF echo frames in total) acquired from in vivo breast scanning were selected as examples for this study. The patient age among this group was 49 ± 13 yrs. Pathologic results were determined by either percutaneous or excisional biopsy. In vivo breast scanning was performed by clinicians using identical equipment and the protocol for data acquisition described by Hall, et al. (Hall et al. 2003).
All strain image examples presented in this paper are estimated with an off-line algorithm (Zhu and Hall 2002), employing a 0.9-mm (lateral) × 0.2-mm (axial) tracking kernel and a 1.6 mm linear regression window used to estimate displacements and strains, respectively.
RESULTS
Table 1 shows that pairing RF echo frames to maximize the parent DQM values can improve the estimated sequence-average DQM values and reduce the DQM fluctuations, thereby providing more consistent high quality strain images. The computational costs for the three frame-pairing methods in MATLAB (without optimization) are approximately 5 frames/minute, 5 frames/minute and 0.2 frames/minute, for Methods 1, 2 and 3, respectively.
Table 1.
The DQM values (mean ± standard deviation) for seven different in vivo breast data sets
| data set | Lesion Type | DQM | ||
|---|---|---|---|---|
| Method 1 | Method 2 | Method 3 | ||
| 1 | FA | 0.42±0.19 | 0.33±0.25 | 0.57±0.15 |
| 2 | FA | 0.56±0.22 | 0.73±0.20 | 0.76±0.12 |
| 3 | Cyst | 0.77±0.10 | 0.76±0.13 | 0.82±0.05 |
| 4 | Cyst | 0.51±0.20 | 0.63±0.11 | 0.74±0.14 |
| 5 | IDC | 0.38±0.19 | 0.36±0.23 | 0.53±0.10 |
| 6 | IDC | 0.38±0.22 | 0.39±0.20 | 0.42±0.21 |
| 7 | Cancer | 0.04±0.09 | 0.05±0.09 | 0.14±0.06 |
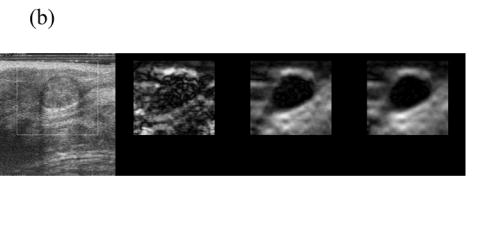
When frame pairing Methods 1 or 2 results in high DQM, the increase in the mean of the DQM values in the sequence for the DQM-based pairing technique is quite small. For instance, Fig 2 shows data for a breast cyst (99 RF frames in total) for which the estimated average DQM values are high (i.e. 0.77, 0.75 and 0.82) for all three pairing techniques. The frame-average strain obtained by pairing consecutive frames for this data is approximately 0.5—1.0%, so pairing three frames to obtain 0.8—1.2% strain often results in the same pairing. However, the third method does provide more consistent composite strain images in a relatively long sequence, as plotted in Fig 2(a). Representative strain images from three different pairing techniques are displayed in Fig. 2(b) and the sequence of strain images corresponding to the estimated DQM values plotted in Fig. 2(b) are shown in Movie 1.
Fig. 2.
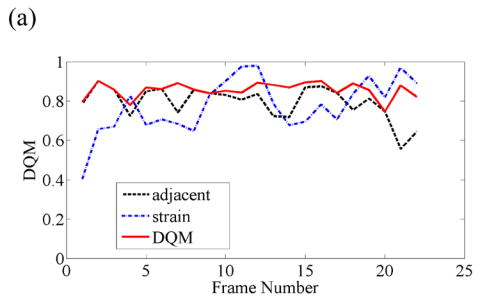
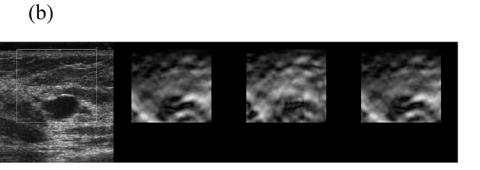
(a) A plot of the DQM values and (b) representative strain images of a breast cyst obtained with three different methods of selecting three RF echo frames to form composite strain images. The white box in the B-mode image (far left) denotes the region of interest. The second image was obtained by pairing adjacent RF echo frames to form strain images, the third image was obtained by pairing frames to obtain 0.8—1.2% frame-average strain, and the fourth image (far right) was obtained by pairing frames to obtain the maximum-available DQM. Media-Movie 1 is included.
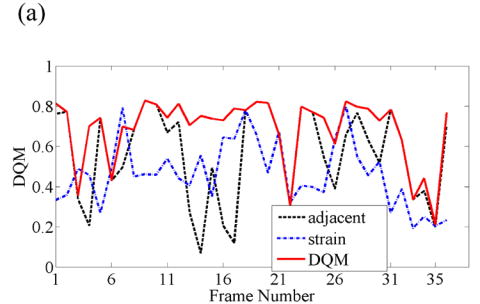
When consecutive frame-average strains are small (roughly 0.2%) and tissue deformation is nearly uniaxial, pairing RF frames to achieve nominally 0.8—1.2% has large potential for increased image quality, as illustrated in Fig. 3(a). Note that pairing three RF echo frames based on the DQM results in further enhancement in image quality. Representative strain images from three different pairing techniques are displayed in Fig. 3(b) and the sequence of strain images corresponding to the estimated performance values plotted in Fig. 3(b) are shown in Movie 2.
Fig. 3.
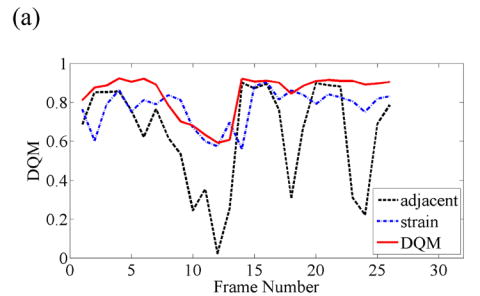
(a) A plot of the DQM values and (b) representative strain images of a breast fibroadenoma obtained with three different methods of selecting three RF echo frames to form composite strain images. The four images are as described in Fig 2. Media-Movie 2 is included.
Since in vivo tissue motion is quite complex, pairing three RF echo frames based solely on the axial deformation cannot always be successful. For instance, relatively large tissue deformation may be accompanied by local shearing, rotation or large elevation motion posing challenges for a block-matching algorithm which assumes rigid body motion (Zhu and Hall 2002). Figure 4 shows an example of data where motion tracking errors (the bright bar in the middle of the lesion in the third image of Fig. 4(b)) result in errors in the estimated frame-average strain and therefore poor frame pairing. As a result, pairing frames for a targeted frame-average strain performs the poorest among the three techniques, as shown in Fig. 4(a). Representative strain images from three different pairing techniques are displayed in Fig. 4(b) and the sequence of strain images corresponding to the estimated performance values plotted in Fig. 4(b) are shown in Movie 3.
Fig. 4.
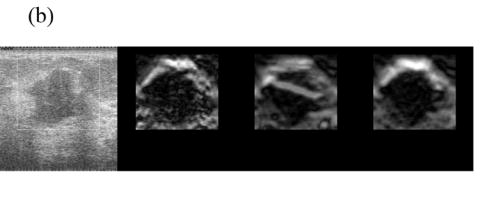
(a) A plot of the DQM values and (b) representative strain images of an atypical breast fibroadenoma by three different methods of selecting three RF echo frames to form composite strain images. The four images are as described in Fig 2. Media-Movie 3 is included.
Figure 5 shows representative composite strain images obtained from the same data shown in Fig 4 for frame-average strains ranging from 0.4—2.5%. When the frame-average strain is low (e.g. 0.4% in Fig. 5(a)), the elastic contrast between the lesion and the background is low. The elastic contrast increases significantly with increasing frame-average strain (Fig. 5(b)). However, deforming the tissue too much (e.g 1.5% in Fig. 5(c)) may pose difficulties in tracking motion. For instance, there is evidence of motion tracking failure (i.e. a bright bar in the middle of the lesion in Fig. 5(c)). The motion tracking completely fails when the (apparent) frame-average strain reaches 2.5% (Fig. 5(d)).
Fig. 5.
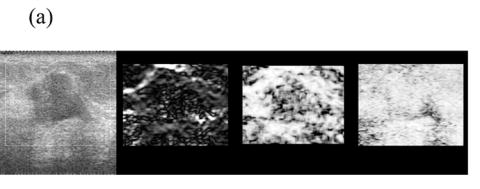
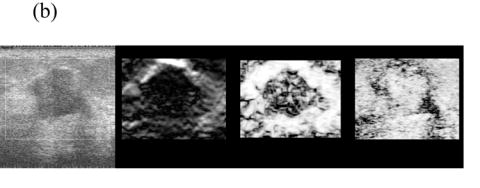
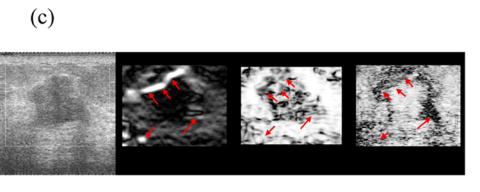
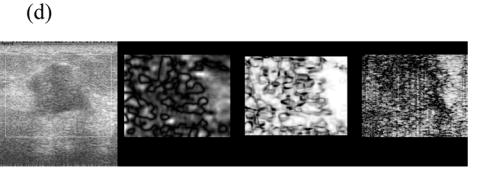
Representative (from left to right) B-mode and strain images, local consistency maps and local motion accuracy maps obtained from an in vivo fibroadenoma at (a) 0.4%, (b) 0.9%, (c) 1.5% and (d) 2.5% frame-average strain. All consistency and accuracy maps are linearly scaled between 0.5-1.0 and displayed as 8-bits images.
Note that the local strain consistency maps (the third image) and the local displacement accuracy maps (the fourth image) in Figs. 5(a)-(d) provide additional information. For instance, high local strain consistency correlates with high local displacement estimate accuracy. The area corresponding to the lesion (low strain and low strain SNR) appears dark and the area corresponding to the normal tissue (high strain and high strain SNR) appears bright in Fig. 5(b). These two local ‘fidelity’ maps can be combined to identify the bright bar in Fig. 5(c) as a motion tracking failure rather than a “sliding artifact” sometimes associated with benign lesions (Chen et al. 1995). Regions of expected strain image noise (see arrows in Fig. 5(c)), can be investigated by determining whether the estimated motion tracking accuracy or the estimated consistency is relatively low.
The local consistency maps should be read carefully. For instance, Fig. 5(d) is a “bad” quality strain image (an estimated performance 0.3) containing no useful information. The local displacement accuracy map (the forth image) shows that the ability to compensate tissue motion is low, but the consistency map (the third image) is reasonably high (≈0.8) because the bright artifacts appear in both parent strain images.
DISCUSSION
The proposed method for strain image formation is straightforward and enhances an ultrasonic strain imaging system with full automation and minimal modification of motion tracking algorithms. Previous work (Jiang et al. 2006) demonstrated that this performance assessment method can be used to eliminate ‘poor’ quality strain images and obtain more consistent strain image sequences.
Using the three-frame strain image formation strategy, the consistency measure between two parent strain images can be uniquely assigned to their composite strain image, as opposed to arbitarily assigning it to one of the parent strain images as in previous work (Jiang et al. 2006). More importantly, with minimal assumptions regarding the signals, underlying motion, or motion tracking algorithms, the local consistency maps can be used to identify problematic regions.
Also novel in this work is the pairing RF echo frames based on the DQM. Exhaustive searching to obtain the highest quality composite strain image possible is not realistic, but a limited search (e.g. five frames in this study) centered at the reference frame is practical. With very small frame-to-frame deformation, limiting the search to a few frames from the reference may result in suboptimal results (Figs. 2(a), 3(a) and 4(a)). Large frame-to-frame deformation can result in violating the assumptions underlying the model (Eqn 5-7). Real-time elasticity imaging systems (Hall et al. 2003; Matsumura et al. 2004) that provide high frame rate elasticity images (e.g. > 10 frames/second) help in obtaining high quality data with frame-average strain of approximately 0.5% that are well suited to this frame pairing technique.
There are limitations to our method. First, the DQM-maximization strategy for frame pairing is intended for on-line post-processing of acquired RF data. The search among RF frames to maximize DQM makes this strategy difficult to implement as a real-time algorithm. However, the three-frame strategy can be implemented in real-time using the current and two trailing frames of RF data. Moreover, frame-pairing by the DQM values (Method 3) can achieve superior image quality but suffers from increased computational cost. To use this frame-pairing technique as an on-line post-processing tool, strategies that enhance its computational efficiency are needed. Second, the local DQM images are single realizations of fidelity measures (i.e. motion tracking accuracy and consistency among parent strain images) with short data segments and are subject to large statistical fluctuations, being somewhat difficult to interpret. Therefore, further testing on a larger patient population is necessary to determine their value.
In this paper, the DQM values are measured by the normalized cross correlation values of random signals with no time lag. Other normalized correlation-metrics (e.g. the normalized correlation coefficient (Brendat and Piersol, 1985)) can also be used but might be restricted to stationary random signals. Since neither a strain image nor a RF echo frame is stationary, only the pattern similarity between two signals is estimated. From our previous work (Jiang et al., 2006), Eqn. (3-b) appears to provide sufficient differentiability between ‘good’ or ‘poor’ strain images.
Conclusions
A novel strain formation algorithm utilizing three frames of RF echo data to consistently form high quality composite strain images is presented. The use of the DQM to pair RF echo frames improves the consistency of consecutive strain image frames compared to pairing consecutive RF frames or pairing RF frames to achieve a desired frame-average strain. Experiments using in vivo breast data demonstrate that this strain image formation strategy is a good candidate for obtaining high quality strain image sequences.
Supplementary Material
Acknowledgments
We are grateful for the support from the NIH (R01CA100373). We are also grateful to colleagues at the Mayo Clinic in Rochester, MN (especially Nicholas Hangiandreou and Gina Hesley) and the Charing Cross Hospital in London, UK (especially William Svensson) for providing some of the data used in this study.
Appendix A
We model two strain images at the same physical grid α(x) and β(x), where α(x) is the signal s1(x) corrupted by noise n1(x), and β(x) is the signal s2 (x) corrupted by noise n2(x). Note that x is the 2-D (or 3-D) spatial coordinate of strain images, both s1(x) and s2(x) are linearly scaled signals of the true strain map s(x) under a certain amount of the applied deformation (e.g. 1% axial strain). The noise terms n1(x) and n2(x) are uncorrelated and stationary. Then,
| (A.1) |
| (A.2) |
The normalized cross-correlation between two stationary random signals α(x) and β(x) with no time delay is (Beauchamp and Yuen, 1979),
| (A.3) |
where R denotes the correlation function.
Sαα(f) and Sββ(f) are the power auto-spectra of signals α(x) and β(x), and Sαβ(f) is the power cross-spectra. Given the fact that the noise terms are uncorrelated with their signals, the auto- and cross-power spectra can be written as,
| (A.4) |
| (A.5) |
| (A.6) |
where Sss is the power auto-spectra of underlying true strain map s(x).
Using the Wiener-Kinchine relations, the inverse Fourier Transformations of R(0) can be obtained as follows (Bendat and Piersol 1986),
| (A.7) |
| (A.8) |
| (A.9) |
(In Eqns. (A.7-9), Fourier kernels are equal to one at time t = 0 and are omitted for clarity.)
The signal-to-noise ratio is usually defined as the ratio of signal power to noise power. The SNRs of signals α(x) and β(x) are obtained as follows,
| (A.10) |
| (A.11) |
Substituting Eqns. (A.7) - (A.9) into Eqn. (A.3), we obtain
| (A.12) |
If and only if SNR = SNRα = SNRβ, becomes a unique index of the SNRs of strain images α(x) and β(x). Otherwise, ραβ may not be a direct measure of either α(x) or β(x).
The weighted average of α(x) and β(x), γ(x), is
| (A.13) |
Therefore, we obtain the SNR of γ(x),
| (A.14) |
Without losing generality, assume SNRβ > SNRα such that
| (A.15) |
where χ is a positive scalar between zero and one.
Substituting Eqn. (A.15) into Eqn. (A.14),
| (A.16) |
Then, SNRγ > SNRβ > SNRα, only when .
Combining Eqns. (A.12) and (A.14),
| (A.17) |
If SNRα ≫ 1 and SNRβ ≫ 1, an unique relation can be established between the estimated ραβ and the child composite strain image γ(x),
| (A.18) |
Thus, if two strain images α(x) and β(x) that reside on the same physical grid are both corrupted by uncorrelated and stationary noise and both maintain reasonably high SNRs, the SNR of the weighted averaged signal γ(x) from them can be assessed by the estimated normalized correlation coefficient between α(x) and β(x).
Footnotes
Publisher's Disclaimer: This is a PDF file of an unedited manuscript that has been accepted for publication. As a service to our customers we are providing this early version of the manuscript. The manuscript will undergo copyediting, typesetting, and review of the resulting proof before it is published in its final citable form. Please note that during the production process errors may be discovered which could affect the content, and all legal disclaimers that apply to the journal pertain.
References
- Bamber JC, Bush NL. Freehand elasticity imaging using speckle decorrelation rate. Acoustic Imaging. 1996;22:285–292. [Google Scholar]
- Belaid N, Cespedes I, Thijssen JM, Ophir J. Lesion detection in simulated elastographic and echographic images: a psychophysical study. Ultrasound in Medicine & Biology. 1994;20:877–891. doi: 10.1016/0301-5629(94)90048-5. [DOI] [PubMed] [Google Scholar]
- Bellanger M. Chichester [West Sussex] New York: Wiley; 1984. Digital processing of signals: theory and practice. [Google Scholar]
- Beauchamp KG, Yuen CK. Digital methods for signal analysis. London: George Allen and Unwin; 1979. [Google Scholar]
- Bendat JS, Piersol AG. Random data: analysis and measurement procedures. New York: Wiley; 1986. [Google Scholar]
- Bilgen M, Insana MF. Error analysis in acoustic elastography. I. Displacement estimation. Journal of the Acoustical Society of America. 1997a;101:1139–1146. doi: 10.1121/1.418018. [DOI] [PubMed] [Google Scholar]
- Bilgen M, Insana MF. Error analysis in acoustic elastography. II. Strain estimation and SNR analysis. Journal of the Acoustical Society of America. 1997b;101:1147–1154. doi: 10.1121/1.418019. [DOI] [PubMed] [Google Scholar]
- Chaturvedi P, Insana MF, Hall TJ. 2-D companding for noise reduction in strain imaging. IEEE Transactions on Ultrasonics, Ferroelectrics and Frequency Control. 1998;45:179–191. doi: 10.1109/58.646923. [DOI] [PubMed] [Google Scholar]
- Chen E, Adler R, Carson P, Jenkins K, O’Brien WD. Tissue motion analysis of digitized B-scan images of breast tumors. Proceedings of the 1995 IEEE Ultrasonics Symposium. 1995;2:1177–1180. [Google Scholar]
- Cook LT, Zhu Y, Hall TJ, Insana MF. Bioelasticity imaging II: Spatial resolution. Proceedings of SPIE - Medical Imaging. 2000;3982:315–324. [Google Scholar]
- de Korte CL, Cespedes EI, van der Steen AF, Lancee CT. Intravascular elasticity imaging using ultrasound: feasibility studies in phantoms. Ultrasound in Medicine & Biology. 1997;23:735–746. doi: 10.1016/s0301-5629(97)00004-5. [DOI] [PubMed] [Google Scholar]
- Friemel BH, Bohs LN, Nightingale KR, Trahey GE. Speckle decorrelation due to two-dimensional flow gradients. IEEE Transactions on Ultrasonics, Ferroelectrics, and Frequency Control. 1998;45:317–327. doi: 10.1109/58.660142. [DOI] [PubMed] [Google Scholar]
- Fung YC. Biomechanics : mechanical properties of living tissues. New York: Springer-Verlag; 1993. [Google Scholar]
- Gao L, Parker KJ, Lerner RM, Levinson SF. Imaging of the elastic properties of tissue--a review. Ultrasound in Medicine & Biology. 1996;22:959–977. doi: 10.1016/s0301-5629(96)00120-2. [DOI] [PubMed] [Google Scholar]
- Garra BS, Cespedes EI, Ophir J, Spratt SR, Zuurbier RA, Magnant CM, Pennanen MF. Elastography of breast lesions: initial clinical results. Radiology. 1997;202:79–86. doi: 10.1148/radiology.202.1.8988195. [DOI] [PubMed] [Google Scholar]
- Greenleaf JF, Fatemi M, Insana M. Selected methods for imaging elastic properties of biological tissues. Annual Review of Biomedical Engineering. 2003;5:57–78. doi: 10.1146/annurev.bioeng.5.040202.121623. [DOI] [PubMed] [Google Scholar]
- Hall TJ. AAPM/RSNA physics tutorial for residents: topics in US: Beyond the basics: Elasticity imaging with US. Radiographics. 2003;23:1657–1671. doi: 10.1148/rg.236035163. [DOI] [PubMed] [Google Scholar]
- Hall TJ, Bilgen M, Insana MF, Krouskop TA. Phantom materials for elastography. IEEE Transactions on Ultrasonics, Ferroelectrics, and Frequency Control. 1997;44:1355–1365. [Google Scholar]
- Hall TJ, Zhu Y, Spalding CS. In vivo real-time freehand palpation imaging. Ultrasound in Medicine & Biology. 2003;29:427–435. doi: 10.1016/s0301-5629(02)00733-0. [DOI] [PubMed] [Google Scholar]
- Insana MF, Cook LT. Bioelasticity imaging: System design. Proceedings of the SPIE Medical Imaging. 1999;3659:224–235. [Google Scholar]
- Insana MF, Cook LT, Bilgen M, Chaturvedi P, Zhu Y. Maximum-likelihood approach to strain imaging using ultrasound. Journal of the Acoustical Society of America. 2000;107:1421–1434. doi: 10.1121/1.428429. [DOI] [PMC free article] [PubMed] [Google Scholar]
- Jiang J, Hall TJ, Sommer AM. A novel performance descriptor of ultrasonic strain imaging: a preliminary study. Transactions on Ultrasonics, Ferroelectrics, and Frequency Control. 2006;53:1088–1102. doi: 10.1109/tuffc.2006.1642508. [DOI] [PMC free article] [PubMed] [Google Scholar]
- Kallel F, Varghese T, Ophir J, Bilgen M. The nonstationary strain filter in elastography: Part II. Lateral and elevational decorrelation. Ultrasound in Medicine & Biology. 1997;23:1357–1369. doi: 10.1016/s0301-5629(97)00196-8. [DOI] [PubMed] [Google Scholar]
- Kaluzynski K, Chen X, Emelianov SY, Skovoroda AR, O’Donnell M. Strain rate imaging using two-dimensional speckle tracking. IEEE Transactions on Ultrasonics Ferroelectrics & Frequency Control. 2001;48:1111–1123. doi: 10.1109/58.935730. [DOI] [PubMed] [Google Scholar]
- Krouskop TA, Wheeler TM, Kallel F, Garra BS, Hall TJ. Elastic moduli of breast and prostate tissues under compression. Ultrasonic Imaging. 1998;20:260–274. doi: 10.1177/016173469802000403. [DOI] [PubMed] [Google Scholar]
- Lubinski MA, Emelianov SY, O’Donnell M. Adaptive strain estimation using retrospective processing. IEEE Transactions on Ultrasonics, Ferroelectrics, and Frequency Control. 1999;46:97–107. doi: 10.1109/58.741428. [DOI] [PubMed] [Google Scholar]
- Madsen EL, Frank G, Hobson MA, Shi H, Jiang J, Varghese T, Hall TJ. Spherical lesion phantoms for testing the performance of elastography systems. Physics in Medicine & Biology. 2005;50:5983–5996. doi: 10.1088/0031-9155/50/24/015. [DOI] [PMC free article] [PubMed] [Google Scholar]
- Madsen EL, Frank GR, Hobson MA, Shi H, Jiang J, Varghese T, Hall TJ. Anthropomorphic breast phantoms for testing elastography systems. Ultrasound in Medicine & Biology. 2006 doi: 10.1016/j.ultrasmedbio.2006.02.1428. Accepted. [DOI] [PMC free article] [PubMed] [Google Scholar]
- Madsen EL, Frank GR, Krouskop TA, Varghese T, Kallel F, Ophir J. Tissue-mimicking oil-in-gelatin dispersions for use in heterogeneous elastography phantoms. Ultrasonic Imaging. 2003;25:17–38. doi: 10.1177/016173460302500102. [DOI] [PubMed] [Google Scholar]
- Matsumura T, Tamano S, Shinomura R, Mitake T, Yamakawa M, Shiina T, Itoh A, Ueno E. Diagnostic Results for Breast Disease by Real-time Elasticity Imaging System. The proceeding of IEEE Ultrasonic Symposium. 2004;2:1484–1487. [Google Scholar]
- Maurice RL, Bertrand M. Lagrangian speckle model and tissue-motion estimation-theory. IEEE Transactions on Medical Imaging. 1999;18:593–603. doi: 10.1109/42.790459. [DOI] [PubMed] [Google Scholar]
- O’Donnell M, Skovoroda AR, Shapo BM, Emelianov SY. Internal displacement and strain imaging using ultrasonic speckle tracking. IEEE Transactions on Ultrasonics, Ferroelectrics, and Frequency Control. 1994;41:314–325. [Google Scholar]
- Ophir J, Alam SK, Garra B, Kallel F, Konofagou E, Krouskop T, Varghese T. Elastography: ultrasonic estimation and imaging of the elastic properties of tissues. Proceedings of the Institution of Mechanical Engineers Part H - Journal of Engineering in Medicine. 1999;213:203–233. doi: 10.1243/0954411991534933. [DOI] [PubMed] [Google Scholar]
- Ophir J, Cespedes EI, Ponnekanti H, Yazdi Y, Li X. Elastography: a quantitative method for imaging the elasticity of biological tissues. Ultrasonic Imaging. 1991;13:111–134. doi: 10.1177/016173469101300201. [DOI] [PubMed] [Google Scholar]
- Parker KJ, Gao L, Lerner RM, Levinson SF. Techniques for elastic imaging: a review. IEEE Engineering in Medicine and Biology Magazine. 1996;15:52–59. [Google Scholar]
- Pellot-Barakat C, Frouin F, Insana MF, Herment A. Ultrasound elastography based on multiscale estimations of regularized displacement fields. IEEE Transactions on Medical Imaging. 2004;23:153–163. doi: 10.1109/TMI.2003.822825. [DOI] [PMC free article] [PubMed] [Google Scholar]
- Revell J, Mirmehdi M, McNally D. Computer vision elastography: speckle adaptive motion estimation for elastography using ultrasound sequences. IEEE Transactions on Medical Imaging. 2005;24:755–766. doi: 10.1109/TMI.2005.848331. [DOI] [PubMed] [Google Scholar]
- Varghese T, Ophir J. The nonstationary strain filter in elastography: Part I. Frequency dependent attenuation. Ultrasound in Medicine & Biology. 1997a;23:1343–1356. doi: 10.1016/s0301-5629(97)00197-x. [DOI] [PubMed] [Google Scholar]
- Varghese T, Ophir J. Theoretical framework for performance characterization of elastography: the strain filter. IEEE Transactions on Ultrasonics, Ferroelectrics, and Frequency Control. 1997b;44:164–172. doi: 10.1109/58.585212. [DOI] [PubMed] [Google Scholar]
- Yeung F, Levinson SF, Fu D, Parker KJ. Feature-adaptive motion tracking of ultrasound image sequences using a deformable mesh. IEEE Transactions on Medical Imaging. 1998;17:945–956. doi: 10.1109/42.746627. [DOI] [PubMed] [Google Scholar]
- Zhu Y, Chaturvedi P, Insana MF. Strain imaging with a deformable mesh. Ultrasonic Imaging. 1999;21:127–146. doi: 10.1177/016173469902100204. [DOI] [PubMed] [Google Scholar]
- Zhu Y, Hall TJ. A modified block matching method for real-time freehand strain imaging. Ultrasonic Imaging. 2002;24:161–176. doi: 10.1177/016173460202400303. [DOI] [PubMed] [Google Scholar]
Associated Data
This section collects any data citations, data availability statements, or supplementary materials included in this article.


