

Abstract
Alterations in lipid metabolism play an integral role in neuronal death in cerebral ischemia. Here we used an in vitro model, oxygen-glucose deprivation (OGD) of PC12 cells, and analyzed changes in phosphatidylcholine (PC) and sphingomyelin (SM) metabolism. OGD (4–8-h) of PC12 cells triggered a dramatic reduction in PC and SM levels, and a significant increase in ceramide. OGD also caused increases in PC-phospholipase C (PC-PLC) and phospholipase D (PLD) activities and PLD2 protein expression, and reduction in cytidine triphosphate:phosphocholine cytidylyltransferase-α (CCTα, the rate-limiting enzyme in PC synthesis) protein expression and activity. Phospholipase A2 activity and expression were unaltered during OGD. Increased neutral sphingomyelinase activity during OGD could account for SM loss and increased ceramide. Surprisingly, treatment with PC-PLC inhibitor D609 aggravated cell death in PC12 during OGD. D609 was cytotoxic only during OGD; cell death could be prevented by inclusion of sera, glucose or oxygen. During OGD, D609 caused further loss of PC and SM, depletion of 1,2-diacylglycerol (DAG), increase in ceramide and free fatty acids (FFA), cytochrome c release from mitochondria, increases in intracellular Ca2+ ([Ca2+]i), PARP cleavage and phosphatidylserine externalization, indicative of apoptotic cell death. Exogenous PC during OGD in PC12 cells with D609 attenuated PC, SM loss, restored DAG, attenuated ceramide levels, decreased cytochrome c release, PARP cleavage, annexin V binding, attenuated the increase in [Ca2+]i, FFA release, and significantly increased cell viability. Exogenous PC may have elicited these effects by restoring membrane PC levels. A tentative scheme depicting the mechanism of action of D609 (inhibiting PC-PLC, SM synthase, PC synthesis at the CDP-choline-DAG phosphocholine transferase (CPT) step and causing mitochondrial dysfunction) has been proposed based on our observations and literature.
Keywords: Phosphatidylcholine, Sphingomyelin, Flow cytometry, Confocal imaging, Phospholipases, D609, Oxygen-glucose deprivation, PC12 cells, CDP-choline, Glutathione, Ceramide
Focal cerebral ischemia, or stroke, remains one of the leading causes of death and long-term disability worldwide (American Heart Association stroke statistics 2005), despite advances in understanding of the molecular mechanisms responsible for neuronal damage. A well known neuronal model for in vitro studies of cell death is provided by the rat pheochromocytoma PC12 cell line (Tischler et al., 2004). This cell line has been extensively used for cell signaling studies, various types of neurochemical studies and neuronal death models (Reimann-Philipp et al., 2001, Hillion et al., 2005, Karten et al., 2005). Oxygen-glucose deprivation (OGD) is an in vitro model for stroke since cessation of blood flow deprives the brain of essential components, oxygen and glucose.
Alterations in lipid metabolism play an integral role in the chain of events that lead to neuronal damage in cerebral ischemia. Lipids targeted during ischemia include phosphatidylcholine (PC) and sphingomyelin (SM) among others (Adibhatla et al., 2001, 2006, Adibhatla and Hatcher, 2007). PC is the most abundant phospholipid in eukaryotic membranes and serves as an essential structural component in cellular membranes. PC is also a source of several biologically active lipids (Cui and Houweling, 2002). Under normal conditions, PC homeostasis is achieved by a balance between PC synthesis, primarily through the Kennedy pathway in extrahepatic tissues (Adibhatla et al., 2004), and degradation of PC by phospholipases. However, this balance is disrupted following ischemia. Cytidine triphosphate:phosphocholine cytidylyltransferase (CCT), the rate-limiting step in PC synthesis (Jackowski and Fagone, 2005), may be targeted by proteases that are activated by the apoptotic cascade after ischemia (Mallampalli et al., 2000, Lagace et al., 2002). Proteolysis of CCT subsequently inhibits the synthesis of PC. Furthermore, phospholipases are activated following ischemia (Sun et al., 2004, Klein, 2005, Adibhatla and Hatcher, 2006), resulting in increased hydrolysis of PC. The resulting net reduction in PC levels destabilizes cellular membranes, generates pro-inflammatory lipid mediators such as arachidonic acid, and promotes apoptosis. Similarly, the ischemic pathway stimulates sphingomyelinases (SMase) and formation of ceramide (Ohtani et al., 2004, Soeda et al., 2004). Ceramide, a potent apoptotic factor, causes mitochondrial dysfunction and activates caspases that promote apoptosis (Hannun and Luberto, 2000, Woodcock, 2006).
Phospholipases have received wide attention for their role in progression of stroke injury (Sun et al., 2004, Adibhatla and Hatcher, 2006). PC is hydrolyzed by phospholipases A2 (PLA2s), PC-phospholipase C (PC-PLC) and phospholipase D (PLD). PLA2s have been categorized as Ca2+-dependent cytosolic PLA2 (cPLA2) and secretory PLA2 (sPLA2), and Ca2+-independent PLA2 (iPLA2) (Sun et al., 2004, 2005, Adibhatla and Hatcher, 2006, Moses et al., 2006). Two isozymes of PLD, PLD1 (~120 kDa) and PLD2 (~100 kDa), have been identified (Klein, 2005). SM can be targeted by acidic SMase (A-SMase) and the neutral, Mg2+-dependent SMase (N-SMase) (Goni and Alonso, 2002).
The effects of OGD on PC and SM metabolism in PC12 cells remain largely undetermined. Here, we show that PC and SM levels are dramatically reduced following OGD of PC12 cells. The reduction in PC levels can be explained by increases in PC-PLC and PLD activities and PLD2 protein expression and a decrease in CCTα expression and activity in PC12 cells subjected to OGD. Increase in N-SMase activity could account for the reduction in SM levels in PC12 cells subjected to OGD. We anticipated that treatment of PC12 cells with the PC-PLC inhibitor tricyclodecan-9-yl xanthogenate (D609) (Amtmann, 1996) during OGD would attenuate PC loss and cell death. D609 had no effect on PC12 viability under normoxic conditions. Surprisingly, D609 caused further loss of PC and SM, depletion of 1,2-diacylglycerol (DAG), increase in ceramide, free fatty acid (FFA), and exacerbated PC12 cell death during OGD. D609 also triggered cytochrome c release from mitochondria, cleavage of poly-ADP ribose polymerase (PARP), increased intracellular Ca2+ ([Ca2+]i) and Annexin V binding (a prevalent hallmark of apoptosis) during OGD of PC12 cells. Exogenous PC during OGD in PC12 cells with D609 restored PC, SM and DAG levels, attenuated ceramide levels, FFA release, decreased cytochrome c release, PARP cleavage, annexin V binding, and increase in [Ca2+]i, and significantly increased cell viability.
EXPERIMENTAL PROCEDURES
Chemicals and reagents
All chemicals and reagents unless stated otherwise were purchased from Sigma (St. Louis, MO). The following supplies were obtained form the indicated suppliers: CDP-choline and D609 (BioMol, Plymouth Meeting, PA); egg lecithin (Avanti Polar Lipids, Alabaster, AL, of the following composition: 16:0, 34%; 16:1, 1.7%; 18:0, 11%; 18:1, 32%; 18:2, 18%; 20:4, 3.3%); 1-palmitoyl-2-arachidonyl-3-phosphocholine (Sigma, St. Louis, MO); n-butanol, Whatman LK-5 silica gel plates, and solvents (HPLC grade) for TLC (Fisher Scientific, Pittsburg, PA); Silica gel G and silica gel H TLC plates (Analtech, Newark, DE); Tris-glycine gels (BioRad, Hercules, CA); CytoTox96 Cytotoxicity assay kit (Promega, Madison, WI); Amplex Red PC-PLC, PLD and SMase assay kits (Molecular Probes-Invitrogen, Carlsbad, CA); Annexin V-PE and mouse monoclonal anti-cytochrome c antibody (BD Biosciences, San Diego, CA). Other antibodies were obtained from the following suppliers: rabbit polyclonal anti-sPLA2 (Upstate, Charlottesville, VA); mouse monoclonal anti-sPLA2 IIA (Cayman, Ann Arbor, MI, and a generous gift from Dr. J. Aarsman, Utrecht, Netherlands); rabbit polyclonal antibody recognizing both full length PARP (116 kDa) and the 89 kDa cleavage product (Cell Signaling, Beverly, MA); rabbit polyclonal anti-cPLA2 IVA and rabbit polyclonal anti-iPLA2, rabbit polyclonal anti-PLD, goat polyclonal anti-CCTα, goat polyclonal anti-N-SMase, Caki-1 cell lysate (Santa Cruz Biotech, Santa Cruz, CA); horseradish peroxidase (HRP) conjugated goat anti-rabbit and goat anti-mouse IgG (Bio-Rad); and donkey anti-goat IgG (Santa Cruz). Detection of Western blots used SuperSignal from Pierce (Rockford, IL).
Cell culture and OGD
PC12 cells were generously provided by the laboratory of Thomas F.J. Martin (University of Wisconsin-Madison). PC12 cells were grown in 10 cm dishes in DMEM supplemented with 4.5 mg/mL glucose, 5% bovine calf serum, and 5% equine serum. Cells were replated 24-h prior to the experiment at a density of 10–15 × 106 viable cells/dish. On the day of the experiment, cells were washed twice with a glucose-free isotonic salt solution (OGD buffer pH 7.4) consisting of the following in mM: 20 NaHCO3, 120 NaCl, 5.36 KCl, 0.33 Na2HPO4, 0.44 KH2PO4, 1.27 CaCl2, and 0.81 MgSO4 (Lenart et al., 2004). Cells were preincubated for 1-h at room temperature prior to OGD with the indicated concentrations of D609, 0.3% n-butanol dissolved in OGD buffer, or PC suspended in OGD buffer (by sonication). Cells were then incubated for the indicated length of time under hypoxic conditions, achieved by placing the culture dishes in an incubation chamber containing 94% N2, 5% CO2, and <1% O2. During the first 30 min, cells were placed on an orbital shaker to allow for equilibration of hypoxic gases. As a control for OGD, PC12 cells were incubated in OGD buffer supplemented with 5% bovine calf serum, 5% equine serum, and 4.5 mg/mL glucose in normoxic conditions for the indicated length of time.
Trypan blue exclusion for estimating cell viability
Resuspended PC12 cells were incubated for 5 min in 0.4% trypan blue and counted in a hemocytometer for unstained (viable) cells and stained cells. The percentage of cell viability was calculated as: [(number of unstained cells)/(number of total cells)] × 100.
Lactate dehydrogenase (LDH) release for cell death assessment
Extent of cell death in PC12 cells was assessed as LDH release using the CytoTox96 cytotoxicity assay kit including necessary controls according to the manufacturer’s instructions. The percentage of LDH release was calculated as [(LDH released into media)/(LDH released into media + LDH released from lysed cells)] × 100.
PC, SM, DAG, FFA and ceramide analysis (Rao et al., 2000, Adibhatla et al., 2001)
All solvents and extracts were purged with N2 during the extraction, TLC and methylation of lipids. Total lipids were extracted from PC12 cells into CHCl3/MeOH (1:2 by volume) containing 0.01% BHT. The following TLC plates and solvent systems (by volume) were used to separate various lipids: (1) PC and SM: Whatman LK-5 silica gel plates with pre-concentration zone, CHCl3/EtOH/H2O/triethylamine (30:35:7:35), (2) ceramide: silica gel H, chloroform/methanol/acetic acid (94:2:5) and (3) DAG and FFA: silica gel G, petroleum ether/diethyl ether/acetic acid (80:20:1). Lipids were identified using authentic standards, converted to methyl esters, and analyzed with a Hewlett Packard 6890 gas chromatograph using a capillary column.
Protein expression-immunoblotting of PC12 cell lysates (PLD, PLA2, CCTα, N-SMase, PARP and cytochrome c)
PC12 cell pellets were resuspended in 10 mM HEPES (pH 7.4) containing 0.5 mM EDTA, 0.5 mM EGTA, and protease inhibitor cocktail and homogenized by passage through a 27 gauge needle. Homogenates were centrifuged for 10 min at 1,000 x g to remove insoluble material. The 1,000 x g pellet represented a crude nuclear fraction and was resuspended in the aforementioned HEPES buffer containing 0.5% Triton X-100. The 1,000 x g supernatant was further centrifuged for 10 min at 18,000 x g. The resulting 18,000 x g pellet, which represented a crude mitochondrial fraction, was resuspended in HEPES buffer containing 0.5% Triton X-100. The 18,000 x g supernatant was used as a cytosolic fraction. The indicated amount of each fraction was loaded into the lanes of pre-cast Tris-glycine gels and subjected to SDS-PAGE electrophoresis and transfer to nitrocellulose. Following blocking with 5% non-fat dry milk in 1 x TBS with 0.05% Tween-20 (TBST), blots were incubated with the primary antibody overnight at 4°C.
Protein levels of PLD in the 18,000 x g supernatant were determined by using a rabbit polyclonal antibody directed against residues 1–160 of human PLD. Caki-1 cell lysate was used as a positive control for PLD. Protein levels for sPLA2 in the 18,000 x g supernatant were determined by using both polyclonal and monoclonal antibodies directed against sPLA2. Rat blood platelets were used as a positive control for sPLA2 group IIA. CCTα protein levels were determined by using a goat polyclona l antibody raised against the N terminus of CCTα. Protein levels of N-SMase in the 18,000 x g supernatant were determined using a goat polyclonal antibody raised against the C terminus of rat N-SMase. PARP processing following OGD was determined by immunoblotting the nuclear fraction (1,000 x g pellet) with a rabbit polyclonal antibody recognizing both full length PARP (116 kDa) and the 89 kDa cleavage product. Release of cytochrome c from the mitochondria was determined by immunoblotting the mitochondrial fraction (18,000 x g pellet) and the cytosolic fraction with a mouse monoclonal antibody. As a loading control, blots were probed with a monoclonal antibody directed against β-actin. Blots were washed with 1 x TBST and incubated for 1-h at room temperature with HRP-conjugated secondary antibody in 5% non-fat dry milk. For CCTα and N-SMase blots, HRP-conjugated donkey anti-goat antibodies were used. For actin, cytochrome c, and sPLA2 monoclonal antibody blots, HRP-conjugated goat anti-mouse antibodies were used. For all other blots, HRP-conjugated goat anti-rabbit antibodies were used. Blots were then incubated with SuperSignal West Pico chemiluminescent substrate for 5 min and exposed to X-ray film.
CCT activity (Adibhatla et al., 2004)
Changes in CCT activity in PC12 cells following OGD were determined by measuring the generation of radiolabeled CDP-choline from [methyl-14C] phosphocholine as described (Adibhatla et al., 2004). PC12 cells were resuspended in 50 mM Tris (pH 7.4) containing 150 mM NaCl, 1 mM EDTA, 1 mM EGTA, 2 mM dithiothreitol, 0.025% sodium azide, and protease inhibitor cocktail and homogenized by 10 passages through a 27 gauge needle followed by brief sonication. Homogenates were then centrifuged at 400 x g for 10 min to pellet insoluble material. Assays were conducted using 60 μg of protein from the 400 x g supernatant. Labeled CDP-choline was recovered by charcoal extraction and radioactivity was determined by scintillation counting.
PC-PLC (Adibhatla et al., 2006) and PLD activities
PC-PLC and PLD activities in PC12 cells were determined by using the Amplex Red PC-PLC (Adibhatla et al., 2006) and PLD Assay Kits according to the manufacture’s instructions. PC12 cell pellets were resuspended in 10 mM HEPES (pH 7.4) containing 0.5 mM EDTA, 0.5 mM EGTA, and protease inhibitor cocktail and homogenized by passage through a 27 gauge needle. Homogenates were then centrifuged at 400 x g for 10 min, and assays were performed using 50 μg of the 400 x g supernatant of PC12 homogenate in 96-well microplates incubated at 37°C for 30 min. PC-PLC from Bacillus cereus and PLD from Streptomyces chromofuscus (Sigma) were used to generate standard curves to calculate PC-PLC and PLD activities in PC12 cell samples. To control for the contributions of endogenous choline, phosphocholine and H2O2 present in PC12 cell homogenates, samples without the PC substrate were included.
Neutral and acidic SMase activities
The activity of both neutral and acidic SMases in PC12 cells was determined by the Amplex Red SMase Assay Kit. PC12 cells were homogenized as described above and 50 μg of protein was used. For N-SMase assays, samples were diluted in 0.1 M Tris-HCl (pH 7.4), 10 mM MgCl2. Microplates were incubated at 37°C for 30 min, and the absorbance at 563 nm was measured. For A-SMase assays, samples were diluted in 50 mM sodium acetate (pH 5.0) and incubated at 37°C for 1-h with 0.5 mM SM. Following the 1-h incubation, a solution of Amplex red, horseradish peroxidase, choline oxidase, and alkaline phosphatase in 100 mM Tris-HCl (pH 8.0) was added to each sample and the reaction was monitored as previously described. SMase from Bacillus cereus was used to generate a standard curve to calculate SMase activity in PC12 cell samples. Samples without the SM substrate were included to control for the contributions of endogenous choline, phosphocholine and H2O2 present in PC12 cell homogenates.
PLA2 activity (Adibhatla et al., 2006)
PLA2 activity was determined as the release of [1-14C]-arachidonic acid as previously described (Adibhatla et al., 2006), with some modifications. Briefly, PC12 cells were resuspended in 10 mM HEPES (pH 7.4) containing 0.5 mM EDTA, 0.5 mM EGTA, and protease inhibitor cocktail, homogenized by passage through a 27 gauge needle and centrifuged for 10 min at 1,000 x g. Assays were conducted using 200 μg of 1,000 x g supernatant. [1-14C]-arachidonic acid was separated by TLC as previously described (Adibhatla et al., 2006). Pancreatic PLA2 was used as a positive control.
Glutathione assay (Adibhatla et al., 2001)
PC12 cell pellets were resuspended in 0.1 M phosphate buffer, 5 mM EDTA (pH 7.5) and homogenized by passage through a 27-gauge needle. Aliquots of the homogenates were diluted with 9 volumes of 5.55% 5-sulfosalicylic acid. After centrifugation to remove precipitated proteins, the supernatants were analyzed for total glutathione in a 96-well micro-titer plate using the 5,5′-dithiobis-(nitrobenzoic acid) (DTNB) enzymatic recycling assay (Tietze, 1969). Reduced glutathione (GSH) dissolved in 5% 5-sulfosalicylic acid was used for the standard curve.
Immunostaining of OGD-treated PC12 cells for cytochrome c
PC12 cells were replated on poly-L-lysine-treated coverslips in 35 mm dishes at a density of 1.5–2 × 10⁶ viable cells/dish 24-h before the experiment. The day of the experiment, coverslips were washed twice with OGD buffer and transferred to 6-well plates. Coverslips were pre-incubated with D609 dissolved in OGD buffer for 1-h prior to the experiment. Following OGD, cells were washed twice with 1x PBS, then incubated with propidium iodide (PI) for 15 min at room temperature to stain for dead cells. Following four washes with 1x PBS, cells were then fixed with 4% paraformaldehyde for 20 min at room temperature. Cells were blocked in blocking buffer (10% normal goat serum, 0.4% Triton X-100, 0.5% BSA in 1x PBS) for 30 min at room temperature. Cells were incubated with a mouse monoclonal cytochrome c antibody at a 1:50 dilution in blocking buffer at 4°C overnight. Following washing with 1x PBS, cells were incubated with goat anti-mouse IgG conjugated to Alexa-Fluor 488 (1:200 dilution in blocking buffer) for 1-h at 37°C. Coverslips were mounted onto slides with Vectashield mounting medium and dried. Fluorescence images were taken with a Leica DMIRE2 confocal microscope (40 x) and Leica confocal software (Leica Microsystems Inc., Mannheim, Germany). Both fluorophores were excited at 488 nm with an argon/krypton laser. The emission fluorescence for cytochrome c staining was recorded at 500–535 nm, and the emission fluorescence for PI staining was recorded at 555–640 nm.
Flow cytometry-Annexin V-PE binding: Staining of apoptotic cells and fluorescence-activated cell sorting (FACS) analysis
PC12 cells were replated on 35 mm dishes at a density of 1.5–2 × 10⁶ viable cells/dish 24-h prior to the experiment. Cells were exposed to OGD for the indicated time in the presence or absence of D609. Following OGD, cells were collected, washed twice with cold 1x PBS, and resuspended in 1x annexin binding buffer at a density of 106 cells/mL. 105 cells were then incubated with Annexin V-phycoerythrin (PE) for 15 min at room temperature in the dark. Data were acquired on a FACSCalibur bench-top flow cytometer (Becton Dickinson, San Jose, CA) using CellQuest acquisition and analysis software. The fluorochrome was excited by a 488 nm laser. The PE emission was collected with a 585/42 band pass filter. 10,000 events were acquired and data were analyzed using CellQuest software.
Intracellular Ca2+ [Ca2+]i measurements (Lenart et al., 2004)
[Ca2+]i concentrations in OGD-treated PC12 cells were determined using the fluorescent Ca2+ indicator fura-2 AM (Lenart et al., 2004). PC12 cells were replated on poly-L-lysine-treated coverslips in 35 mm dishes at a density of 1.5–2 × 10⁶ viable cells/dish 24-h before the experiment. Coverslips containing PC12 cells were exposed to OGD for the indicated time in the presence or absence of D609 as previously described, except 5 μM fura-2 AM was added to cells immediately before OGD. After OGD, coverslips were placed in an open-bath imaging chamber containing HEPES-MEM at ambient temperature. PC12 cells were excited every 10 sec at 345 and 385 nm, and the emission fluorescence at 510 nm was recorded using a Nikon TE 300 inverted epifluorescence microscope and a 40x Super Fluor oil immersion objective lens. Images were collected and analyzed with the MetaFluor image-processing software. Cells were exposed to 1 mM MnCl2 in Ca2+-free HEPES-MEM at the end of each experiment to determine the Ca2+-insensitive fluorescence, which was then subtracted from each wavelength before calculations. The MnCl2-corrected 345/385 emission ratios were converted to concentration using the Grynkiewicz equation (Grynkiewicz et al., 1985) as follows:
where R is the experimental 345/385 ratio; Rmin is the ratio in HEPES-MEM without Ca2+ and containing 1 mM EGTA and 10 μM 4-bromo-A23187; Rmax is the ratio in HEPES-MEM with 2 mM Ca2+, 10 μM 4-bromo-A23187, 4 μM rotenone, and 2 μM FCCP; and β is the ratio of the 385 nm fluorescence intensities determined at Rmin (0.4) and Rmax (2.85); and Kd is the dissociation constant for the dye in PC12 cells, 225 nM (Grynkiewicz et al., 1985).
Statistical analysis
Data are represented as mean ± standard deviation. Statistical significance was determined by analysis of variance (ANOVA) followed by Bonferroni’s multigroup comparisons post-test. A value of p<0.05 was considered significant.
RESULTS
Effects of OGD on PC12 cells
PC12 cells were incubated in hypoxic conditions in the absence of glucose and serum for various lengths of times, and the effect of such conditions on cell viability was determined. Increasing the time of OGD caused progressive reduction in cell viability as measured by trypan blue staining and LDH release (Fig. 1); after 8-h OGD, cell viability had dropped to ~60% and LDH release had increased to ~50%.
FIGURE 1. Effect of OGD on PC12 cell survival.
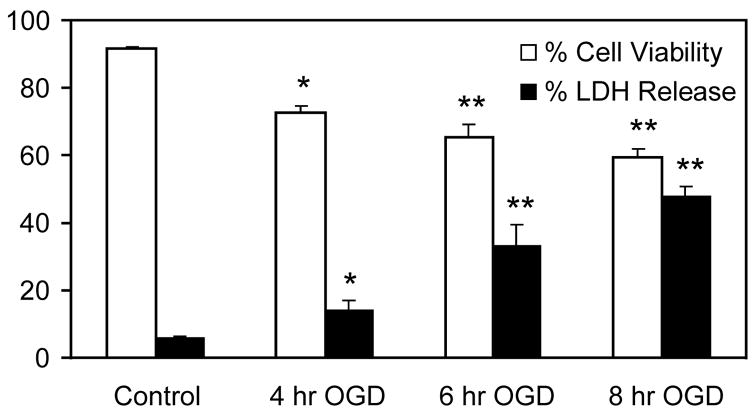
PC12 cells were subjected to OGD for up to 8-h. Cell viability was determined by trypan blue staining. * p<0.05 and ** p<0.01 vs. control (n=6).
Lipid alterations in PC12 cells following OGD
Since PC levels of were reduced after transient focal cerebral ischemia (Adibhatla et al., 2006), we examined whether PC12 cells would exhibit similar changes after OGD. Lipid extracts from PC12 cells subjected to various OGD periods were separated by thin layer chromatography (TLC), converted to methyl esters and analyzed by gas chromatography (GC) to measure changes in PC, SM, and ceramide levels. Increasing time of OGD caused a gradual reduction in PC (Fig. 2A), SM (Fig. 2B) levels and an increase in ceramide (Fig. 2B). After 8-h OGD, PC and SM were reduced by ~35% and 20%, respectively, while ceramide levels increased by 3-fold compared to controls.
FIGURE 2. OGD significantly altered the lipid levels of PC12 cells.
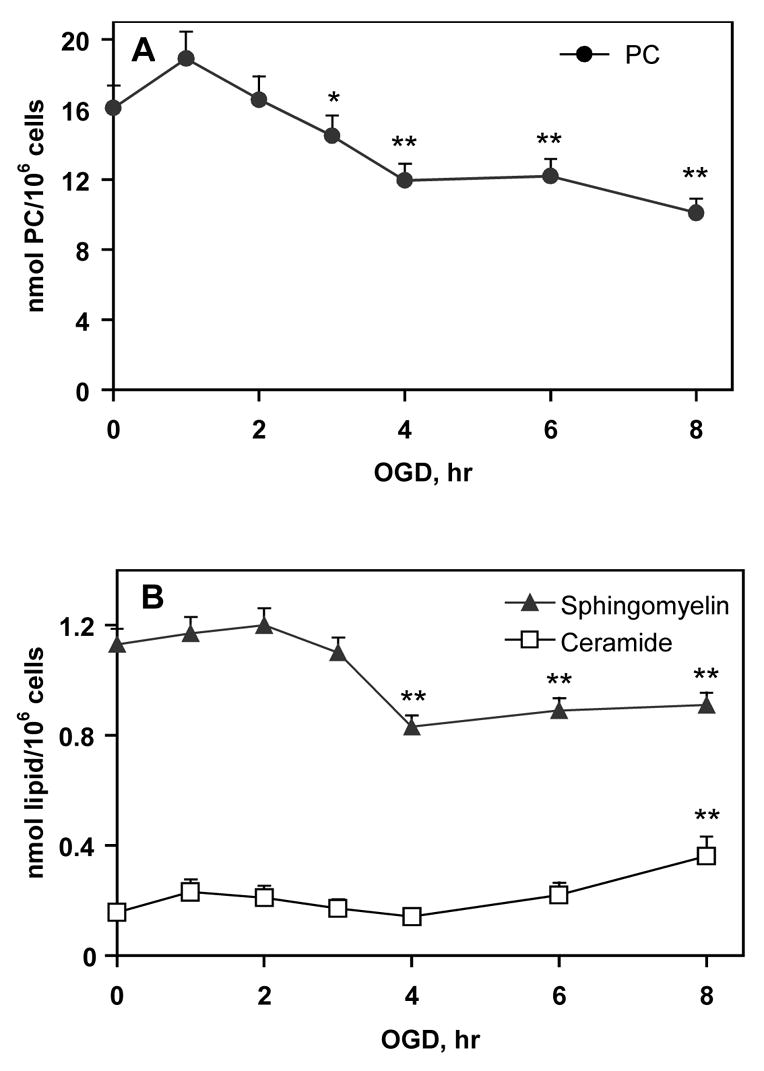
Values are given as total fatty acids derived from the respective lipids. (A) PC levels (B) SM and ceramide levels. There were no significant differences in SM levels from 4 to 8-h OGD. Ceramide levels were significantly increased after 8-h OGD. * p<0.05 and ** p<0.01 vs. control (0-h or no OGD) (n=4).
PC-PLC and PLD are responsible for PC loss after OGD in PC12 cells
Since OGD in PC12 cells caused a significant loss of PC, we sought to determine which phospholipase (PLA2, PC-PLC, or PLD) could be responsible for this reduction. We measured PC-PLC and PLD activities in PC12 cells after OGD by Amplex Red PC-PLC and PLD Assay kits. PC-PLC activity increased 1.6 to 4-fold compared to controls over 2-h to 8-h OGD (Table 1), indicating that PC-PLC was partly responsible for the PC loss after OGD.
Table 1.
PC-PLC activity during OGD of PC12 cells and effect of D609. Controls (no OGD) were incubated with D609 for 4-h or without D609 for 8-h.
| PC-PLC activity, mU/mg protein | ||
|---|---|---|
| no D609 | with D609 | |
| Control | 31.3 ± 2.5 | 14.1 ± 1.8## |
| 2-h OGD | 51.2 ± 4.6** | 28.2 ± 3.5## |
| 4-h OGD | 94.8 ± 6.6** | 41.7 ± 4.1## |
| 8-h OGD | 126.2 ± 8.1** | ND |
p<0.01 compared to control and
p<0.01 compared to no D609.
n=4 determinations. ND = not determined since cell death is nearly complete by 4-h OGD with D609.
Western blots showed PLD2 protein levels increased with increasing length of OGD, exhibiting 5.4-fold increase after 8-h OGD (Fig. 3A). PLD1 expression was below the detection level. PLD activity also showed 2- to 5-fold increase over 4–8-h OGD compared to control (55 mU PLD/mg protein).
FIGURE 3. PLD2 protein expression increased after OGD in PC12 cells.

(A) PLD2 Western blot (30 μg protein loaded). Caki-1 cell lysate was used as a reference for PLD. Relative changes in PLD2 protein expression are given as the ratio to controls levels (0 OGD) and normalized to β-actin. (B) PC12 cells were incubated under normoxic conditions in the presence of glucose and serum (control) or subjected to OGD for 8-h in the presence or absence of 0.3% n-butanol (n-BuOH). t-Butanol (t-BuOH) served as a control for n-BuOH and had no significant effect on cell viability after 8-h OGD. ** p<0.01 vs control; # p<0.05 vs 8-h OGD; @ p<0.01 vs control, not significant compared to 8-h OGD (n=4).
We next determined if the increase in PLD contributed to PC12 cell death during OGD. There is no direct PLD inhibitor, however, formation of the PLD product phosphatidic acid can be blocked by the transphosphatidylation reaction of PLD in the presence of a primary alcohol (McDermott et al., 2004). Secondary or tertiary alcohols do not undergo this reaction and thus serve as a control. We incubated PC12 cells with 0.3% n-butanol (Klein, 2005) during 8-h OGD to determine the functional importance of phosphatidic acid formation. Cell viability in n-butanol-treated PC12 cells subjected to OGD was reduced by an additional 24% compared to OGD alone (Fig. 3B), suggesting pro-survival signaling by formation of phosphatidic acid. n-Butanol had no effect on viability of control PC12 cells. Exposure of PC12 cells to t-butanol during 8-h OGD had no significant effect on viability compared with 8-h OGD alone (Fig. 3B).
We did not observe any changes in protein expression of sPLA2 IIA, cPLA2 or iPLA2 by Western blots. Also, PLA2 activity in PC12 cells (determined using radiolabeled assay) was low and did not change following OGD (data not shown).
OGD reduces CCTα expression and CCT activity
CCTα protein expression was decreased after 8-h OGD (Fig. 4A). CCT activity did not change over 6-h OGD compared to controls. However, 8-h OGD resulted in a ~34% reduction in CCT activity compared to controls (control 2.50 ± 0.21, 8-h OGD 1.64 ± 0.46 nmol/min/mg protein, p<0.01 for 8-h OGD vs control, n=5 determinations).
FIGURE 4. CCTα and N-SMase protein expression after OGD in PC12 cells.
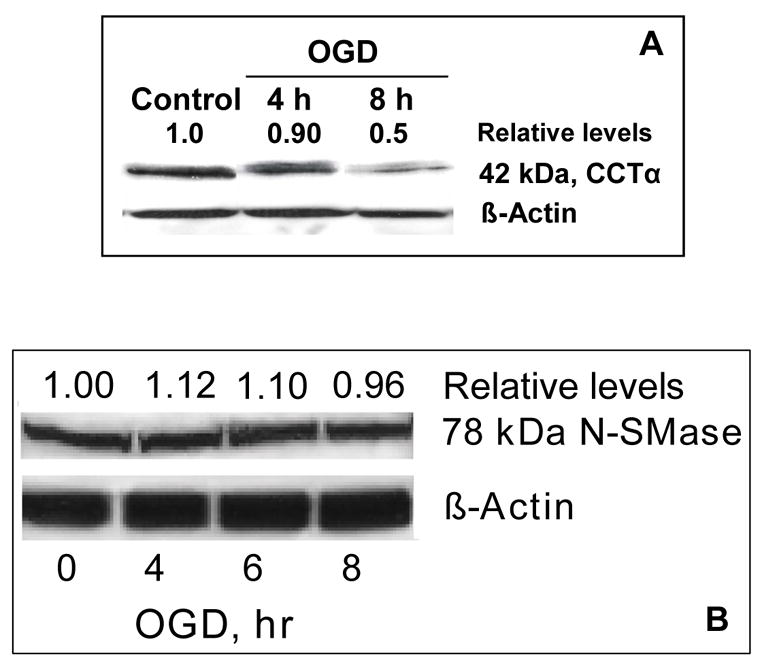
Western blots showing time course of (A) CCTα and (B) N-SMase protein expression in PC12 cells after OGD (100 μg protein loaded). A 78 kDa band, corresponding to the brain-specific N-SMase isoform N-SMase2 (Hofmann et al., 2000), was detected in PC12 cells. Relative changes in protein expression are given as the ratio to controls and normalized to β-actin.
N-SMase expression and SMase activities after OGD
Western blots for N-SMase revealed a band at 78 kDa (Fig. 4B), the same molecular weight as N-SMase2, a brain-specific isoform of N-SMase found in PC12 cells (Hofmann et al., 2000), which was unchanged during OGD. N-SMase activity increased approximately 2-fold in PC12 cells subjected to 4-h and 8-h OGD (Table 2). A-SMase activity was higher in control PC12 cells compared to N-SMase, but did not change over 2-h to 8-h OGD compared to controls (Table 2).
Table 2.
N-SMase and A-SMase activities during OGD of PC12 cells and effect of D609. Controls (no OGD) were incubated with D609 for 4-h or without D609 for 8-h.
| Enzyme activity, mU/mg protein | |||
|---|---|---|---|
| N-Smase‡ | A-SMase | ||
| no D609 | no D609 | with D609 | |
| Control | 2.1 ± 0.2 | 15.2 ± 0.6 | 7.4 ± 0.5## |
| 2-h OGD | 3.0 ± 0.3* | 15.7 ± 0.4 | 7.1 ± 0.4## |
| 4-h OGD | 4.0 ± 0.3** | 14.8 ± 0.3 | 6.5 ± 0.3## |
| 8-h OGD | 4.7 ± 0.5** | 15.3 ± 0.4 | ND |
p<0.05 and
p<0.01 compared to control and
p<0.01 compared to no D609.
n=4 determinations. ND = not determined since cell death is nearly complete by 4-h OGD with D609.
D609 had no effect on N-SMase activity (data not shown).
D609 exacerbates cell death and phospholipid hydrolysis in OGD-treated cells
To assess the role of PC-PLC in OGD-induced PC12 cell death, we treated PC12 cells with the xanthogenate compound D609, a PC-PLC inhibitor (Amtmann, 1996). It was anticipated that PC-PLC inhibition would attenuate PC hydrolysis and increase PC12 cell viability after OGD. We initially determined cell viability after 8-h OGD, since this resulted in ~40% cell death. Treatment with 1 μM and 10 μM D609 had no significant effect on cell viability. However, 100 μM D609, a concentration near the IC50 of 94 μM (Schutze et al., 1992), unexpectedly caused complete cell death after 8-h OGD. We next examined the time-course of cell death over 8-h OGD in the presence of 100 μM D609. Up to 3-h OGD, D609 had no significant effect on cell viability compared to OGD without D609 (Fig. 5A). However, by 4-h OGD, a dramatic increase in cell death (~95%) occurred, and by 6-h OGD, almost no viable PC12 cells remained (Fig. 5A). D609 had no effect on the viability of control cells. The cytotoxic effects of D609 required the absence of oxygen, glucose and serum (Fig. 5B). PC12 cells incubated under normoxic conditions in the absence of glucose and sera exhibited no reduction in cell viability compared to controls. Conversely, the addition of either glucose or sera could prevent the effects of D609 in PC12 cells subjected to hypoxic conditions (Fig. 5B).
FIGURE 5. PC-PLC inhibitor, D609 further increased cell death after OGD in PC12 cells.

(A) D609 100 μM had no significant effect on cell viability during the first 3-h of OGD compared to OGD alone. However, from 3 to 4-h OGD, the viability of D609-treated cells declined to ~10%. * p<0.05 and ** p<0.01 vs 0-h OGD; ## p<0.01 vs. OGD without D609 (n=4). (B) PC12 cells were incubated under normoxic conditions in the presence of glucose and serum (control) or subjected to 4-h OGD in the presence or absence of 100 μM D609. PC12 cells subjected to OGD and treated with D609 were supplemented with either 4.5 mg/mL glucose, 5% equine and bovine sera, or oxygen (normoxic). * p<0.05 and ** p<0.01 vs control; ## p<0.01 vs OGD with D609 (n=4).
D609 readily undergoes oxidation in aqueous media (Bai et al., 2004) and its oxidized form will have different biological activity. Since cells were pre-incubated with D609 for 1-h prior to OGD, we therefore investigated whether incubation of D609 in OGD media for 24-h prior to exposure to PC12 cells (to assure complete oxidation) or addition of D609 at the onset of OGD (to minimize oxidation) would have different effects on cell viability during OGD. In both cases, D609 caused >95% cell death after 4-h OGD (data not shown).
In order to determine how D609 enhanced cell death in OGD-treated PC12 cells, we analyzed the lipid composition of OGD-treated cells incubated with D609. Since cell death is nearly complete (~95%) by 4-h OGD in the presence of D609, parameters were not determined for longer OGD periods. At early OGD time points (1–2-h), there was little difference in PC levels in OGD-treated cells with or without D609 (Fig. 6A). However, 3-h OGD with D609 resulted in significantly lower PC levels and at 4-h OGD, D609 caused an even greater reduction in PC levels compared with OGD alone. To confirm that D609 was in fact inhibiting PC-PLC activity, we compared the PC-PLC activity in cells subjected to OGD with and without D609. PC-PLC activity was reduced by D609 in control PC12 cells and in PC12 cells subjected to OGD (Table 1), confirming PC-PLC inhibition by D609 in PC12 cells.
FIGURE 6. D609 increased PC and SM hydrolysis and ceramide generation during OGD in PC12 cells.
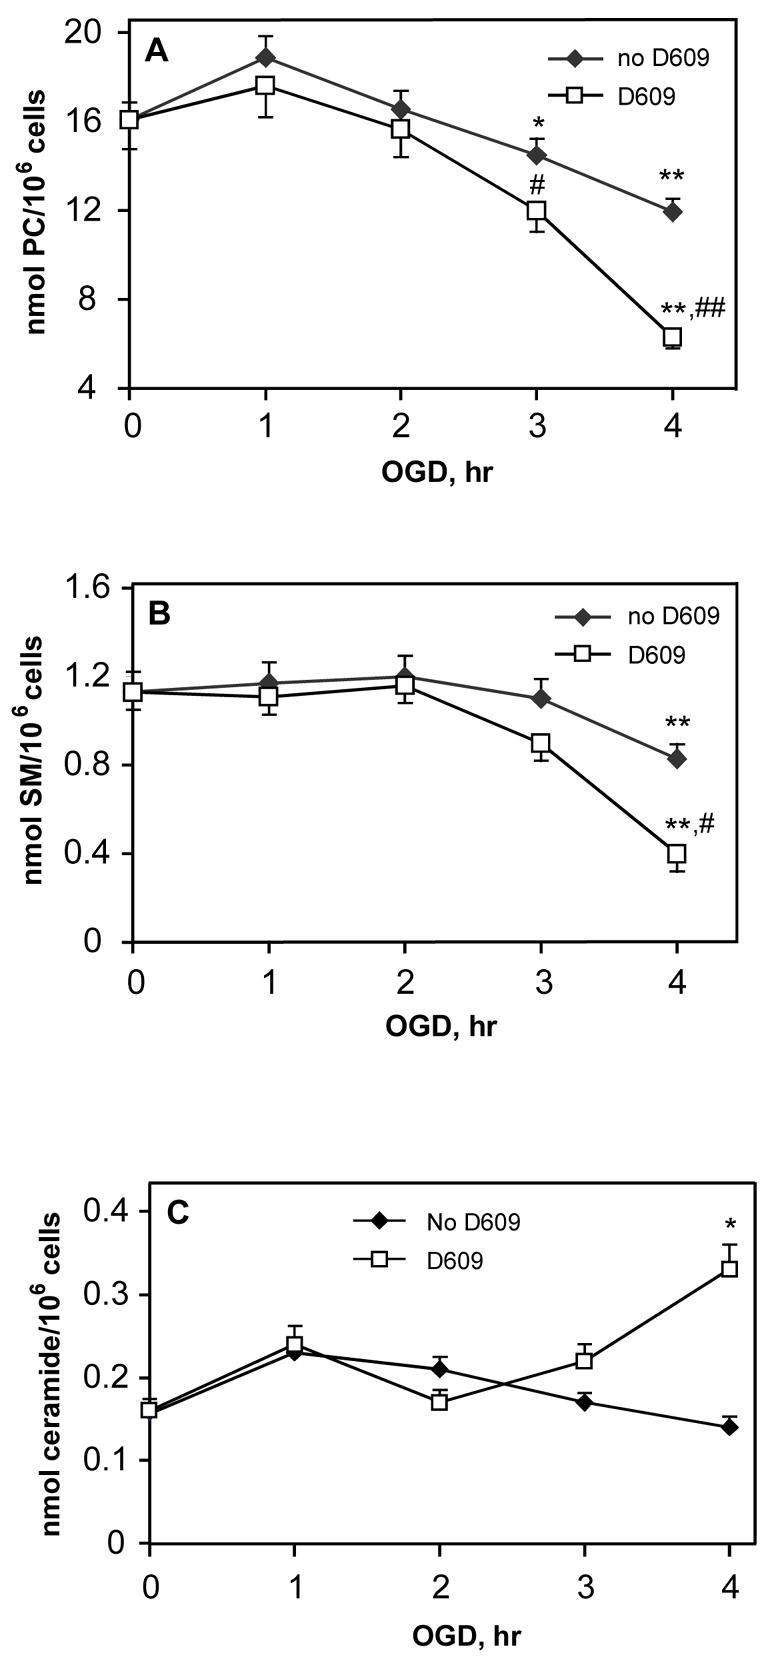
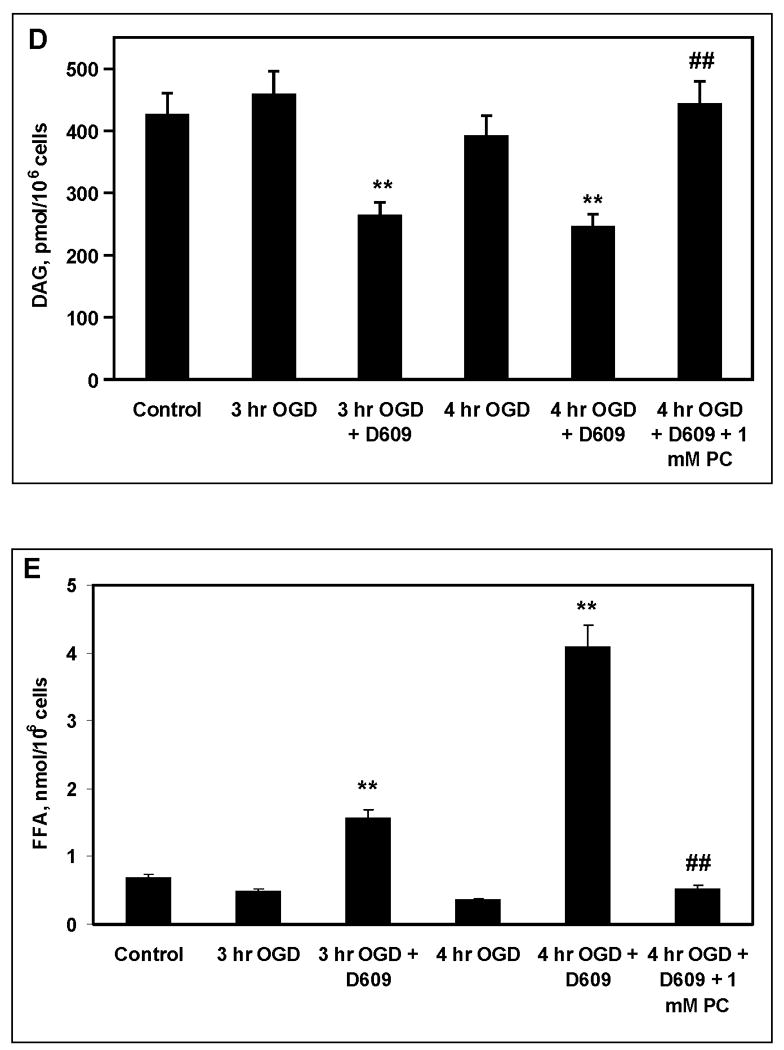
PC12 cells were subjected to OGD in the presence or absence of 100 μM D609. Values are given as total fatty acids derived from respective lipids. (A) PC levels, * p<0.05 and ** p<0.01 vs. 0-h OGD (control); # p<0.05 and ## p<0.01 vs. OGD without D609 (n=4). (B) SM degradation in PC12 cells subjected to 4-h OGD and treated with 100 μM D609. ** p<0.01 vs. controls (0-h OGD); # p<0.05 vs. OGD alone (n=4). (C) Ceramide levels * p<0.05 vs. controls (0-h OGD) and vs 4-h OGD without D609 (n=4). (D) DAG levels in PC12 cells after OGD and treatment with D609 and 1 mM PC. ** p<0.01 vs control; ## p<0.01 vs 4-h OGD with D609 (n=4). (E) FFA levels in PC12 cells after OGD and treatment with D609 and 1 mM PC. ** p<0.01 vs control; ## p<0.01 vs 4-h OGD with D609 (n=4). D609 did not cause any changes in lipids when incubated with control PC12 cells for up to 4-h (normoxic conditions; PC 16.1 ± 1.1 nmol/106 cells; SM 1.13 ± 0.09 nmol/106 cells; ceramide 0.16 ± 0.01 nmol/106 cells and DAG 430 ± 39 pmol/106 cells; FFA 0.68 ± 0.054 nmol/106 cells).
SM and ceramide levels in OGD-subjected PC12 cells incubated with D609 showed little difference between untreated and D609-treated cells over 1–3-h OGD. However, at 4-h OGD, D609-treated cells exhibited increased SM degradation compared to OGD alone (Fig. 6B). There was a modest increase in ceramide formation in D609-treated PC12 cells compared with untreated cells subjected to 4-h OGD (Fig. 6C).
DAG levels were unchanged after 3-h and 4-h OGD compared to controls. Treatment with D609 resulted in significant decreases in DAG levels at 3-h and 4-h OGD (Fig. 6D). Addition of 1 mM PC during 4-h OGD with D609 restored DAG to control levels (Fig. 6D) and attenuated ceramide to control levels (0.17 ± 0.02 nmol/106 cells). FFA levels were unchanged after 3-h and 4-h OGD compared to controls (Fig. 6E). Treatment with D609 resulted in significant increases in FFA levels at 3-h and 4-h OGD. Addition of 1 mM PC during 4-h OGD with D609 restored FFA to control levels (Fig. 6E).
D609 caused loss of glutathione in OGD-subjected PC12 cells
Since D609 contains a thiol group and can function as an antioxidant or glutathione mimetic (Sultana et al., 2004, Perluigi et al., 2006), we evaluated the glutathione status in PC12 cells subjected to OGD and D609 treatment. Total glutathione levels were determined in PC12 cells following OGD and treatment with D609. After 4-h OGD, glutathione levels showed a 2-fold increase compared to controls (Fig. 7A). Exposure to D609 during 4-h OGD resulted in near-complete depletion (95% loss compared to 4-h OGD without D609) of glutathione (Fig. 7A). To assess whether depletion of glutathione was a factor in cell death, PC12 cells were incubated with the glutathione precursor N-acetylcysteine (NAC, 25 mM) (Yoshimura et al., 1999). NAC resulted in a 6-fold increase in glutathione levels in control PC12 cells exposed to D609 (Fig. 7A). NAC also restored glutathione to control levels in PC12 cells exposed toD609 during 4-h OGD (Fig. 7A).
FIGURE 7.
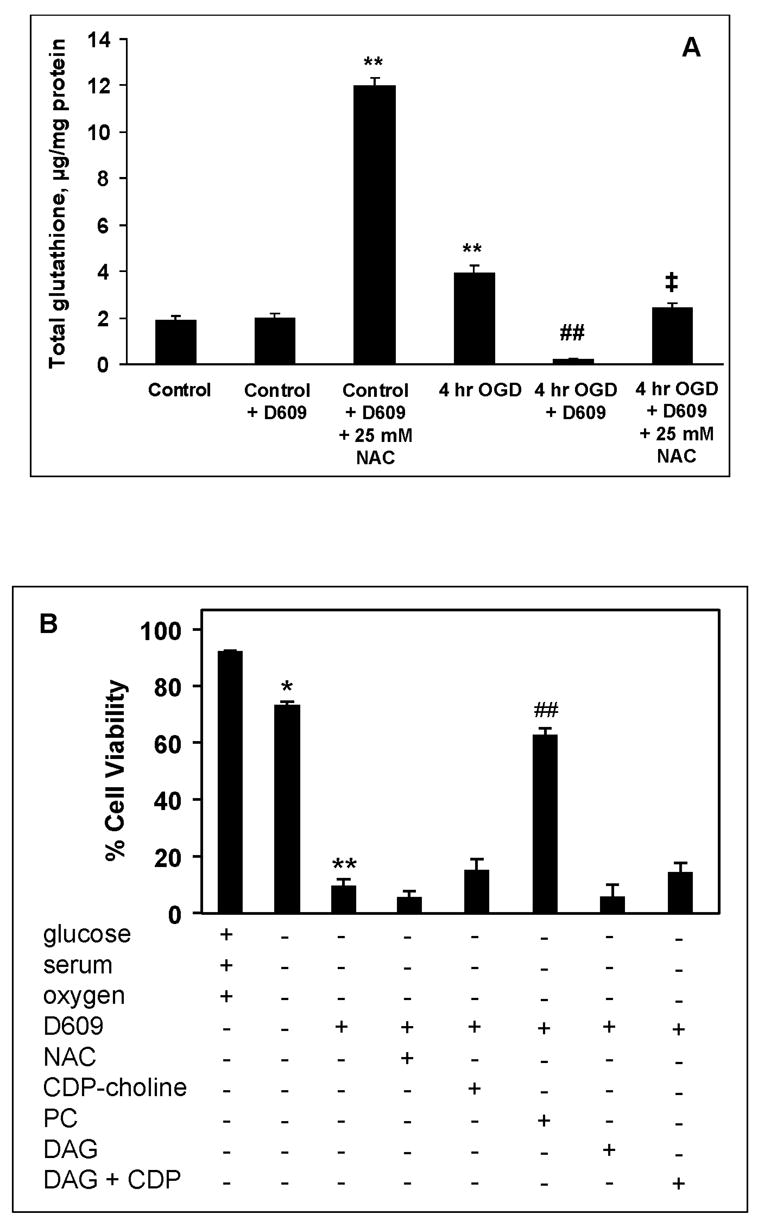
(A). Effect of N-acetylcysteine (NAC) on total glutathione levels in PC12 cells after OGD and treatment with D609. ** p<0.01 compared to control, ## p<0.01 compared to 4-h OGD without D609, ‡ p<0.01 compared to 4-h OGD + D609. (B) PC12 cells were incubated under normoxic conditions in the presence of glucose and serum (control) or subjected to 4-h OGD in the presence or absence of 100 μM D609. PC12 cells subjected to OGD and treated with D609 were supplemented with either 25 mM N-acetylcysteine (NAC), 1 mM CDP-choline, 1 mM PC, 0.1 mM DAG, or (1 mM CDP-choline + 0.1 mM DAG). * p<0.05 and ** p<0.01 vs control; ## p<0.01 vs OGD with D609 (n=4).
Effects of exogenous NAC, CDP-choline, PC and DAG on D609-induced cell death
Even though NAC increased glutathione levels of D609-treated PC12 cells, NAC had no effect on PC12 cell viability after 4-h OGD with D609 exposure (Fig. 7B), indicating that glutathione depletion was not a significant factor in D609-induced cell death. To assess the role of PC loss in cell death induced by D609 during OGD, PC12 cells were treated with 1 mM CDP-choline or 1 mM PC (egg lecithin or 1-palmitoyl-2-arachidonyl-3-phosphocholine) during 4-h OGD with D609. Exogenous CDP-choline did not significantly increase cell viability (Fig. 7B), whereas exogenous PC significantly increased cell viability to 62% (p<0.01 compared with 4-h OGD + D609, Fig. 7B). Addition of 0.1 mM PC had no significant effect on cell viability (data not shown). Addition of 1-palmitoyl-2-arachidonyl-3-phosphocholine provided the same increase in cell viability as did egg lecithin (data not shown). Exogenous DAG (0.1 mM) did not prevent D609-induced cell death during OGD (Fig. 7B). The combination of DAG and CDP-choline, the two precursors for PC synthesis, also did not prevent D609-induced cell death (Fig. 7B). Exogenous PC, but not CDP-choline, restored PC (16.2 ± 1.1 nmol/106 cells) and SM (0.97± 0.06 nmol/106 cells) to control (no OGD) levels in PC12 cells subjected to 4-h OGD with D609.
PC12 cells were exposed to D609 under the same conditions as OGD except that glucose, sera, or glucose + sera were incorporated into the media. Replenishing either glucose or sera in the media prevented cell death induced by D609 in PC12 cells subjected to hypoxic conditions (Fig. 5B). Addition of glucose in the presence of D609 restored sphingomyelin to control levels (1.15 ± 0.08 nmol/106 cells), increased PC to 12.6 ± 1.1 nmol/106 cells (78% of control levels), attenuated increased ceramide levels (0.21 ± 0.02 nmol/106 cells), but did not increase DAG levels (230 ± 28 pmol/106 cells). Replenishing sera or sera + glucose in the presence of D609 under hypoxic conditions restored these lipids to control levels (Fig. 6, 0-h OGD referred as control). D609 did not cause any changes in lipids when incubated with control PC12 cells for up to 4-h (normoxic conditions; PC 16.1 ± 1.1 nmol/106 cells; SM 1.13 ± 0.09 nmol/106 cells; ceramide 0.16 ± 0.01 nmol/106 cells and DAG 430 ± 39 pmol/106 cells).
Effect of D609 on N-SMase and A-SMase
To determine if D609 affected SMase activity in OGD-subjected PC12 cells, we compared the activities of both N-SMase and A-SMase in cells subjected to OGD in the presence or absence of D609 (Table 2). There was no significant change in N-SMase activity in D609-treated cells over 2-h to 4-h OGD compared to OGD alone (data not shown). In contrast, a significant decrease in A-SMase activity was observed in D609-treated control PC12 cells and cells subjected to OGD (Table 2).
D609 stimulated release of cytochrome C from the mitochondria and cleavage of poly ADP-ribose polymerase (PARP) in OGD-treated PC12 cells
Full-length PARP (116 kDa), a nuclear protein, is cleaved by caspases to yield 89 and 24 kDa fragments (Soldani and Scovassi, 2002). Western blots were conducted on the crude nuclear fractions (1,000 x g pellet) of PC12 homogenates using a rabbit polyclonal antibody recognizing both full length PARP and the 89 kDa cleavage product. Very little processing of PARP was observed in the nuclei of control cells (both in the absence and presence of D609), or in the nuclei of cells subjected to 4-h OGD (Fig. 8). In contrast, the nuclei of cells subjected to 4-h OGD with D609 displayed the PARP cleavage fragment. Addition of 1 mM PC to the media attenuated PARP cleavage during OGD with D609 (Fig. 8).
FIGURE 8. Western blots for PARP and cytochrome c.
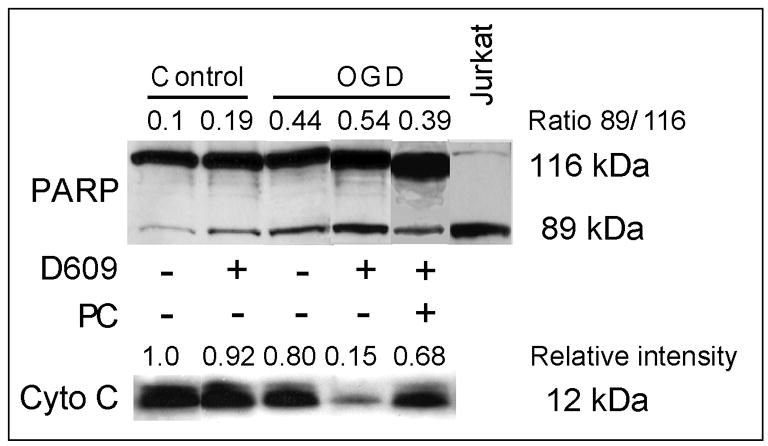
D609 stimulated PARP cleavage and cytochrome c release from the mitochondria in PC12 cells subjected to OGD (n=4). Representative images are shown. PARP and its cleavage product were analyzed in the nuclear fraction of PC12 cells (30 μg protein loaded). PARP cleavage is expressed as the ratio of the intensity of the band at 89 kDa to the intensity of the band at 116 kDa. Cytochrome c was measured in the mitochondrial fraction (30 μg protein loaded). Relative intensities are expressed as the ratio to control. Cytochrome c was not detected in the cytosol fraction (blot not shown).
Western blots for cytochrome c were conducted on the mitochondrial fractions (18,000 x g pellets) of OGD-subjected PC12 cells. A representative blot is shown in Fig. 8. Cytochrome c was present in the mitochondrial fractions of control cells with and without D609 and cells subjected to 4-h OGD without D609 (Fig. 8). However, when PC12 cells were subjected to 4-h OGD in the presence of D609, most of cytochrome c was lost from the mitochondrial fraction. Cytochrome c was not detected in the cytosolic fraction (data not shown), suggesting degradation or secretion from the cells. Exogenous 1 mM PC attenuated loss of cytochrome c from the mitochondria (Fig. 8).
To confirm these findings, we performed immunocytochemistry of PC12 cells subjected to OGD in the presence or absence of D609. Following OGD, PC12 cells were incubated with propidium iodine (PI) and fixed with 4% paraformaldehyde. Cells were then incubated with cytochrome c monoclonal antibody and Alexa-Fluor 488-conjugated goat anti-mouse antibodies and confocal images were recorded. Control cells showed punctate perinuclear staining for cytochrome c (Fig. 9A), a pattern indicative of mitochondrial localization. Cells subjected to 4-h OGD showed some cell death, as exhibited by staining with PI, but viable cells with punctate perinuclear staining of cytochrome c were also observed (Fig. 9B). However, in cells subjected to 4-h OGD in the presence of D609 (Fig. 9C), almost all cells were stained by PI. In some PI-stained cells, cytochrome c staining was much less punctate and was often diffuse throughout the cell, indicating that, in these cells, cytochrome c had been released from the mitochondria into the cytosol. In other PI-stained cells, there was no detectable cytochrome c staining, indicating complete loss from the mitochondria. In these cells, the released cytochrome c may have been subsequently degraded, or released into the extracellular space.
FIGURE 9. Confocal images: serum or PC prevented D609-induced cytochrome c release and PI staining in PC12 cells subjected to OGD.
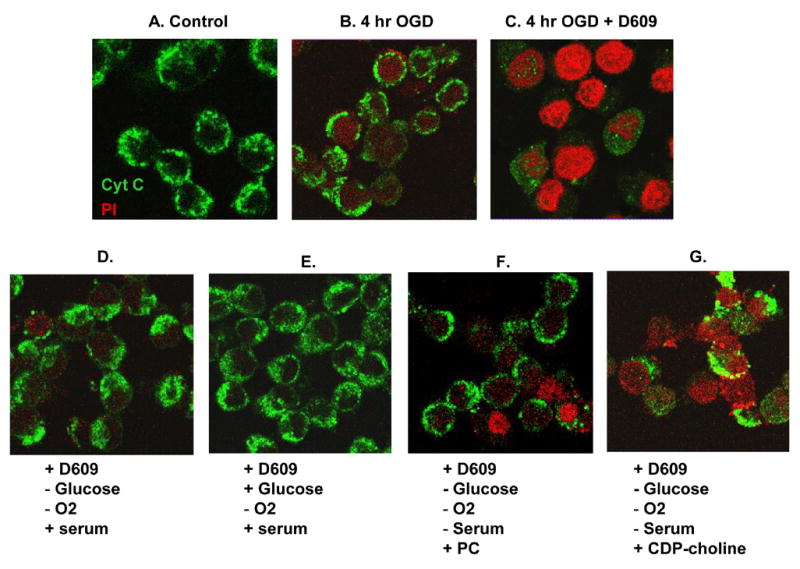

(n=4). Representative images have been shown. Cells were incubated with propidium iodine (PI) and fixed with 4% paraformaldehyde. Cells were then incubated with cytochrome c (Cyt. C) antibody and Alexa-Fluor 488-conjugated goat anti-mouse antibodies.. The fluorescence emissions for cytochrome c (green) and for PI (red) were recorded with a Leica DMIRE2 confocal microscope (40x). (A) Control cells showed punctate perinuclear staining for cytochrome c. (B) Cells subjected to 4-h OGD showed some PI staining, but viable cells with punctate perinuclear staining of cytochrome c were also observed. (C) After 4-h OGD with D609, almost all cells were stained by PI and most cells had lost cytochrome c. (D) when serum was incorporated into the media during 4-h OGD with D609, only a few cells stained for PI and cytochrome c showed mainly normal punctate peri-nuclear staining. (E) With addition of serum and glucose, cells appeared similar to controls. (F) Addition of 1 mM PC to the media during OGD with D609 prevented much of the cytotoxic effects of D609, but some cells still showed PI staining and loss of cytochrome c. (G) Addition of the PC precursor CDP-choline to the media during OGD with D609 had little effect on cell death. Most cells were PI-positive and had lost cytochrome c. A few cells that still had cytochrome c showed more diffuse staining, indicative of release in to the cytosol.
When glucose or serum was added back to the OGD buffer, cytotoxicity of D609 was almost completely prevented (Fig. 5B). Confocal images were obtained to assess the effects of these treatments on mitochondrial cytochrome c. PC12 cells were exposed for 4-h to D609 with the various components added to the OGD buffer. When serum was incorporated into the media (OGD conditions but with serum, Fig. 9D), only a few cells stained for PI, and cytochrome c showed mainly punctate peri-nuclear staining. With further addition of glucose (hypoxic conditions, with serum and glucose, Fig. 9E), cells appeared similar to controls (Fig. 9A). When 1 mM PC was added to the media during OGD with D609 (Fig. 9F), cells were rescued from the cytotoxic effects of D609 as evidenced by punctate cytochrome c staining and lack of PI staining, but a few cells still showed PI staining and loss of cytochrome c. Addition of 1 mM CDP-choline to the media during OGD with D609 (Fig. 9G) had little effect on cell death. Most cells were PI-positive and had lost cytochrome c. A few cells that stained for cytochrome c showed more diffuse staining, indicative of cytochrome c release into the cytosol.
D609 triggered phosphatidylserine (PS) externalization
PC12 cells were incubated with the PS binding protein Annexin V-PE and analyzed by flow cytometry. The histogram of the Annexin V-PE signal indicated that 24% of control cells stained for PS (Fig. 10A). In control cells, trypan blue staining showed 92% viability (Fig. 1), whereas Annexin V binding showed 24% of cells were positive (Fig. 10A). This difference may be due to the different parameters detected by these methods. Trypan blue is taken up by cells that have become permeable and are presumed to be no longer viable. Annexin V binding indicates migration of PS to the outer leaflet of the phospholipid bilayer and does not differentiate between cells that are dead vs cells that are undergoing apoptosis but would still be viable by trypan blue staining.
FIGURE 10. Flow cytometric analysis: D609 facilitated apoptosis PC12 cells after OGD as revealed by PS externalization/Annexin V binding (n=4).
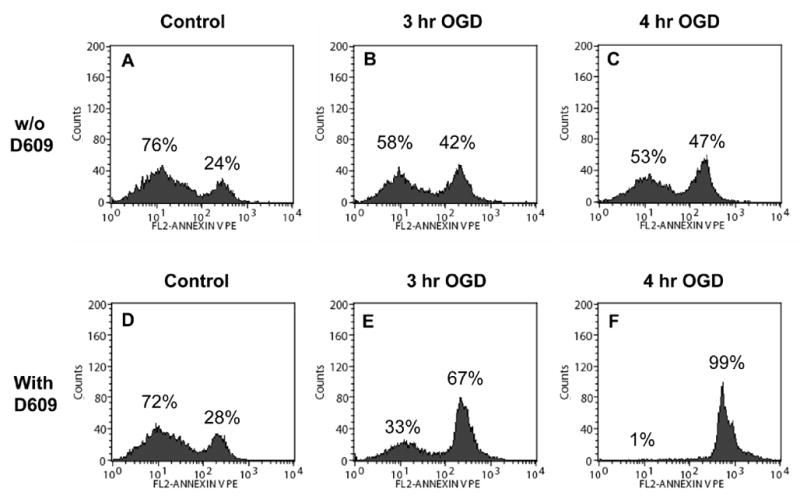

Representative profiles have been shown. (A): The histogram of the Annexin V-PE signal indicated that 24% of control cells stained for PS. PC12 cells exposed to OGD for 3-h (B) and 4-h (C) showed in a moderate but significant increase in the number of Annexin V-PE positive cells. (D): Control PC12 cells exposed to 100 μM D609 for 4-h did not show any change in the number of Annexin V-PE positive cells. PC12 cells exposed to 100 μM D609 during OGD showed a significant increase in Annexin V-PE positive cells after 3-h OGD (E) and virtually all cells were Annexin V-PE positive after 4-h OGD (F). (G): CDP-choline (1 mM) resulted in a small but significant (p<0.05 compared to 4-h OGD with D609) decrease in the number of Annexin V-PE positive cells. (H): Inclusion of 1 mM PC resulted in a significant decrease (p<0.01 compared to 4-h OGD with D609) in the number of Annexin V-PE positive cells, a reduction similar to that observed by inclusion of glucose (I). Inclusion of serum (J) or glucose + serum (K) resulted in greatest reduction, near to control values, in the number of Annexin V-PE positive cells.
PC12 cells exposed to OGD for 3-h (Fig. 10B) and 4-h (Fig. 10C) showed a moderate but significant increase in the number of Annexin V-PE positive cells. Exposure of control PC12 cells for 4-h to D609 did not result in any change in the number of Annexin V-PE positive cells (Fig. 10D). However, when PC12 cells were exposed to D609 during OGD, there was a significant increase in Annexin V-PE positive cells after 3-h OGD (Fig. 10E) and virtually all cells were Annexin V-PE positive after 4-h OGD (Fig. 10F). The effects of various additions to the OGD media on Annexin V-PE staining were assessed in PC12 cells subjected to 4-h OGD in the presence of D609. CDP-choline (1 mM) resulted in a slight but significant (p<0.05) decrease in the number of Annexin V-PE positive cells (Fig. 10G). Inclusion of 1 mM PC resulted in a significant decrease in the number of Annexin V-PE positive cells (Fig. 10H), a reduction similar to that observed by inclusion of glucose (Fig. 10I). Inclusion of serum (Fig. 10J) or glucose + serum (Fig. 10K) resulted in the greatest reduction, near to control values, in the number of Annexin V-PE positive cells.
D609 caused increased [Ca2+]i in OGD-exposed PC12 cells
[Ca2+]i concentrations in OGD-treated PC12 cells were determined using the fluorescent Ca2+ indicator fura-2 AM (Lenart et al., 2004). OGD for 3-h or 4-h did not result in an increase in [Ca2+]i (Fig. 11). However, in the presence of D609 during OGD, [Ca2+]i levels in PC12 cells were significantly increased after 3-h (2.7 fold) and 4-h (7-fold) OGD. Exposure of control cells (no OGD) to D609 for 4-h did not cause increased [Ca2+]i. Addition of 1 mM PC to the media during 4-h OGD in the presence of D609 significantly attenuated (by 37%) the increase in [Ca2+]i but did not bring it to control levels (Fig. 11).
FIGURE 11. D609 increased [Ca2+]i of PC12 cells after OGD.

[Ca2+]i concentrations in PC12 cells after OGD were determined using the fluorescent Ca2+ indicator fura-2 AM as described in the “Experimental” section. 3-h and 4-h OGD did not result in increased [Ca2+]i. 3-h and 4-h OGD in presence of D609 increased the [Ca2+]i significantly (** p<0.01 compared to 3-h and 4-h OGD without D609, respectively, and compared to control). There was no increase in [Ca2+]i in control PC12 cells (not subjected to OGD) exposed to D609 for 4-h. Exogenous PC significantly (# p<0.05 compared to 4-h OGD with D609) attenuated the increase in [Ca2+]i (by 37%) during 4-h OGD in PC12 cells treated with D609, but [Ca2+]i was still significantly elevated compared to 4-h OGD without D609 (p<0.01, n=4).
DISCUSSION
OGD alters lipid composition in PC12 cells
In this paper, we analyzed alterations in lipid composition in PC12 cells subjected to OGD and discovered significant reductions in the levels of PC and SM (Figs. 2A, 2B). Ceramide levels were increased after OGD (Fig. 2B), a finding that correlates with the reduction in SM levels. The reduction in PC levels could be attributable in part to increased PC-PLC and PLD activities and PLD2 expression (Fig. 3A) and a reduction in CCTα expression (Fig. 4A) and CCT activity in OGD-treated cells. The reduction of SM levels and increase in ceramide levels could be due to the increased N-SMase activity in OGD-treated cells. While A-SMase in PC12 cells showed higher activity than N-SMase, its activity was not altered by OGD. It may be also noted that A-SMase has an acidic pH optimum for which the assay is optimized (pH 5.0), and thus the assay probably does not reflect the relative intracellular activity of the neutral and acidic forms. These results are consistent with previous studies that implicated predominantly N-SMase in SM hydrolysis and subsequent ceramide generation in PC12 cells subjected to hypoxia (Yoshimura et al., 1998, 1999).
OGD increased PC loss by differentially affecting PC-PLC, PLD and CCT
Disruption of PC homeostasis has been demonstrated by us in focal cerebral ischemia (Adibhatla et al., 2006), which resulted from a combination of increase in phospholipases (PC-PLC, PLD, and PLA2) and a decrease in activity and protein expression of CCTα, the rate-limiting enzyme in PC synthesis. We found that OGD of PC12 cells triggered an increase in PC-PLC and PLD activities and PLD2 expression, as well as a reduction in CCT activity. While increased hydrolysis by PC-PLC and PLD may be the primary factors responsible for the reduction in PC levels during OGD, an inability to synthesize PC may also contribute to the decline in PC levels. A reduction in CCT activity has also been observed in HL-1 cardiomyocytes following hypoxia and glucose deprivation (Sarri et al., 2006). In these studies, we did not detect any change in expression of cPLA2, iPLA2 or sPLA2 IIA, or increase in PLA2 activity, suggesting that PLA2s did not significantly contribute to PC loss in PC12 cells subjected to OGD.
Role of PA in OGD of PC12 cells
PLD hydrolyzes PC to yield choline and phosphatidic acid. Phosphatidic acid may act directly as a signaling molecule or be further converted to DAG and lyso-phosphatidic acid. However, the role of PLD in pro-apoptotic or anti-apoptotic signaling is not well understood (Nozawa, 2002, Klein, 2005). Since there is no pharmacologic PLD inhibitor, to assess the role of PLD in cell death during OGD, PC12 cells were exposed to n-butanol to block the formation of phosphatidic acid via the transphosphatidylation reaction of PLD (McDermott et al., 2004). This reaction blocks formation of phosphatidic acid but does not affect the PLD activity (Klein, 2005) or prevent PC hydrolysis by PLD. The increase in cell death observed in OGD-treated cells incubated with 0.3% n-butanol indicated that formation of phosphatidic acid offered some protection against cell death induced by OGD (Yamakawa et al., 2000). These results are consistent with the neuroprotective role of PLD in PC12 cells that was observed in other studies (Lee et al., 2000, Kim et al., 2003).
D609 exacerbated cell death during OGD
We hypothesized that treating PC12 cells subjected to OGD with the PC-PLC inhibitor D609 would attenuate PC loss and OGD-mediated cell death. Instead, D609 enhanced OGD-mediated PC loss (Fig. 6A) and dramatically increased cell death (Figs. 5A, 5B). To the best of our knowledge this is the first report showing that D609 exacerbates OGD induced cell death in PC12 cells. In these studies, we used D609 at 100 μM, a concentration near the IC50 of 94 μM (Schutze et al., 1992); lower concentrations (1 and 10 μM) had no significant effect on cell viability. These results are in contrast to previous reports that D609 protected both cortical neurons and a hippocampal nerve cell line against glutamate toxicity (Li et al., 1998), hypothalamic neurons against apoptosis induced by TNF-α (Sortino et al., 1999), and synaptosomes against amyloid β-peptide induced oxidative stress (Perluigi et al., 2006). In these or other cases, D609 is believed to attenuate cell death by inhibiting PC-PLC (Li et al., 1998) and preventing stimulation of A-SMase (Sortino et al., 1999), or by acting as an antioxidant (Perluigi et al., 2006).
D609 increased ceramide levels during OGD
Conversely, D609 has also been shown to induce apoptosis in U937 human monocytic leukemia cells, either by itself or in conjunction with TNF-α (Porn-Ares et al., 1997), and in neuronal stem cells (Wang et al., 2006). It is believed that D609 triggers apoptosis in these cell types either by stimulating N-SMase (Porn-Ares et al., 1997), by inhibiting SM synthase (Luberto and Hannun, 1998, Meng et al., 2004), by stimulating de novo ceramide synthesis (Perry and Ridgway, 2004), or inhibiting PC-PLC and depressing the levels of DAG (Luberto and Hannun, 1998, Perry and Ridgway, 2004). Stimulation of N-SMase or de novo ceramide synthesis by D609 would both lead to enhanced ceramide generation. Inhibition of SM synthase would prevent incorporation of ceramide into SM, which would also lead to increased ceramide levels. Ceramide has been found to act as a potent apoptotic factor in a number of cell types, including neurons and PC12 cells (Hartfield et al., 1997, Yoshimura et al., 1998, Darios et al., 2003). N-SMase activity increased in PC12 cells subjected to 4-h OGD; however, D609 treatment did not further increase N-SMase activity. D609 reduced the activity A-SMase by 56%, consistent with inhibition of PC-PLC and reduction in DAG levels (Fig. 6D), since DAG stimulates A-SMase (Schutze et al., 1992). Therefore, the increase in ceramide levels observed in D609-treated cells subjected to OGD may be due either to inhibition of SM synthase or stimulation of de novo ceramide synthesis or both.
D609 increased PC loss during OGD
Lipid analysis revealed that D609 accelerated PC loss in OGD-treated cells compared to cells subjected to OGD alone. Other studies have also observed that D609 increased PC hydrolysis in UMR-106 osteoblastic osteosarcoma cells, which may have been due to a compensatory increase in PLD activity when PC-PLC was inhibited, or that D609 directly enhanced PLD activity, or both (Singh et al., 2000, Ramoni et al., 2004). In our studies, we did not observe an increase in PLD2 expression or PLD activity in cells subjected to OGD and D609 treatment compared to OGD alone. However, D609 induced a large increase in [Ca2+]i during OGD (Fig. 11), which could stimulate PC hydrolysis by activating endogenous Ca2+-dependent phospholipases. This could also explain the large increase in FFA during OGD with D609. Since there was no accumulation of DAG, any DAG formed by phospholipid hydrolysis must be further hydrolyzed through activation of DAG lipases to release FFA (Separovic et al., 1997).
D609 might be inhibiting CPT, the ultimate step in PC synthesis
D609 also inhibits PC synthesis (Ng et al., 2004), which could also contribute to the accelerated PC loss during OGD. D609 did not inhibit activity of purified CCT (Ng et al., 2004). Since addition of CDP-choline and DAG individually or together had no effect on D609-induced cell death, whereas exogenous PC was able to significantly rescue PC12 cells (Fig. 7B), in all likelihood D609 inhibits the final step of PC synthesis catalyzed by CDP-choline:DAG cholinephosphotransferase (CPT) (Anthony et al., 1999, Wright et al., 2001, Ng et al., 2004, 2004). Based on our observations and the literature, a tentative scheme showing the actions of D609 has been presented (Scheme 1).
Scheme 1.

D609 inhibits PC (Ng et al., 2004) and SM (Luberto and Hannun, 1998) synthesis as well as PC-PLC (Amtmann, 1996). These additional effects must be taken into account in interpretation of results obtained with D609 and limit its utility as a pharmacological tool to characterize actions of PC-PLC and supports the notion that D609 is a non-specific PC-PLC inhibitor. PC-PLC hydrolyzes PC to form DAG and phosphocholine. DAG stimulates A-SMase and release of ceramide from SM. SM synthase transfers the phosphocholine head group from PC to ceramide to form SM and DAG. CPT synthesizes PC from CDP-choline and DAG. Since addition of CDP-choline + DAG also did not rescue the cells, in all likelihood D609 inhibits CPT (Anthony et al., 1999, Wright et al., 2001, Ng et al., 2004, 2004). PC: phosphatidylcholine; SM: sphingomyelin; A-SMase: acidic sphingomyelinase; PC-PLC: PC-phospholipase C; DAG: 1,2-diacylglycerol; CDP-C: CDP-choline; CPT: CDP-choline:DAG cholinephosphotransferase. In summary, D609 probably inhibits CPT and SM synthase as well as PC-PLC. The abrupt loss of cell viability also suggests that D609 might be causing loss of ATP followed by mitochondrial dysfunction (loss of cardiolipin) and increase in [Ca2+]i. These probable actions of D609 have been presented in the composite scheme.
D609 causes loss of cytochrome C, PARP cleavage, PS externalization, increase in [Ca2+]i and apoptosis in PC12 cells
Our data strongly suggest that D609 causes mitochondrial dysfunction during OGD as indicated by the near complete loss of cytochrome c after 4-h OGD in PC12 cells treated with D609 (Figs. 8, 9C). These findings prompted us to investigate markers of apoptotic cell death such as PARP cleavage and PS externalization. The increase in [Ca2+]i (Fig. 11) paralleled the loss of cytochrome c, suggesting mitochondria as the source. Once in the cytosol, cytochrome c can associate with Apaf-1 (apoptotic protease-activating factor 1) to generate the apoptosome, which in turn activates caspases (Ferrer and Planas, 2003). These activated caspases can in turn cleave a variety of cellular proteins, including PARP, a nuclear protein involved in DNA repair, among other processes (Ferrer and Planas, 2003). Cytochrome c released into the cytosol also functions as a peroxidase for PS. Oxidized PS then translocates to the outer leaflet of the lipid bilayer (Wu et al., 2006). Our studies also demonstrated PARP cleavage (Fig. 8) and Annexin V-PE binding (Fig. 10F), a marker for PS externalization.
Oxidation of D609
D609 contains a thiol group that readily oxidizes in aqueous media, forming a disulfide (Bai et al., 2004). To determine whether oxidation of D609 could be a factor in its effects on cell viability during OGD, D609 was preincubated in OGD media for 24-h prior to subjecting PC12 cells to OGD. For comparison, D609 was added to the media immediately prior to induction of OGD. No difference in cell viability was observed after 4-h OGD whether D609 was added at the start of OGD or preincubated in OGD media for 24-h. However, the disulfide of D609 is a substrate for glutathione reductase and can be reduced intracellularly to regenerate D609 (Sultana et al., 2004). Thus, even if D609 is completely oxidized in the media, intracellularly it should be present to some extent as the thiol.
Inhibition of PC synthesis induces cell death
Evidence that inhibition of PC synthesis alone can trigger apoptosis was demonstrated in a cell line with a defect in CCT (Cui and Houweling, 2002). Farnesol inhibits PC synthesis at the CPT step and induces apoptosis in cell culture. Farnesol induced apoptosis could be specifically rescued by exogenous PC (Anthony et al., 1999, Wright et al., 2001). Similarly, choline deficiency in PC12 cells resulted in loss of PC and SM, generation of ceramide, and induction of apoptosis (Yen et al., 1999). In our studies, the significant increase in PC hydrolysis in OGD-treated PC12 cells subjected to 4-h OGD with D609 correlates with the dramatic reduction in cell viability observed at this time. Exogenous PC restored PC levels and significantly attenuated D609 induced cell death during OGD, indicating that loss of cellular PC may be a contributing factor in cell death. It has been hypothesized (Cui and Houweling, 2002) that depletion of cellular PC could constitute a death signal by 1) altering subcellular structures, thereby inducing nuclear condensation or mitochondrial swelling, 2) changing the micro domains of membrane-bound signaling proteins and activating death receptors, or 3) failure to produce anti-apoptotic signals, resulting in cell death by default. Exogenous PC might attenuate these effects by restoring membrane PC levels, thereby attenuating mitochondrial dysfunction, cytochrome c release (Fig. 9), increase in [Ca2+]i (Fig. 11), FFA release (Fig. 6E) and cell death (Fig. 7B).
The abrupt loss of cell viability after 4 hr OGD with D609 treatment might be the result of energy loss, mitochondrial dysfunction (shown by loss of cytochrome C) and subsequent increase in [Ca2+]i. Replenishing either glucose or sera in the media prevented cell death induced by D609 in PC12 cells subjected to hypoxic conditions (Fig. 5B), and attenuated lipid alterations induced by D609 during OGD. The presence of glucose or sera might have prevented loss of ATP, subsequent rise in [Ca2+]i and mitochondrial dysfunction during OGD in the presence of D609 as evidenced by preservation of mitochondrial cytochrome c (Fig. 9).
As an intracellular second messenger that activates protein kinase C, DAG promotes cell survival (Meng et al., 2004, Wang et al., 2006). Addition of PC during OGD and treatment with D609 also restored DAG to control levels. Even though D609 inhibited PC-PLC activity, this inhibition was not complete (56% inhibition), and some hydrolysis of PC to DAG could be driven by the presence of additional substrate. However, exogenous DAG did not rescue PC12 cells from D609-induced cell death during OGD, indicating DAG formation from exogenous PC may not be a significant factor in increased cell viability with added PC. Exogenous PC also restored SM levels. PC serves as the phosphocholine donor to ceramide to form SM. Even though D609 inhibits SM synthase, similar to effects on PC-PLC the inhibition may not be complete. The presence of added PC substrate may drive SM synthesis, decreasing ceramide levels (and increasing DAG, Scheme 1) and ceramide-induced mitochondrial dysfunction. This is consistent with the observation that exogenous PC also attenuated cytochrome c release, Annexin V-PE binding and the increase in [Ca2+]i and release of FFA (including arachidonic acid). However, the mechanisms by which exogenous PC rescues PC12 during OGD in presence of D609 need further investigation.
Acknowledgments
This work was supported by grants from NIH/NINDS (NS42008), American Heart Association Greater Midwest Affiliate Grant-in-Aid (0655757Z), UW-School of Medicine and Public Health and UW-Graduate school (to RMA), and laboratory resources provided by William S. Middleton VA Hospital. The authors would like to thank the laboratory of Dr. Dandan Sun, especially Doug Kintner for his assistance in the confocal microscopy and Ca2+ measurements. We would like to acknowledge Drs. Deepika Rajesh, M Kunni, Haviryaji Kalluri, Jill Schartner, Kathleen Schell, Samuel Adediran (Integrated Biological Sciences-Summer Research Program; UW-Madison) for their help with flow cytometry studies and helpful discussions, and Dr. Dempsey for all the support and encouragement throughout these studies.
Abbreviations
- CCT
CTP: phosphocholine cytidylyltransferase
- CPT
CDP-choline-1,2 diacylglycerol phosphocholine transferase
- D609
tricyclodecan-9-yl potassium xanthate
- FFA
Free fatty acids
- PC
phosphatidylcholine
- PC-PLC
phosphatidylcholine-phospholipase C
- PLD
phospholipase D
- SM
Sphingomyelin
- Smase
sphingomyelinase
Footnotes
Publisher's Disclaimer: This is a PDF file of an unedited manuscript that has been accepted for publication. As a service to our customers we are providing this early version of the manuscript. The manuscript will undergo copyediting, typesetting, and review of the resulting proof before it is published in its final citable form. Please note that during the production process errors may be discovered which could affect the content, and all legal disclaimers that apply to the journal pertain.
References
- Adibhatla RM, Hatcher JF. Phospholipase A2, reactive oxygen species, and lipid peroxidation in cerebral ischemia. Free Radic Biol Med. 2006;40:376–387. doi: 10.1016/j.freeradbiomed.2005.08.044. [DOI] [PubMed] [Google Scholar]
- Adibhatla RM, Hatcher JF. Secretory phospholipaseA2 IIA is up-regulated by TNF-α and IL-1α/β after transient focal cerebral ischemia in rat. Brain Res. 2007;1134:199–205. doi: 10.1016/j.brainres.2006.11.080. [DOI] [PMC free article] [PubMed] [Google Scholar] [Retracted]
- Adibhatla RM, Hatcher JF, Dempsey RJ. Effects of citicoline on phospholipid and glutathione levels in transient cerebral ischemia. Stroke. 2001;32:2376–2381. doi: 10.1161/hs1001.096010. [DOI] [PubMed] [Google Scholar]
- Adibhatla RM, Hatcher JF, Dempsey RJ. Cytidine-5′-diphosphocholine (CDP-choline) affects CTP:phosphocholine cytidylyltransferase and lyso-phosphatidylcholine after transient brain ischemia. J Neurosci Res. 2004;76:390–396. doi: 10.1002/jnr.20078. [DOI] [PubMed] [Google Scholar]
- Adibhatla RM, Hatcher JF, Larsen EC, Chen X, Sun D, Tsao F. CDP-choline significantly restores the phosphatidylcholine levels by differentially affecting phospholipase A2 and CTP-phosphocholine cytidylyltransferase after stroke. J Biol Chem. 2006;281:6718–6725. doi: 10.1074/jbc.M512112200. [DOI] [PubMed] [Google Scholar]
- Amtmann E. The antiviral, antitumoural xanthate D609 is a competitive inhibitor of phosphatidylcholine-specific phospholipase C. Drugs Exp Clin Res. 1996;22:287–294. [PubMed] [Google Scholar]
- Anthony ML, Zhao M, Brindle KM. Inhibition of phosphatidylcholine biosynthesis following induction of apoptosis in HL-60 cells. J Biol Chem. 1999;274:19686–19692. doi: 10.1074/jbc.274.28.19686. [DOI] [PubMed] [Google Scholar]
- Bai A, Meier GP, Wang Y, Luberto C, Hannun YA, Zhou D. Prodrug modification increases potassium tricyclo[5.2.1.02,6]-decan-8-yl dithiocarbonate (D609) chemical stability and cytotoxicity against U937 leukemia cells. J Pharmacol Exp Ther. 2004;309:1051–1059. doi: 10.1124/jpet.103.064600. [DOI] [PubMed] [Google Scholar]
- Cui Z, Houweling M. Phosphatidylcholine and cell death. Biochim Biophys Acta. 2002;1585:87–96. doi: 10.1016/s1388-1981(02)00328-1. [DOI] [PubMed] [Google Scholar]
- Darios F, Lambeng N, Troadec J-D, Michel PP, Ruberg M. Ceramide increases mitochondrial free calcium levels via caspase 8 and Bid: role in initiation of cell death. J Neurochem. 2003;84:643–654. doi: 10.1046/j.1471-4159.2003.01590.x. [DOI] [PubMed] [Google Scholar]
- Ferrer I, Planas AM. Signaling of cell death and cell survival following focal cerebral ischemia: life and death struggle in the penumbra. J Neuropathol Exp Neurol. 2003;62:329–339. doi: 10.1093/jnen/62.4.329. [DOI] [PubMed] [Google Scholar]
- Goni FM, Alonso A. Sphingomyelinases: enzymology and membrane activity. FEBS Lett. 2002;531:38–46. doi: 10.1016/s0014-5793(02)03482-8. [DOI] [PubMed] [Google Scholar]
- Grynkiewicz G, Poenie M, Tsien RY. A new generation of Ca2+ indicators with greatly improved fluorescence properties. J Biol Chem. 1985;260:3440–3450. [PubMed] [Google Scholar]
- Hannun YA, Luberto C. Ceramide in the eukaryotic stress response. Trends Cell Biol. 2000;10:73–80. doi: 10.1016/s0962-8924(99)01694-3. [DOI] [PubMed] [Google Scholar]
- Hartfield PJ, Mayne GC, Murray AW. Ceramide induces apoptosis in PC12 cells. FEBS Lett. 1997;401:148–152. doi: 10.1016/s0014-5793(96)01460-3. [DOI] [PubMed] [Google Scholar]
- Hillion JA, Takahashi K, Maric D, Ruetzler CA, Barker JL, Hallenbeck JM. Development of an ischemic tolerance model in a PC12 cell line. J Cereb Blood Flow Metab. 2005;25:154–162. doi: 10.1038/sj.jcbfm.9600003. [DOI] [PMC free article] [PubMed] [Google Scholar]
- Hofmann K, Tomiuk S, Wolff G, Stoffel W. Cloning and characterization of the mammalian brain-specific, Mg2+-dependent neutral sphingomyelinase. Proc Natl Acad Sci USA. 2000;97:5895–5900. doi: 10.1073/pnas.97.11.5895. [DOI] [PMC free article] [PubMed] [Google Scholar]
- Jackowski S, Fagone P. CTP:phosphocholine cytidylyltransferase: Paving the way from gene to membrane. J Biol Chem. 2005;280:853–856. doi: 10.1074/jbc.R400031200. [DOI] [PubMed] [Google Scholar]
- Karten B, Hayashi H, Campenot RB, Vance DE, Vance JE. Neuronal models for studying lipid metabolism and transport. Methods. 2005;36:117–128. doi: 10.1016/j.ymeth.2004.11.004. [DOI] [PubMed] [Google Scholar]
- Kim KO, Lee KH, Kim YH, Park SK, Han JS. Anti-apoptotic role of phospholipase D isozymes in the glutamate-induced cell death. Exp Mol Med. 2003;35:38–45. doi: 10.1038/emm.2003.6. [DOI] [PubMed] [Google Scholar]
- Klein J. Functions and pathophysiological roles of phospholipase D in the brain. J Neurochem. 2005;94:1473–1487. doi: 10.1111/j.1471-4159.2005.03315.x. [DOI] [PubMed] [Google Scholar]
- Lagace TA, Miller JR, Ridgway ND. Caspase processing and nuclear export of CTP:phosphocholine cytidylyltransferase α during farnesol-induced apoptosis. Mol Cell Biol. 2002;22:4851–4862. doi: 10.1128/MCB.22.13.4851-4862.2002. [DOI] [PMC free article] [PubMed] [Google Scholar]
- Lee SD, Lee BD, Han JM, Kim JH, Kim Y, Suh P-G, Ryu SH. Phospholipase D2 activity suppresses hydrogen peroxide-induced apoptosis in PC12 cells. J Neurochem. 2000;75:1053–1059. doi: 10.1046/j.1471-4159.2000.0751053.x. [DOI] [PubMed] [Google Scholar]
- Lenart B, Kintner DB, Shull GE, Sun D. Na-K-Cl cotransporter-mediated intracellular Na+ accumulation affects Ca2+ signaling in astrocytes in an in vitro ischemic model. J Neurosci. 2004;24:9585–9597. doi: 10.1523/JNEUROSCI.2569-04.2004. [DOI] [PMC free article] [PubMed] [Google Scholar]
- Li YH, Maher P, Schubert D. Phosphatidylcholine-specific phospholipase C regulates glutamate-induced nerve cell death. Proc Natl Acad Sci USA. 1998;95:7748–7753. doi: 10.1073/pnas.95.13.7748. [DOI] [PMC free article] [PubMed] [Google Scholar]
- Luberto C, Hannun YA. Sphingomyelin synthase, a potential regulator of intracellular levels of ceramide and diacylglycerol during SV40 transformation. Does sphingomyelin synthase account for the putative phosphatidylcholine-specific phospholipase c? J Biol Chem. 1998;273:14550–14559. doi: 10.1074/jbc.273.23.14550. [DOI] [PubMed] [Google Scholar]
- Mallampalli RK, Ryan AJ, Salome RG, Jackowski S. TNF-α inhibits expression of CTP: phosphocholine cytidylyltransferase. J Biol Chem. 2000;275:9699–9708. doi: 10.1074/jbc.275.13.9699. [DOI] [PubMed] [Google Scholar]
- McDermott M, Wakelam MJ, Morris AJ. Phospholipase D. Biochem Cell Biol. 2004;82:225–253. doi: 10.1139/o03-079. [DOI] [PubMed] [Google Scholar]
- Meng A, Luberto C, Meier P, Bai A, Yang X, Hannun YA, Zhou D. Sphingomyelin synthase as a potential target for D609-induced apoptosis in U937 human monocytic leukemia cells. Exp Cell Res. 2004;292:385–392. doi: 10.1016/j.yexcr.2003.10.001. [DOI] [PubMed] [Google Scholar]
- Moses GS, Jensen MD, Lue LF, Walker DG, Sun AY, Simonyi A, Sun GY. Secretory PLA2-IIA: A new inflammatory factor for Alzheimer’s disease. J Neuroinflammation. 2006;3 doi: 10.1186/1742-2094-1183-1128. [DOI] [PMC free article] [PubMed] [Google Scholar]
- Ng MNP, Kitos TE, Cornell RB. Contribution of lipid second messengers to the regulation of phosphatidylcholine synthesis during cell cycle re-entry. Biochim Biophys Acta. 2004;1686:85–99. doi: 10.1016/j.bbalip.2004.09.001. [DOI] [PubMed] [Google Scholar]
- Nozawa Y. Roles of phospholipase D in apoptosis and pro-survival. Biochim Biophys Acta. 2002;1585:77–86. doi: 10.1016/s1388-1981(02)00327-x. [DOI] [PubMed] [Google Scholar]
- Ohtani R, Tomimoto H, Kondo T, Wakita H, Akiguchi I, Shibasaki H, Okazaki T. Upregulation of ceramide and its regulating mechanism in a rat model of chronic cerebral ischemia. Brain Res. 2004;1023:31–40. doi: 10.1016/j.brainres.2004.07.024. [DOI] [PubMed] [Google Scholar]
- Perluigi M, Joshi G, Sultana R, Calabrese V, De Marco C, Coccia R, Butterfield DA. In vivo protection by the xanthate tricyclodecan-9-yl-xanthogenate against amyloid β-peptide (1–42)-induced oxidative stress. Neuroscience. 2006;138:1161–1170. doi: 10.1016/j.neuroscience.2005.12.004. [DOI] [PubMed] [Google Scholar]
- Perry RJ, Ridgway ND. The role of de novo ceramide synthesis in the mechanism of action of the tricyclic xanthate D609. J Lipid Res. 2004;45:164–173. doi: 10.1194/jlr.M300300-JLR200. [DOI] [PubMed] [Google Scholar]
- Porn-Ares MI, Chow SC, Slotte JP, Orrenius S. Induction of apoptosis and potentiation of TNF-and Fas-mediated apoptosis in U937 cells by the xanthogenate compound D609. Exp Cell Res. 1997;235:48–54. doi: 10.1006/excr.1997.3641. [DOI] [PubMed] [Google Scholar]
- Ramoni C, Spadaro F, Barletta B, Dupuis ML, Podo F. Phosphatidylcholine-specific phospholipase C in mitogen-stimulated fibroblasts. Exp Cell Res. 2004;299:370–382. doi: 10.1016/j.yexcr.2004.05.037. [DOI] [PubMed] [Google Scholar]
- Rao AM, Hatcher JF, Dempsey RJ. Lipid alterations in transient forebrain ischemia: possible new mechanisms of CDP-choline neuroprotection. J Neurochem. 2000;75:2528–2535. doi: 10.1046/j.1471-4159.2000.0752528.x. [DOI] [PubMed] [Google Scholar]
- Reimann-Philipp U, Ovase R, Weigel PH, Grammas P. Mechanisms of cell death in primary cortical neurons and PC12 cells. J Neurosci Res. 2001;64:654–660. doi: 10.1002/jnr.1119. [DOI] [PubMed] [Google Scholar]
- Sarri E, Garcia-Dorado D, Abellan A, Soler-Soler J. Effect of hypoxia, glucose deprivation, and acidosis on phosphatidylcholine synthesis in HL-1 cardiomyocytes. CTP:phosphocholine cytidylyltransferase activity correlates with sarcolemmal disruption. Biochem J. 2006;394:325–334. doi: 10.1042/BJ20050834. [DOI] [PMC free article] [PubMed] [Google Scholar]
- Schutze S, Potthoff K, Machleidt T, Berkovic D, Wiegmann K, Kronke M. TNF activates NF-κB by phosphatidylcholine-specific phospholipase C-induced ‘acidic’ sphingomyelin breakdown. Cell. 1992;71:765–776. doi: 10.1016/0092-8674(92)90553-o. [DOI] [PubMed] [Google Scholar]
- Separovic D, Kester M, Haxhiu MA, Ernsberger P. Activation of phosphatidylcholine-selective phospholipase C by I1-imidazoline receptors in PC12 cells and rostral ventrolateral medulla. Brain Res. 1997;749:335–339. doi: 10.1016/S0006-8993(96)01372-8. [DOI] [PubMed] [Google Scholar]
- Singh ATK, Radeff JM, Kunnel JG, Stern PH. Phosphatidylcholine-specific phospholipase C inhibitor, tricyclodecan-9-yl xanthogenate (D609), increases phospholipase D-mediated phosphatidylcholine hydrolysis in UMR-106 osteoblastic osteosarcoma cells. Biochim Biophys Acta. 2000;1487:201–208. doi: 10.1016/s1388-1981(00)00096-2. [DOI] [PubMed] [Google Scholar]
- Soeda S, Tsuji Y, Ochiai T, Mishima K-i, Iwasaki K, Fujiwara M, Yokomatsu T, Murano T, Shibuya S, Shimeno H. Inhibition of sphingomyelinase activity helps to prevent neuron death caused by ischemic stress. Neurochem Int. 2004;45:619–626. doi: 10.1016/j.neuint.2004.04.001. [DOI] [PubMed] [Google Scholar]
- Soldani C, Scovassi AI. Poly(ADP-ribose) polymerase-1 cleavage during apoptosis: An update. Apoptosis. 2002;7:321–328. doi: 10.1023/a:1016119328968. [DOI] [PubMed] [Google Scholar]
- Sortino MA, Condorelli F, Vancheri C, Canonico PL. Tumor necrosis factor-α induces apoptosis in immortalized hypothalamic neurons: involvement of ceramide-generating pathways. Endocrinology. 1999;140:4841–4849. doi: 10.1210/endo.140.10.7062. [DOI] [PubMed] [Google Scholar]
- Sultana R, Newman S, Mohmmad-Abdul H, Keller JN, Butterfield DA. Protective effect of the xanthate, D609, on Alzheimer’s amyloid beta-peptide (1–42)-induced oxidative stress in primary neuronal cells. Free Rad Res. 2004;38:449–458. doi: 10.1080/1071576042000206478. [DOI] [PubMed] [Google Scholar]
- Sun GY, Xu J, Jensen MD, Simonyi A. PLA2 in the central nervous system: Implications for neurodegenerative diseases. J Lipid Res. 2004;45:205–213. doi: 10.1194/jlr.R300016-JLR200. [DOI] [PubMed] [Google Scholar]
- Sun GY, Xu J, Jensen MD, Yu S, Wood WG, Gonzalez FA, Simonyi A, Sun AY, Weisman GA. Phospholipase A2 in astrocytes: responses to oxidative stress, inflammation, and g protein-coupled receptor agonists. Mol Neurobiol. 2005;31:27–42. doi: 10.1385/MN:31:1-3:027. [DOI] [PubMed] [Google Scholar]
- Tietze F. Enzymic method for quantitative determination of nanogram amounts of total and oxidized glutathione: applications to mammalian blood and other tissues. Anal Biochem. 1969;27:502–522. doi: 10.1016/0003-2697(69)90064-5. [DOI] [PubMed] [Google Scholar]
- Tischler AS, Powers JF, Alroy J. Animal models of pheochromocytoma. Histol Histopathol. 2004;19:883–895. doi: 10.14670/HH-19.883. [DOI] [PubMed] [Google Scholar]
- Wang N, Lv X, Su L, Zhao B, Zhang S, Miao J. D609 blocks cell survival and induces apoptosis in neural stem cells. Bioorg Med Chem Lett. 2006;16:4780–4783. doi: 10.1016/j.bmcl.2006.06.080. [DOI] [PubMed] [Google Scholar]
- Woodcock J. Sphingosine and ceramide signalling in apoptosis. IUBMB Life. 2006;58:462–466. doi: 10.1080/15216540600871118. [DOI] [PubMed] [Google Scholar]
- Wright MM, Henneberry AL, Lagace TA, Ridgway ND, McMaster CR. Uncoupling farnesol-induced apoptosis from its inhibition of phosphatidylcholine synthesis. J Biol Chem. 2001;276:25254–25261. doi: 10.1074/jbc.M011552200. [DOI] [PubMed] [Google Scholar]
- Wright MM, Howe AG, Zaremberg V. Cell membranes and apoptosis: role of cardiolipin, phosphatidylcholine, and anticancer lipid analogues. Biochem Cell Biol. 2004;82:18–26. doi: 10.1139/o03-092. [DOI] [PubMed] [Google Scholar]
- Wu YL, Tibrewal N, Birge RB. Phosphatidylserine recognition by phagocytes: a view to a kill. Trends Cell Biol. 2006;16:189–197. doi: 10.1016/j.tcb.2006.02.003. [DOI] [PubMed] [Google Scholar]
- Yamakawa H, Banno Y, Nakashima S, Sawada M, Yamada J, Yoshimura S, Nishimura Y, Nozawa Y, Sakai N. Increased phospholipase D2 activity during hypoxia-induced death of PC12 cells: its possible anti-apoptotic role. Neuroreport. 2000;11:3647–3650. doi: 10.1097/00001756-200011090-00049. [DOI] [PubMed] [Google Scholar]
- Yen CL, Mar MH, Zeisel SH. Choline deficiency-induced apoptosis in PC12 cells is associated with diminished membrane phosphatidylcholine and sphingomyelin, accumulation of ceramide and diacylglycerol, and activation of a caspase. FASEB J. 1999;13:135–142. [PubMed] [Google Scholar]
- Yoshimura S-i, Banno Y, Nakashima S, Takenaka K, Sakai H, Nishimura Y, Sakai N, Shimizu S, Eguchi Y, Tsujimoto Y, Nozawa Y. Ceramide formation leads to caspase-3 activation during hypoxic PC12 cell death. Inhibitory effects of Bcl-2 on ceramide formation and caspase-3 activation. J Biol Chem. 1998;273:6921–6927. doi: 10.1074/jbc.273.12.6921. [DOI] [PubMed] [Google Scholar]
- Yoshimura S, Banno Y, Nakashima S, Hayashi K, Yamakawa H, Sawada M, Sakai N, Nozawa Y. Inhibition of neutral sphingomyelinase activation and ceramide formation by glutathione in hypoxic PC12 cell death. J Neurochem. 1999;73:675–683. doi: 10.1046/j.1471-4159.1999.0730675.x. [DOI] [PubMed] [Google Scholar]