Abstract
Psychophysical and fMRI studies have indicated that visual processing of global symmetry has distinctive scaling properties, and proceeds more slowly than analysis of contrast, spatial frequency, and texture. We therefore undertook a visual evoked potential (VEP) study to directly compare the dynamics of symmetry and texture processing, and to determine the extent to which they interact.
Stimuli consisted of interchange between structured and random black-and-white checkerboard stimuli. For symmetry, structured stimuli were colored with 2-fold symmetry (horizontal or vertical mirror), 4-fold symmetry (both mirror axes), and 8-fold symmetry (oblique mirror axes added). For texture, structured stimuli were colored according to the “even” isodipole texture (Julesz, Gilbert & Victor, 1978). Thus, all stimuli had the same contrast, and check size, but differed substantially in correlation structure.
To separate components of the VEP related to symmetry and texture from components that could be generated by local luminance and contrast changes, we extracted the odd-harmonic components of the VEP (recorded at Cz-Oz, Cz-O1, Cz-O2, Cz-Pz) elicited by structured-random interchange.
Responses to symmetry were largest for the 8-fold patterns, and progressively smaller for 4-fold, vertical, and horizontal symmetry patterns. 8-fold patterns were therefore used in the remainder of the study. The symmetry response is shifted to larger checks and lower temporal frequencies compared to the response to texture, and its temporal tuning is broader. Processing of symmetry makes use of neural mechanisms with larger receptive fields, and slower, more sustained temporal tuning characteristics than those involved in the analysis of texture.
Sparse stimuli were used to dissociate check size and check density. VEP responses to sparse symmetry stimuli showed that there is no difference between 1st and 2nd order symmetry for densities less than 12.5%. We discuss these findings in relation to local and global visual processes.
Keywords: Symmetry, texture, visual evoked potentials, isodipole, form vision
1. INTRODUCTION
Texture and symmetry are two important aspects of images and objects that are readily analyzed by the visual system (Julesz, 1962; Barlow & Reeves, 1979; Marr & Hildreth, 1980). However, the computational requirements for the extraction of these attributes differ substantially. Much of texture analysis can be accounted for by computations based on analysis of the statistics of the outputs of simple local filters repeated across the visual field (Malik & Perona, 1990; Landy & Bergen, 1991; Simoncelli & Olshausen, 2002). Though direct experimental evidence is lacking, this computational architecture maps readily onto a hardwired, feedforward neural circuitry. In contrast, identification of symmetry can be based on comparison of regions that are quite remote (Tyler, 1999). Moreover, since symmetry can be detected even if the location and orientation of the symmetry axis is not known in advance (Olivers & van der Helm, 1998), the number of possible comparisons that need to be made is very large – in principle, any pair of points in visual space are candidates for being related by a symmetry axis. Thus, the number and lengths of the required connections make a hardwired circuit an unattractive architecture to carry out the requisite computations.
Experimental analysis of visual processing of symmetry and texture supports the notion that the underlying computations are qualitatively different. Psychophysical studies have showed that visual processing of global symmetry has distinctive spatio-temporal characteristics compared with analysis of contrast or spatial frequency (see Tyler, 1996). Functional imaging studies have revealed neural activation specific to symmetry processing in extrastriate visual areas with limited or no topographic mapping of the visual field (Tyler, Baseler, Kontsevich, Likova, Wade & Wandell, 2005). In contrast, processing of contrast and texture activates primary visual cortex, topographically mapped regions in the occipitotemporal stream, and fusiform areas (Beason-Held, Purpura, Krasuski, Maisog, Daly, Mangot, Desmond, Optican, Schapiro and VanMeter, 1998; Beason-Held, Purpura, Krasuski, Desmond, Mangot, Daly, Optican, Rapoport, & VanMeter, 2000).
However, psychophysical and functional imaging methods have limited temporal resolution, and cannot provide direct indications of the extent to which processing of symmetry and texture interact. Motivated by these considerations, we undertook a visual evoked potential analysis of symmetry and texture processing.
To do this, we designed stimuli to facilitate separation of neural mechanisms involved specifically in the analysis of texture or symmetry from those driven merely by local contrast or luminance changes. The differential visual evoked potential (VEP) elicited by stimuli that are matched in these low-level characteristics, but differ either texture and/or symmetry, can then be used as an index of the size and time course of the neural computations specifically sensitive to those image characteristics. This provides for a direct comparison of the neural processing of image statistics underlying texture and symmetry, and how they can affect each other (Norcia, Candy, Pettet, Vildavski and Tyler, 2002). As described below, we found several differences between these processes, as well as evidence of an interaction between them.
2. METHODS
2.1. Subjects
Five subjects (age 19 to 50) with normal or corrected-to-normal visual acuity participated in the present experiment. Two of them were authors and the others were naïve to the purpose of the present study with normal or corrected-to-normal visual acuity. The experiment was undertaken with the informed consent of each subject and appropriate Institutional Review Board protocols.
2.2. Stimulus
Stimuli were presented on a visual display unit (SONY GDM-17SE2) driven by a VSG 2/3 stimulus generator (Cambridge Research Systems) with a resolution of 1024 × 768 pixels at a frame rate of 100 Hz. The display subtended 14.4 × 10.8 deg at a viewing distance of 114 cm. The luminance nonlinearity of the monitor was corrected using a look-up table. The stimuli were 9.4 degrees in width and height and centered on a mean luminance background (40 cd/m2). Check sizes ranged from 1.7 arc min to 35 arc min. Contrast was 1.0.
Stimuli consisted of interchange between structured and random black-and-white checkerboard stimuli of the same check size. Figure 1 shows examples of typical structured stimuli. Symmetry stimuli were colored with 2-fold symmetry (horizontal or vertical mirror), 4-fold symmetry (both mirror axes), and 8-fold symmetry (oblique mirror axes, see Fig. 1(C) and (D)). To create a symmetry stimulus, a maximal region of the array was colored randomly with black and white checks, and then this region was replicated according to the symmetry axes. Texture stimuli (Figure 1 (A) and (B)) were colored by choosing a random first row and first column, and then completing the texture according to the rule for the even isodipole texture (Julesz et al., 1978).
Figure 1.
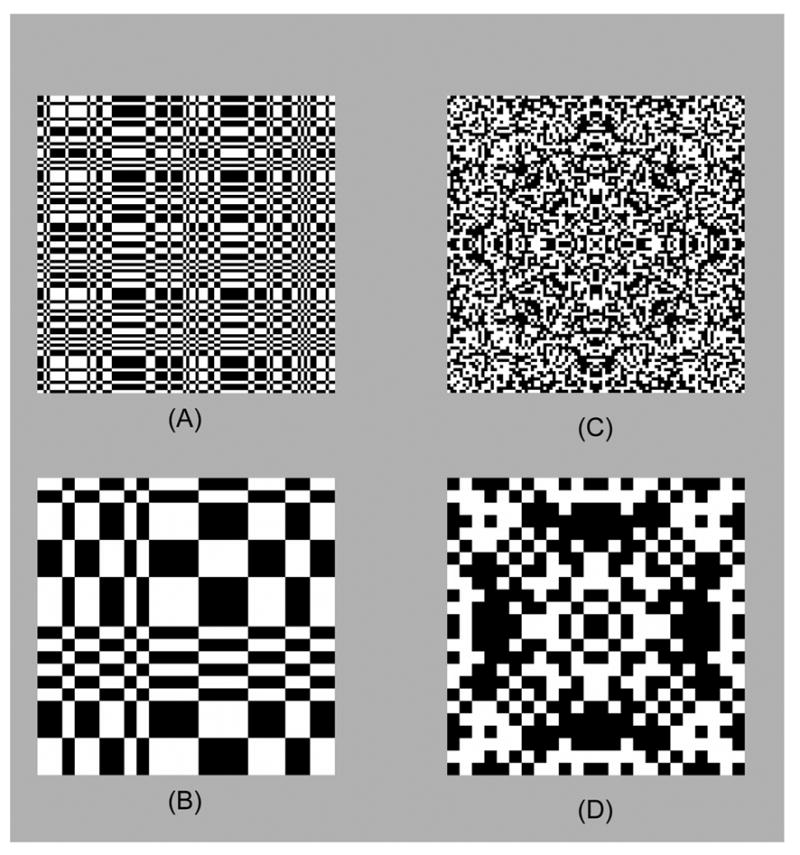
Sample stimuli. A, B: Even isodipole textures (Julesz, Gilbert, Victor, 1978). C, D: Stimuli with eightfold symmetry (horizontal, vertical, and oblique mirror planes). When scaled to the 9.4 deg stimulus size used, check sizes are 6 min (A,C) and 24 min (B,D).
All examples of texture, symmetry, and random stimuli were generated independently, with half of the checks colored black and half white. At each transition, approximately half of the checks changed in contrast, and successive transitions were uncorrelated.
All stimuli had the same contrast and check size, similar power spectra, but different correlation structure. Interchange between structured and random stimuli occurred abruptly, at a range of temporal frequencies described below.
2.3. Procedure
Subjects were seated in a darkened room and instructed to look at the stimuli binocularly and minimize eye movements by looking at a fixation point. Each 36-sec trial consisted of interchange between two kinds of stimuli – e.g., symmetry and random, or texture and random, in an abrupt square-wave fashion at a single temporal frequency. For each set of stimulus parameters, five to eight replicate trials were obtained in randomized blocks in a recording single session lasting up to 60 min. Different examples of each kind of image (random, even isodipole, symmetry) were presented on successive interchanges, both within and across trials. The same stimulus sequence was used in each subject. Trials with movement artifacts were discarded and repeated.
Each trial yielded 30 sec of data. Thus, at the typical stimulus frequency of 2 Hz, the VEP was extracted by averaging a total of 300 to 480 stimulus cycles, each consisting of an interchange between a different pair of stimulus examples.
2.4. VEP Recording and data analysis
Scalp signals were recorded from four electrodes placed at O1, O2, Oz and Pz (international 10/20 convention) with a Cz reference and a right ear ground. Electrode impedance was kept below 10 kΩ. Following amplification (10000 x), filtering (0.1–100Hz) and A/D conversion (at 400Hz, synchronized to the 100 Hz frame rate), data were stored on the VSG 2/3 computer for further analysis.
The initial 6 seconds of each artifact-free trial was discarded to avoid initial transients, e.g., related to eye movements and contrast adaptation. The scalp signal from the remaining 30 seconds was Fourier analyzed in 6-sec segments, yielding 5 nearly independent Fourier estimates from each trial (Victor & Mast, 1991) at each frequency of interest. These Fourier estimates were vector-averaged to determine an estimated steady-state response, and confidence limits were determined by T2circ statistics (Victor & Mast, 1991).
The even harmonic components contain the responses common to the two kinds of stimuli presented on a trial and contain local luminance and local contrast (i.e. the pattern-reversal components), and, in principle, could contain responses driven by the statistical structure of the stimuli. However, the processes that can contribute to the odd harmonic components are only those that are differentially stimulated by the two kinds of stimuli – a strategy that has previously been used for functional isolation of VEP components in several contexts (Victor, 1985; Bach and Meigen, 1992; Norcia, Wesemann & Manny, 1999; Braddick, Birtles, Wattam-Bell & Atkinson, 2005). In the present experiments, odd harmonics do not contain responses to local luminance or contrast, because changes in local luminance or contrast were equated at each of the two interchanges within each stimulus cycle. Moreover, isodipole texture stimuli contained, on average, no correlations across the symmetry axes; symmetry stimuli, on average, contained no local higher-order correlations except for checks precisely on the symmetry axes. Thus, for random <->texture interchange, the odd harmonics isolate a response driven by mechanisms sensitive to local correlations, while for random<->symmetry interchange, the odd harmonics isolate a response driven by mechanisms sensitive to symmetry.
Since data were analyzed in the steady-state regime, and the Fourier components of interest had periods that were exact multiples of the frame period, simple computational procedures (a discrete Fourier transform) sufficed to obtain unbiased estimates of the Fourier components.
In this study we focus on the amplitudes and phases of the 1st odd harmonic component because the power in the higher odd harmonic components was negligible. Confidence limits (95%) were calculated by the T2circ statistic applied to the set of 6-sec segments of replicate trials.
The confidence limits calculated by T2circ are applicable to response vectors in the complex plane, in which amplitude corresponds to distance from the origin and phase corresponds to direction. In plots of amplitude data, the 95% error bars show the largest and smallest distance from this confidence circle to the origin, determined separately at each condition. Significant differences (at p<0.05) between two quantities of similar variance and phase occurs when these error bars, reduced by a factor of , do not overlap. A corresponding rule of thumb applies for differences in phase, if response amplitudes are similar. Unless otherwise noted, all statements about “signficant differences” between responses refer to significance at p<0.05, based on the T2circ confidence circles.
3. RESULTS
3.1. Expt. 1: Symmetry type
First, we investigated whether there are differences among the VEPs elicited by different degrees and configurations of symmetry: 2-fold symmetry (horizontal or vertical mirror), 4-fold symmetry (both mirror axes), and 8-fold symmetry (oblique axes added) as shown in Figure 2. Responses were measured for eight trials of each type of symmetry, with a modulation of 2 Hz. Check size was determined individually for each subject, based on the largest response to the 8-fold symmetry stimulus in pilot runs (see Experiment 2).
Figure 2.
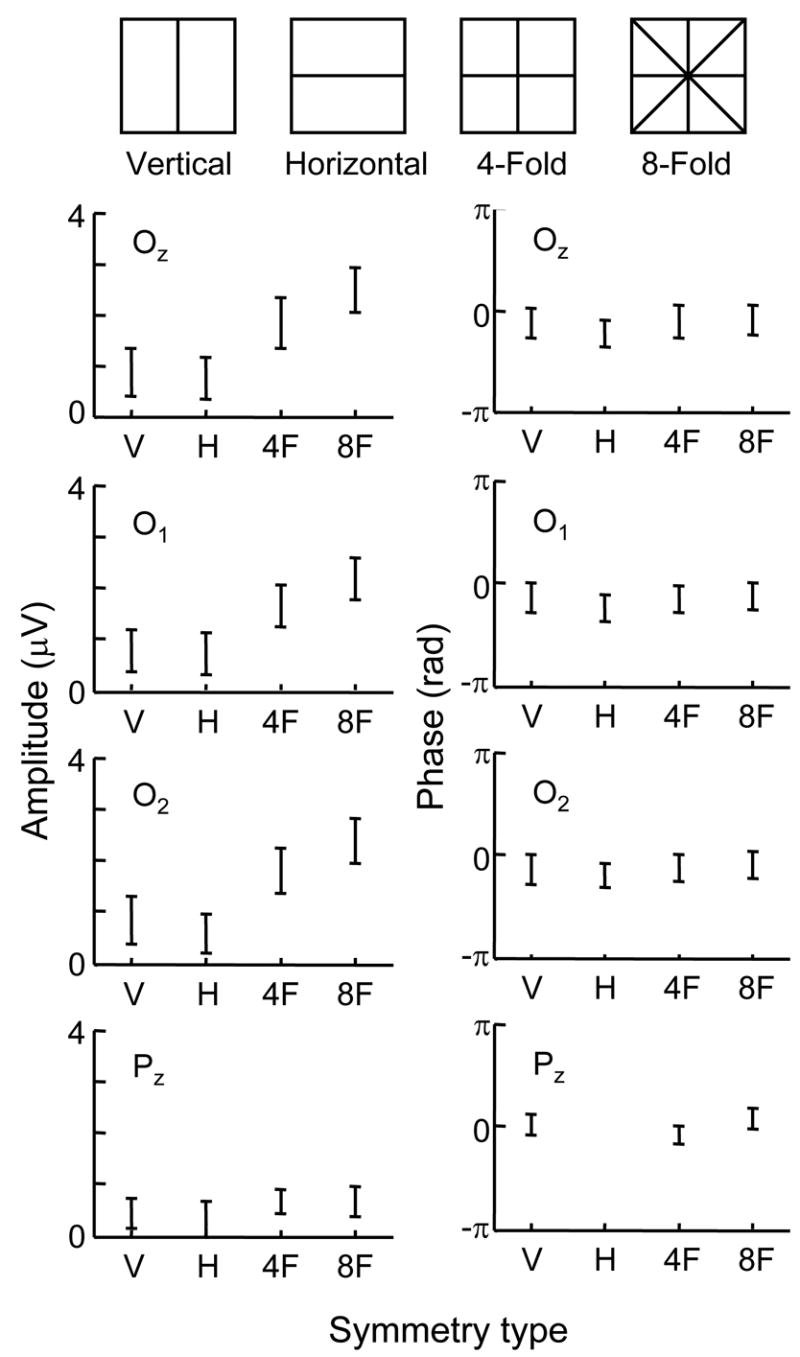
Dependence of response on symmetry type for subject LL. Stimuli had 2-fold symmetry (horizontal or vertical mirror), 4-fold symmetry (both mirror axes), and 8-fold symmetry (oblique mirror axes added). Each row represents the first Fourier component of the response at a single channel (Oz, O1, O2 and Pz) referenced to Cz. The abscissa indicates symmetry type. Left and right columns are amplitude and phase, respectively. Error bars indicates 95 % confidence limits; phase data are not plotted if the amplitudes are not significantly different from 0 (i.e., if the 95% confidence limit includes 0).
Figure 2 shows results for subject LL. For all channels, the amplitudes (left column) of the responses to symmetry are largest for the 8-fold patterns, and progressively smaller for 4-fold, vertical, and horizontal symmetry patterns. There is no significant difference between vertical and horizontal symmetry patterns. Amplitudes are similar at Oz, O1 and O2, and the same dependence on number of symmetry axes is apparent. At Pz, responses are smaller, but consistent with the above findings. In particular, the responses to twofold symmetry cannot be distinguished from each other at p<0.05 (and the horizontal-mirror response cannot be distinguished from noise). The responses to 4-fold and 8-fold symmetry, though also not distinguishable from each other, are significantly (p<0.05) larger than the 2-fold symmetry responses.
For all responses that are above noise, phase is independent of the number of symmetry axes and recording channel.
Figure 3 shows the results for the other subjects at Oz-Cz. (The dependence of the responses on scalp topography in these subjects, not shown, was similar to that of subject LL in Figure 2). For all subjects, responses to the 8-fold symmetry stimulus were significantly (p<0.05) larger than responses to the 2-fold symmetry stimuli. Responses to the 4-fold symmetry stimulus were always intermediate in amplitude between the 2-fold symmetry responses and the 8-fold symmetry responses, although these differences were only significant in subjects LL, SO, and RM. Only subject SD had a difference in amplitude between horizontal and vertical mirror symmetry. There are no consistent trends in the phase data, although subject JV shows a slightly more lagged phase for a vertical symmetry axis.
Figure 3.
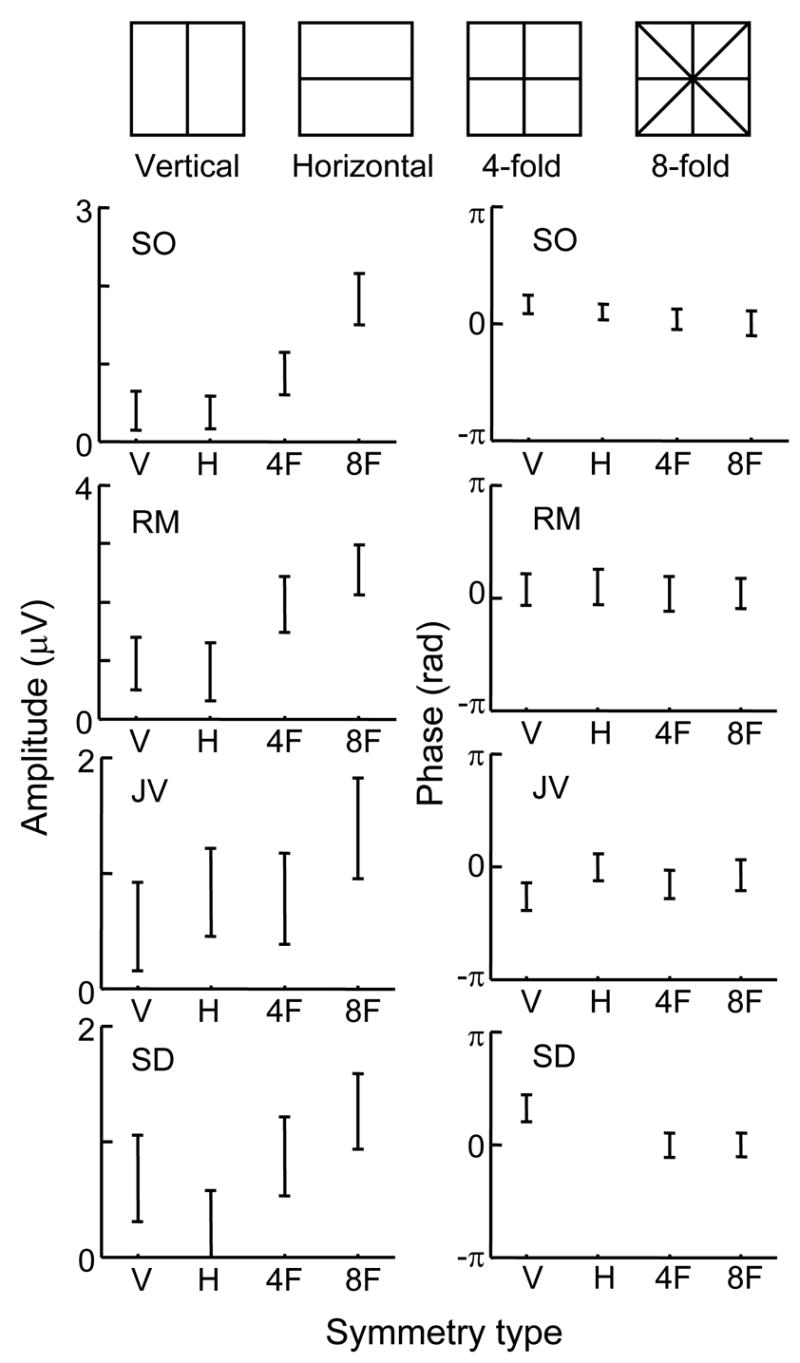
Dependence of response on symmetry type for four subjects. Responses measured at Oz-Cz. Details otherwise as in Figure 2. For symmetry, check size was chosen based on the results of Expt. 2 (Figure 4): 12 min for subjects LL, SO, JV; 6 min for subjects RM and SD. Other details as in Figure 2.
In sum, as the number of axes increases, first-harmonic amplitude increases. Response phase and scalp topography (as assayed by the four-channel montage) do not appreciably change, but, given the small size of the responses, subtle changes might have escaped detection.
Since the amplitude of the first harmonic for the 8-fold symmetry is largest, but otherwise similar to the other types of symmetry, 8-fold symmetry was used in the remainder of the study.
In this experiment, and in the experiments described below, the second-harmonic response did not depend on the presence or absence of symmetry, nor (as previously reported, Victor & Conte 1991, 1996) on the presence or absence of texture – consistent with it reflecting local luminance and contrast mechanisms.
3.2. Expt. 2: Spatial tuning characteristics
Next we investigated how VEPs elicited by symmetry and texture depend on check size. We used stimuli with seven check sizes, ranging from 1.7 min to 35 min, as in Figure 1, and five repeats of each condition, at a temporal frequency of 2Hz.
Figure 4 shows the results for all five subjects. For subject LL, the response to texture is largest at 1.7 min and rapidly decreases for check sizes larger than 3.4 min, while the response to symmetry is small at 1.7 min, and is maximal at 12 min. The maximum amplitude for texture responses is much larger than that for symmetry. The response phase for texture responses is more advanced than for symmetry, except at a check size 35 min. Moreover, the phase of the response to texture has an increasing lag as check size increases. Phase for the symmetry response is independent of check size.
Figure 4.
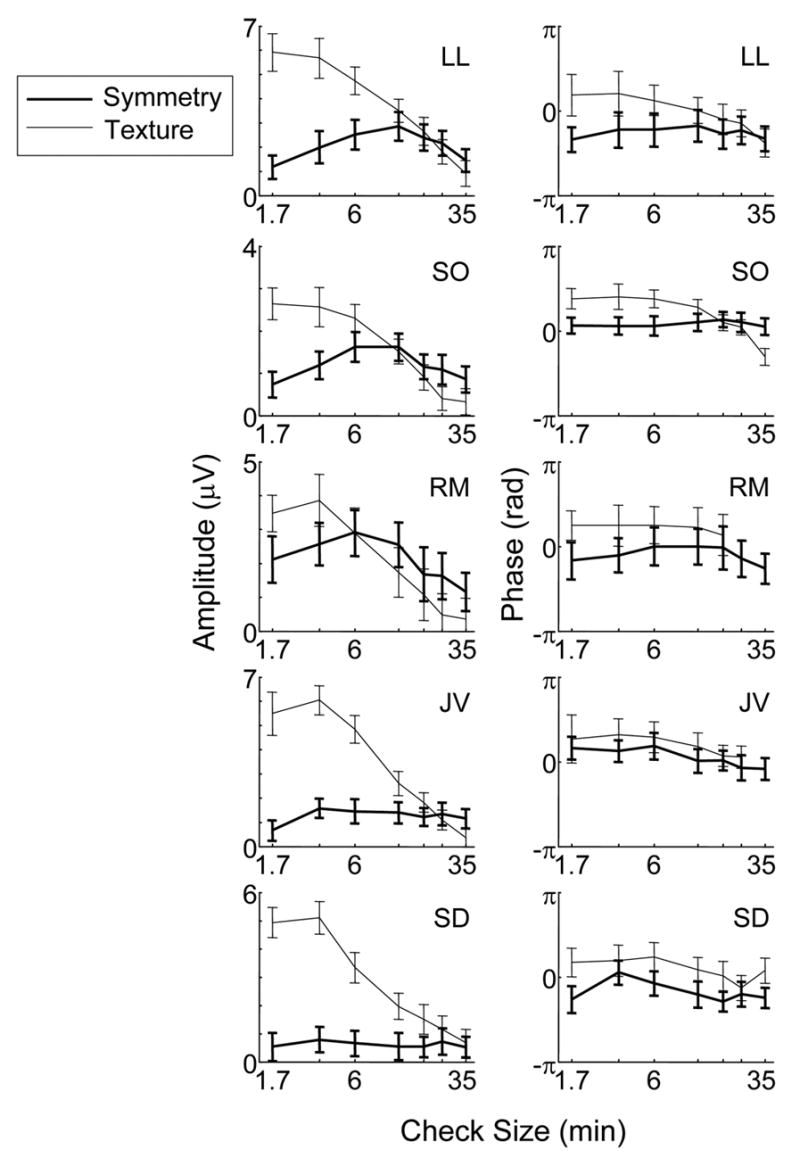
Dependence of response on check size. Bold and thin solid lines indicate the data for the symmetry and texture, respectively. Interchange frequency: 2 Hz. Other details as in Figure 2.
The above trends (texture response tuned to a smaller check size than symmetry responses, and a relative phase advance) are present in various degrees in all subjects. At the smallest check sizes, the texture response is two to fivefold higher than the symmetry response, while at the largest check sizes, the texture response is the same as the symmetry response (LL, SD), or smaller (SO, RM, JV). In two of the latter subjects, the texture response is not significantly different from 0 at the largest check sizes (RM, JV), but the symmetry response persists. This shift is present both for subjects that have a clear peak in the tuning curve for symmetry (LL, SO, RM), and for subjects for whom the tuning curve for symmetry is nearly flat (JV, SD).
The temporal phase of the symmetry response is lagged with respect to that of the texture response for all subjects for checks 6 min and smaller. For subjects, RM, JV and SD, this phase relationship is independent of check size. For the other two, there is a reduction (LL) or reversal (SO) of the phase relationship for large checks.
3.3. Expt. 3: Temporal tuning characteristics
Next we investigated how VEPs for symmetry and texture stimuli are influenced by temporal frequency. Responses were measured at seven modulation rates, ranging from 0.83 Hz to 4 Hz.
Results are shown in Figure 5. For subject LL, the symmetry responses show a smooth peak from 1 to 2 Hz and decrease after 2 Hz. The texture response increases to a maximal response at 2.5 Hz. There is no significant difference in response phase below 1 Hz, but at higher frequencies, phase lag increases more rapidly for symmetry than for texture stimuli. For subject SO, the amplitude for symmetry gradually rises to a peak around 2 Hz but for texture, the amplitude increases sharply from 1 Hz and peaks at 3.3 Hz. RM shows a similar pattern. Subject JV does not show a clear temporal peak for the symmetry response, but has a texture response that peaks at 3 Hz. Subject SD has intermediate behavior: a hint of a peak in the symmetry response at 1 to 1.5 Hz, and a texture response that peaks at 3 to 3.3 Hz. For all observers, the texture response is shifted towards a higher temporal frequency than the symmetry response: it is approximately double the symmetry response at 1 Hz, but fourfold higher at 4 Hz. Moreover, for each subject, the temporal tuning of the symmetry response is broader than the temporal tuning of the texture response.
Figure 5.
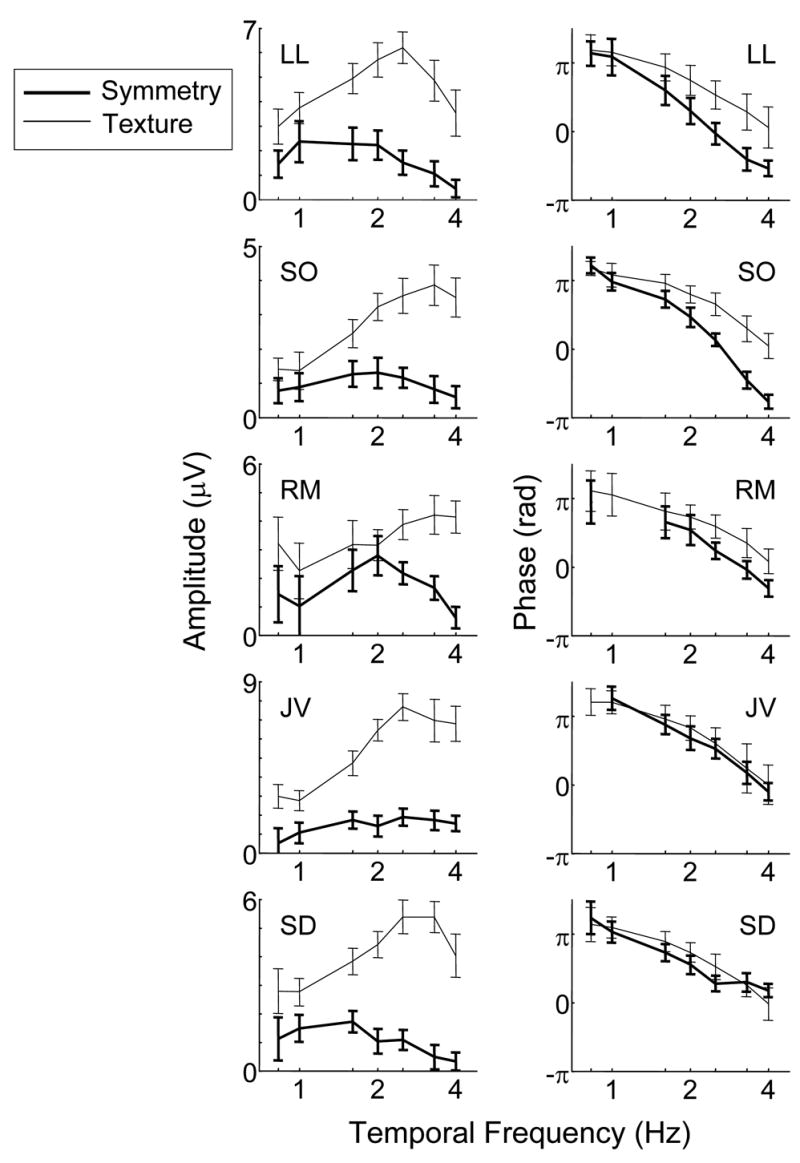
Dependence of response on temporal frequency. Bold and thin solid lines indicate the data for the symmetry and texture, respectively. For texture, check size was 3.2 min for all subjects. For symmetry, check size was chosen based on the largest response in Expt. 2 (Figure 4): 12 min for subjects LL, SO and RM; 6 min for subjects JV and SD. Other details as in Figure 2.
In three of the five subjects, (LL, SO, RM), the phase for symmetry decreases more rapidly than for texture; this phase difference corresponds to a latency difference of up to 80 ms (SO). The other two subjects (JV, SD) showed a trend in the same direction that did not reach statistical significance. Thus, while there is some intersubject variability, phase differences between texture and symmetry responses suggest that the latter process has a greater latency.
3.4. Expt. 4: Temporal interaction of texture and symmetry
We have demonstrated differences between the spatial and temporal aspects of stimuli that drive mechanisms sensitive to symmetry and texture (even isodipole), but the these differences need not imply independence. The next experiment investigates interactions between symmetry and texture in the temporal domain. We use the three pairwise interchanges shown in Figure 6: between random and symmetry (denoted R<->S), between random and even isodipole (denoted R<->E), and between symmetry and even isodipole (denoted S<->E). If there are no temporal interactions between mechanisms that drive the response to symmetry and those that drive the even isodipole response, then the response to the S<->E interchange should be the difference between the response to symmetry (namely, R<->S) and the response to the even isodipole stimulus (namely, R<->E). That is, we can test for temporal independence by determining whether vector subtraction of R<->S and R<->E yields the response to S<->E. Conversely, if the relation S<->E = R<->S – R<->E does not hold, it will mean that there are temporal interactions between mechanisms sensitive to symmetry and to even isodipole structure. Temporal frequency was fixed at 2 Hz.
Figure 6.
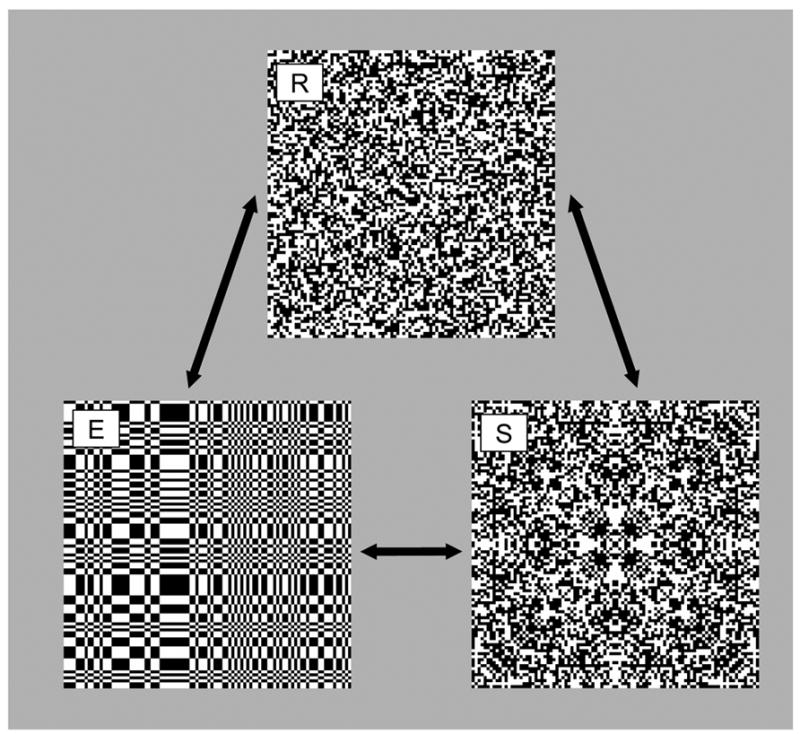
Examples of stimuli used in the interaction experiments. R: a random stimulus; E: an even texture; S: a symmetric stimulus.
Figure 7 shows the results for the smallest check size used in each subject. First-harmonic responses are represented as vectors in the plane, and the radius of each circle represents the 95 % confidence limit (Victor & Mast., 1991). For subject LL, the vector R<->E is longer and more advanced in phase compared with the vector R<->S, corresponding with the previous experiments. The third quadrant contains the measured vector S<->E (marked by “+”) and the vector subtraction S<->E (marked by “*”) which is predicted by vector subtraction of R<->S and R<->E. The extensive overlap of confidence circles means that there is no significant difference between the measured response and the linear prediction. At this check size, one other subject (SD) shows agreement between the measured response and linear prediction. However, for the other three subjects (SO, JV, and RM), the measured S<->E and the vector subtraction S<->E are discrepant (p<0.01 for each), implying a temporal interaction.
Figure 7.
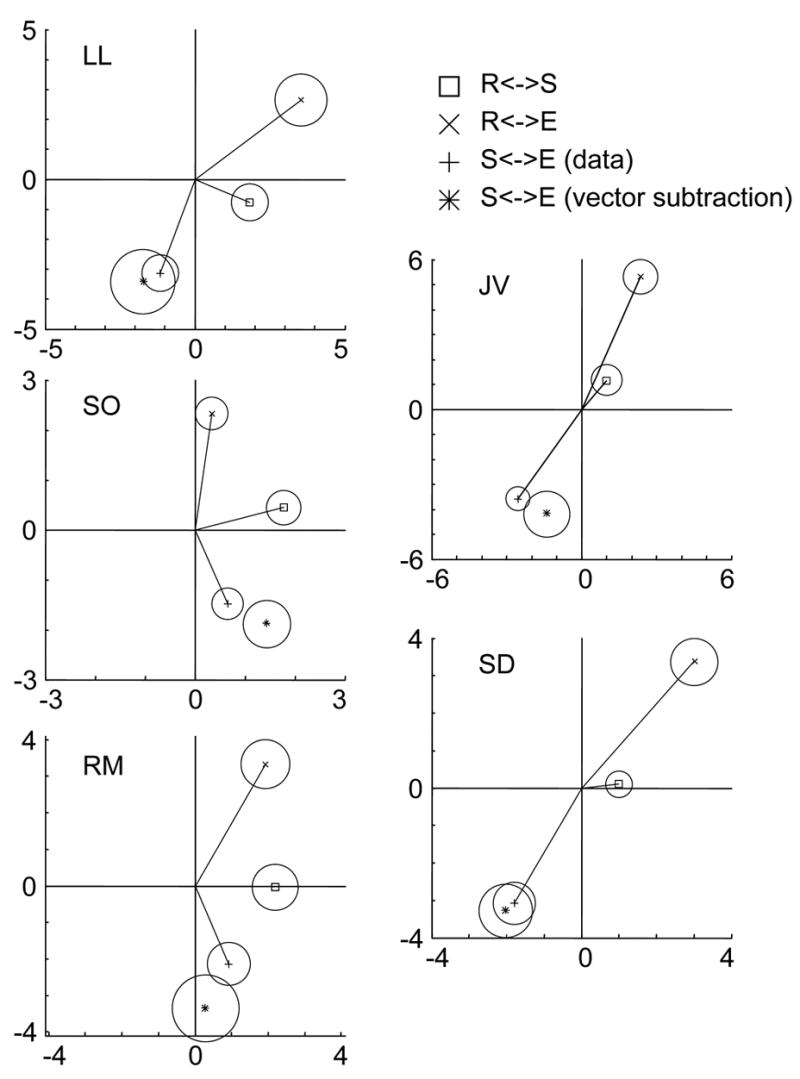
Analysis of temporal interaction for five subjects. Fundamental Fourier components of responses to R<->E, R<->S, and S<->E are shown as vectors, whose length represents response amplitude and whose direction represents response phase. The radius of the circle at the tip of each vector indicates 95 % confidence limit. The vector-subtraction of prediction the S<->E response, (R<->E) – (S<->E), is shown with a confidence limit derived from the confidence limits of the two components that are combined. Data presented from the smallest of three check sizes used for each subject: 3.4 min for JV, RM, and SD; 6 min for SO and LL. Temporal frequency: 2 Hz.
For each of five subjects, we chose three check sizes that covered the range that elicited both symmetry and texture responses, based on the data of Figure 4. Subject SO showed significant interactions at all three check sizes (6, 12, 18 min); JV showed interactions for 3.4 min checks; RM showed interactions at 3.4 and 12 min, SD at 6 min, and LL at 12 min. In all subjects except SD, these interactions were significant at p<0.01 or less on Oz, O1, and O2; for SD, interactions were present on Oz, O1, and Pz, but at p<0.05. Thus, while the check sizes that elicited the interactions varied across subjects, all subjects showed clear evidence of a temporal interaction of the processes that generate the texture response and the symmetry response.
3.5. Expt. 5: Dependence on element density
Our last experiment uses sparse stimuli to dissociate check size and check density (Hardage and Tyler, 1996; Rainville & Kingdom, 2000, 2002). Figure 8(a) shows an 8-fold symmetry stimulus, with a check density of 25%: a standard (“first-order”) symmetry stimulus. In Figure 8(b), a similar image has been modified by randomly flipping the contrasts of the checks. The positions of the checks are still arranged symmetrically, so symmetry can be perceived despite the random contrasts – a reduced-density “second-order” symmetry stimulus.
Figure 8.
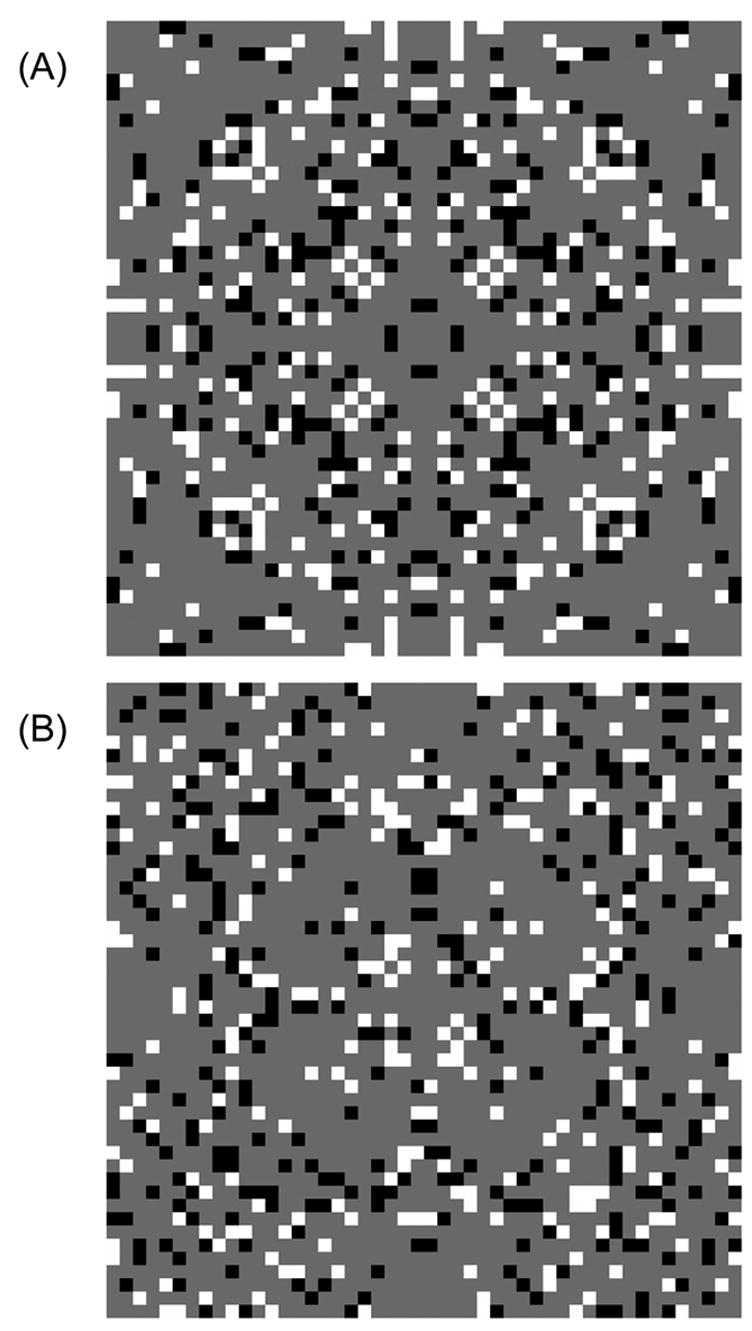
Examples of stimuli used in Expt. 5: check density. (A) and (B) are 1st order and 2nd order symmetry patterns, respectively, at a density of 25 %. When scaled to the 9.4 deg stimulus size used, check size is 12 min.
We measured VEPs elicited by first- and second-order symmetry stimuli with check density ranging from 1.6 % to 100 %, interchanged with arrays of identical check density and intensity distribution but random positions. Check size was 12 min; interchange rate was 2 Hz, and five trials per stimulus type were obtained.
Figure 9 shows the results for three subjects. In the top left are the amplitude data for subject SO. Responses to both kinds of symmetry are very similar up to a density of 12.5 %. At higher densities, the response to second-order symmetry decreases while the response for 1st order symmetry does not change. (At 100% density, the “second-order” stimulus is identical to a completely random pattern, so no consistent differential response can be present.) There is no difference in response phase for first- and second-order symmetry responses, and no clear dependence on density. Subjects RM and JV show similar trends, with perhaps a lower density at which second-order response amplitudes diverge from first-order responses.
Figure 9.
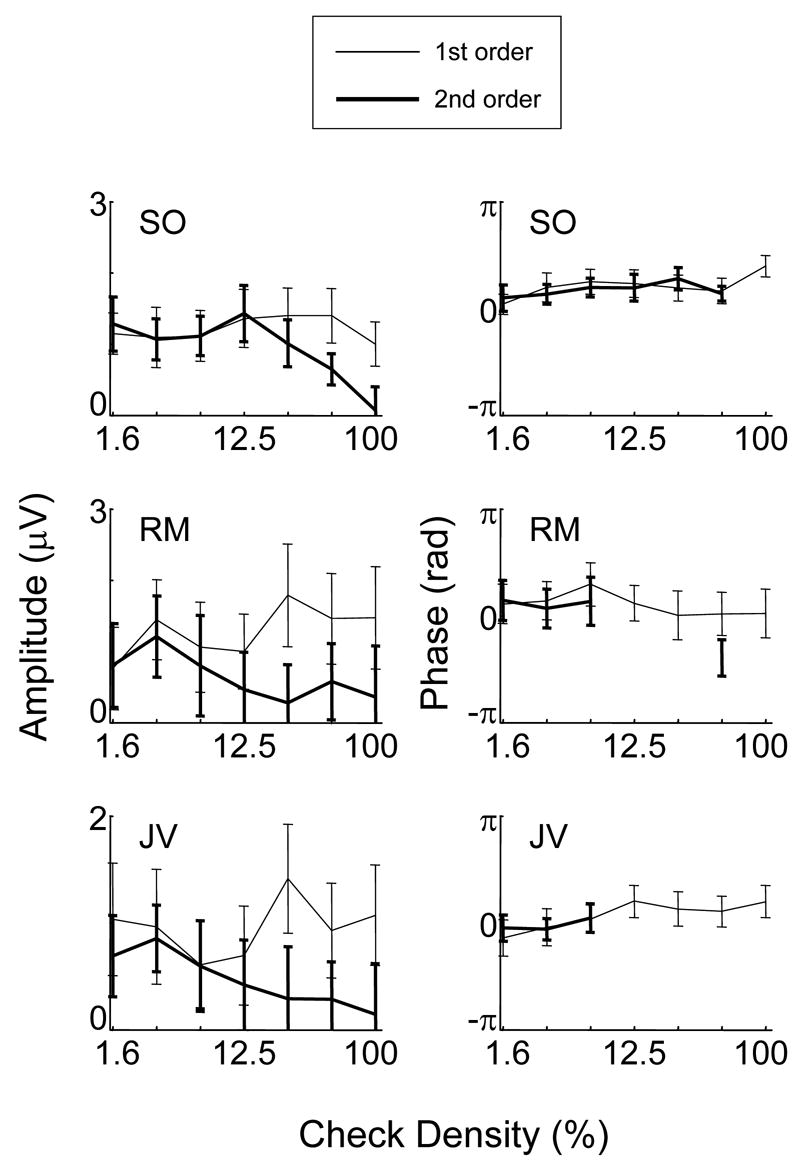
Dependence of response on check density for first-order (thin) and second-order (bold) symmetry stimuli. Check size: 12 min. Temporal frequency: 2 Hz. Other details as in Figure 2.
In sum, for all subjects, the response to first- and second-order symmetry is quite robust even at a density of 1.6%. At low densities, responses to second-order symmetry are indistinguishable from those for first-order symmetry, and second-order symmetry responses are reduced in comparison to first-order responses beginning at a density of approximately 12.5%.
4. DISCUSSION
The differences between the VEP elicited by symmetry and by texture may be summarized as follows. Temporally, the symmetry response peaks at 1–2 Hz, while the texture response peaks at 2–4 Hz (Figure 5). The temporal phase of the symmetry response is lagged with respect to that of the texture response in three of five subjects, corresponding to an effective latency that is greater by approximately 30–80 ms. Spatially, the symmetry response is much more broadly tuned to check size than is the texture response (Figure 4). However, these responses are not independent: all subjects studied showed temporal interactions (Experiment 4 and Figure 7). Finally, sparse symmetry stimuli as low as 1.6 % density elicit a response that is comparable to the responses elicited by densities of 6.25 to 12.5%, and, for sparse stimuli, the response to first- and second-order symmetry is nearly identical (Figure 9).
4.1. Differences in correlation structures
Symmetry axes imply second-order correlations that are equally strong at short and long ranges (for conventional “first-order” symmetry stimuli), but the texture stimuli we used had no second-order correlations. Conversely, higher-order correlations in the symmetry stimuli are restricted to those required by the second-order correlations, while the short-range higher-order correlations in the texture stimuli are the simplest way that they can be distinguished from random patterns, and are not implied by correlations of lower order. In the following section, we consider what aspects of the difference in correlation structure may account for the characteristics of the observed VEPs.
Power spectral differences
While texture and symmetry are exactly matched to the random stimuli in local luminance and contrast, only the texture stimuli are exactly matched in power spectrum (i.e., second-order correlations). Conventional (“first-order”) symmetry unavoidably implies pairwise correlation. However, local contrast mechanisms driven by these correlations are not likely to contribute substantially to our results. First, at each spatial scale, these second-order correlations are very dilute. For example, in a 64 × 64 array, only 1/32 of the pixels are correlated with their nearest neighbor (those on the symmetry axis). Second, the VEP elicited by simple spatial contrast mechanisms (the results of such second-order correlations) has a phase shift corresponding to a latency that is approximately 40 ms shorter than that of the isodipole response (Victor & Zemon, 1985), while the phase of the symmetry response is lagged with respect to the isodipole response (Figure 5). Finally, a simple spatial contrast mechanism would not account for the similarity of the responses to first- and second-order symmetry at low density (Figure 9), since, in a second-order symmetry stimulus, second-order correlations are absent. Thus, power spectral differences (and mechanisms sensitive to spatial contrast) do not account for the response to symmetry, or for the differences between responses to symmetry and responses to texture.
Short-range and long-range correlations
Symmetry is often characterized as “global” structure, but the long-range correlations and the short-range correlations are equally strong. Texture is often characterized as “local” structure, but local structure typically implies longer-range correlations (as it does here). In this sense, both symmetry and texture have short-range and long-range correlations. Accordingly, we also consider our results in terms of short-range and long-range higher-order correlations.
Several studies show that the short-range correlations within the even/odd textures primarily drive the VEP response (Victor & Conte, 1989; Victor & Conte, 1991) and influence performance on discrimination (Joseph, Victor & Optican, 1997) or visual working memory tasks (Victor & Conte, 2004), even though long-range correlations are present. Thus, it is likely that the local structure (short-range correlations), rather than the long-range correlations it implies, drives our VEP results.
The distinguishing aspect of second- and higher-order correlations in the symmetry stimuli is that the distance over which checks are correlated varies according to the position from the axis (from short to long correlations). Psychophysical studies of symmetry have indicated a large contribution of near-fixation short-range correlations to detection and discrimination performance (Gurnsey, Herbert, Kenemy, 1998; Dakin and Herbert, 1998; Rainville et al., 2000, 2002). These observations suggest that short-range correlations near the fixation point contribute to most of the symmetry response for a dense stimulus, but this view does not account for the responses to low-density symmetry stimuli (Figure 9). For first-order symmetry stimuli, response strength is nearly independent of density, from 1.6% to 100%. Thus, long-range correlations in symmetry must be able to produce large VEP responses for low-density stimuli. Rainville & Kingdom (2002) suggest that the summation area used for symmetry analysis varies depending on stimulus density (see also Tyler & Hardage (1996) and Wenderoth(1996)), and that long-range correlations come into play for low-density patterns Other than the number of symmetry axes, the stimuli used in that study were very similar to ours, and the same mechanisms are likely relevant. Additional insights may be gained by the use of textures such as those of Tyler (2005), in which only long-range correlations are present.
Relation to other studies of symmetry
The work of Norcia et al. (2002), which used random dot stimuli of a fixed density, appears to be the only VEP study of symmetry relevant for comparison. Their main finding, that a VEP response to symmetry is present and has a latency approximately 130 ms greater than the P100 (contrast) response, is consistent with our studies: we found that the VEP symmetry response had a latency of up to 80 ms longer than the isodipole texture response, which in turn is approximately 40 ms longer than the P100 (Victor, 1985).
We also examined how the VEP response to symmetry depends on element size and density, for comparison with psychophysical studies. The very weak dependence on density is consistent with the psychophysical findings of Tyler et al. (1996).
Relation to studies of Glass patterns; neural correlates
In Glass (1969) patterns, local pair-wise correlations (among pairs of dots) are combined to generate the percept of global structure. The nature of the global structure interacts with the local correlation structure – detection is better for concentric and radial patterns than parallel ones (Wilson, Wilkinson & Asaad, 1997; Wilson & Wilkinson, 1998). We speculate that this difference is related to the interaction between texture (viewed as a local process) and symmetry (viewed as a global one). One suggestion of an interaction between symmetry and texture comes from the results of Expt. 2, the check size experiment. For check sizes smaller than about 6 min, symmetry responses are attenuated compared to texture responses (Figure 4). This may indicate interference between analysis of symmetry and local texture processing (Dakin & Watt, 1994). Also all subjects show evidence of a temporal interaction between texture and symmetry signals (Expt. 4 and Figure 7)
Thus, the global processes involved in symmetry detection and the (presumably local) processes involved in texture extraction and the determination of local orientation in Glass patterns are not fully independent. Correspondingly, evidence from physiological and imaging studies suggests that they take place in distinct (but interconnected) cortical areas. V1 neurons are known to be sensitive to the higher-order correlations that distinguish among isodipole texture stimuli (Purpura, Victor & Katz, 1994). For Glass patterns, local analysis of orientation is required as a prerequisite for extraction of global structure. This probably accounts for the difference in perceptual responses to Glass patterns with like and unlike-polarity dots (Glass & Switkes, 1976; Prazdny, 1986; Badcock, Clifford & Khuu, 2005; Burr & Ross, 2006), and for the responses of V1 neurons to Glass patterns (Smith, Bair & Movshon, 2002).
Physiologically, the size of the classical receptive field grows significantly from lower to higher areas, with a 2–3 fold increase in area from V1 to V2, and again from V2 to V4 (De Valois & De Valois, 1990; Desimone & Schein, 1987). Smith et al. (2002) showed that V1 neurons’ responses to Glass patterns can be explained by local pairwise correlations while responses to global structures are attributed to neurons of V2 and V4 which preserve topographical mapping.
However, local analysis of orientation or texture is not required for the extraction of global structure in the symmetry stimuli used here and by others (Tyler et al., 1996; Rainville, et al., 2000, 2002), and it is unclear whether symmetry, per se, is a prerequisite for the appreciation of global structure in Glass patterns. Thus, the above physiological results concerning the topographically-mapped visual areas are not directly applicable to understanding the neural mechanisms underlying responses to symmetry.
On the other hand, functional imaging studies (Tyler, et al., 2005) have revealed neural activation specific to symmetry processing in extrastriate visual areas with limited or no topographic mapping of the visual field. This is distinguished from processing of contrast and texture, which activates primary visual cortex, topographically mapped regions in the occipitotemporal stream, and fusiform areas (Beason-Held, et al., 2000). These differences in the neural sites at which symmetry and texture are analyzed are likely to correspond to the differences in the spatial and temporal properties of the VEPs that these stimuli elicit.
Acknowledgments
S. Oka is supported by Research Fellowships of the Japan Society for the Promotion of Science for Young Scientists. Part of this study was supported by Grants in Aid from the Ministry of Education, Science, Sports and Culture (nos. 10551003, 11145219 & 11410026) and Special Coordination Funds for Promotion of Science and Technology. JV and MC are supported by grant EY7977 from the National Eye Institute.
Footnotes
Publisher's Disclaimer: This is a PDF file of an unedited manuscript that has been accepted for publication. As a service to our customers we are providing this early version of the manuscript. The manuscript will undergo copyediting, typesetting, and review of the resulting proof before it is published in its final citable form. Please note that during the production process errors may be discovered which could affect the content, and all legal disclaimers that apply to the journal pertain.
References
- Bach M, Meigen T. Electrophysiological correlates of texture segregation in the human visual evoked potential. Vision Research. 1992;32:417–424. doi: 10.1016/0042-6989(92)90233-9. [DOI] [PubMed] [Google Scholar]
- Badcock DR, Clifford CWG, Khuu SK. Interactions between luminance and contrast signals in global form detection. Vision Research. 2005;45:881–889. doi: 10.1016/j.visres.2004.09.042. [DOI] [PubMed] [Google Scholar]
- Barlow HB, Reeves BC. The versatility and absolute efficiency of detecting mirror symmetry in random dot displays. Vision Research. 1979;19:783–793. doi: 10.1016/0042-6989(79)90154-8. [DOI] [PubMed] [Google Scholar]
- Barrett BT, Whitaker D, McGraw PV, Herbert AM. Discriminating mirror symmetry in foveal and extra-foveal vision. Vision Research. 1999;39:3737–3744. doi: 10.1016/s0042-6989(99)00083-8. [DOI] [PubMed] [Google Scholar]
- Beason-Held LL, Purpura KP, Krasuski JS, Maisog JM, Daly EM, Mangot DJ, Desmond RE, Optican LM, Schapiro MB, VanMeter JW. Cortical regions involved in visual texture perception: a fMRI study. Cognitive Brain Research. 1998;7:111–118. doi: 10.1016/s0926-6410(98)00015-9. [DOI] [PubMed] [Google Scholar]
- Beason-Held LL, Purpura KP, Krasuski JS, Desmond RE, Mangot DJ, Daly EM, Optican LM, Rapoport SI, VanMeter JW. Striate cortex in humans demonstrates the relationship between activation and variation in visual form. Experimental Brain Research. 2000;130:221–6. doi: 10.1007/s002210050024. [DOI] [PubMed] [Google Scholar]
- Braddick O, Birtles D, Wattam-Bell J, Atkinson J. Motion- and orientation-specific cortical responses in infancy. Vision Research. 2005;45:3169–3179. doi: 10.1016/j.visres.2005.07.021. [DOI] [PubMed] [Google Scholar]
- Burr D, Ross J. The effects of opposite-polarity dipoles on the detection of Glass patterns. Vision Research. 2006;46:1139–1144. doi: 10.1016/j.visres.2005.09.018. [DOI] [PubMed] [Google Scholar]
- Dakin SC, Watt RJ. Detection of bilateral symmetry using spatial filters. Special issue: the perception of symmetry: part 1. Theoretical aspects. Spatial Vision. 1994;8:393–413. doi: 10.1163/156856894x00071. [DOI] [PubMed] [Google Scholar]
- Dakin SC, Herbert AM. The spatial region of integration for visual symmetry detection. Proceedings of the Royal Society of London (B) 1998;265:659–664. doi: 10.1098/rspb.1998.0344. [DOI] [PMC free article] [PubMed] [Google Scholar]
- Desimone R, Schein SJ. Visual properties of neurons in area V4 of the macaque: sensitivity to stimulus form. Journal of Neurophysiology. 1987;57:835–868. doi: 10.1152/jn.1987.57.3.835. [DOI] [PubMed] [Google Scholar]
- DeValois RL, DeValois KK. Spatial Vision. New York: Oxford University Press; 1990. [Google Scholar]
- Glass L. Moiré effects from random dots. Nature. 1969;223:578–580. doi: 10.1038/223578a0. [DOI] [PubMed] [Google Scholar]
- Glass L, Switkes E. Pattern recognition in humans: Correlations which cannot be perceived. Perception. 1976;5:67–72. doi: 10.1068/p050067. [DOI] [PubMed] [Google Scholar]
- Gurnsey R, Herbert AM, Kenemy J. Bilateral symmetry embedded in noise is detected accurately only at fixation. Vision Research. 1998;38:3795–3803. doi: 10.1016/s0042-6989(98)00106-0. [DOI] [PubMed] [Google Scholar]
- Joseph JS, Victor JD, Optican LM. Scaling effects in the perception of higher-order spatial correlations. Vision Research. 1997;37:3097–3107l. doi: 10.1016/s0042-6989(97)00068-0. [DOI] [PubMed] [Google Scholar]
- Julesz B. Visual pattern discrimination. IRE Transactions on Information Theory. 1962;IT-8:84–92. [Google Scholar]
- Julesz B, Gilbert EN, Victor JD. Visual discrimination of textures with identical third-order statistics. Biological Cybernetics. 1978;31:137–40. doi: 10.1007/BF00336998. [DOI] [PubMed] [Google Scholar]
- Landy MS, Bergen JR. Texture segregation and orientation gradient. Vision Research. 1991;31:679–91. doi: 10.1016/0042-6989(91)90009-t. [DOI] [PubMed] [Google Scholar]
- Malik J, Perona P. Preattentive texture discrimination with early vision mechanisms. Journal of the Optical Society of America A. 1990;7:923–932. doi: 10.1364/josaa.7.000923. [DOI] [PubMed] [Google Scholar]
- Marr D, Hildreth E. Theory of edge detection. Proceedings of the Royal Society of London Series B. 1980;207:187–217. doi: 10.1098/rspb.1980.0020. [DOI] [PubMed] [Google Scholar]
- Norcia AM, Wesemann W, Manny RE. Electrophysiological correlates of vernier and relative motion mechanisms in human visual cortex. Visual Neuroscience. 1999;16:1123–1131. doi: 10.1017/s0952523899166124. [DOI] [PubMed] [Google Scholar]
- Norcia AM, Candy TR, Pettet MW, Vildavski VY, Tyler CW. Temporal dynamics of the human response to symmetry. Journal of Vision. 2002;2:132–9. doi: 10.1167/2.2.1. [DOI] [PubMed] [Google Scholar]
- Olivers CN, van der Helm PA. Symmetry and selective attention: a dissociation between effortless perception and serial search. Perception and Psychophysics. 1998;60:1101–1116. doi: 10.3758/bf03206161. [DOI] [PubMed] [Google Scholar]
- Prazdny K. Some new phenomena in the perception of Glass patterns. Biological Cybernetics. 1986;53:153–158. doi: 10.1007/BF00342883. [DOI] [PubMed] [Google Scholar]
- Purpura KP, Victor JD, Katz E. Striate cortex extracts higher-order spatial correlations from visual textures. Proceedings of the National Academy of Sciences of the United States of America. 1994;91:8482–8486. doi: 10.1073/pnas.91.18.8482. [DOI] [PMC free article] [PubMed] [Google Scholar]
- Rainville SJM, Kingdom FAA. The functional role of oriented spatial filters in the perception of mirror symmetry-psychophysics and modeling. Vision Research. 2000;40:2621–2644. doi: 10.1016/s0042-6989(00)00110-3. [DOI] [PubMed] [Google Scholar]
- Rainville SJM, Kingdom FAA. Scale invariance is driven by stimulus density. Vision Research. 2002;42:351–367. doi: 10.1016/s0042-6989(01)00290-5. [DOI] [PubMed] [Google Scholar]
- Simoncelli EP, Olshausen BA. Natural image statistics and neural representation. Annual Review of Neuroscience. 2001;24:1193–1216. doi: 10.1146/annurev.neuro.24.1.1193. [DOI] [PubMed] [Google Scholar]
- Smith MA, Bair W, Movshon JA. Signals in macaque striate cortical neurons that support the perception of Glass patterns. Journal of Neuroscience. 2002;22:8334–8345. doi: 10.1523/JNEUROSCI.22-18-08334.2002. [DOI] [PMC free article] [PubMed] [Google Scholar]
- Tyler CW. Empirical aspects of symmetry perception. Spatial Vision. 1995;91:1–7. doi: 10.1163/156856895x00089. [DOI] [PubMed] [Google Scholar]
- Tyler CW. In: Human Symmetry Perception and its Computational Analysis. Tyler Christopher W., editor. VSP BV, Zeist; The Netherlands: 1996. [Google Scholar]
- Tyler CW. Human symmetry detection exhibits reverse eccentricity scaling. Visual Neuroscience. 1999;16:919–22. doi: 10.1017/s0952523899165118. [DOI] [PubMed] [Google Scholar]
- Tyler CW. Human symmetry detection exhibits reverse eccentricity scaling. Journal of Vision. 2001;1:137–44. doi: 10.1017/s0952523899165118. [DOI] [PubMed] [Google Scholar]
- Tyler CW, Hardage L. Mirror symmetry detection: predominance of second-order pattern processing throughout the visual field. In: Tyler CW, editor. Human symmetry perception and its computational analysis. VSP, Utrecht; The Netherlands: 1996. [Google Scholar]
- Tyler CW, Baseler HA, Kontsevich LL, Likova LT, Wade AR, Wandell BA. Predominantly extra-retinotopic cortical response to pattern symmetry. Neuroimage. 2005;24:306–14. doi: 10.1016/j.neuroimage.2004.09.018. [DOI] [PubMed] [Google Scholar]
- Victor JD. Complex visual textures as a tool for studying the VEP. Vision Research. 1985;25:1811–1827. doi: 10.1016/0042-6989(85)90005-7. [DOI] [PubMed] [Google Scholar]
- Victor JD, Conte MM. Cortical interactions in texture processing: scale and dynamics. Visual Neuroscience. 1989;2:297–313. doi: 10.1017/s0952523800001218. [DOI] [PubMed] [Google Scholar]
- Victor JD, Conte MM. Spatial organization of nonlinear interactions in form vision. Vision Research. 1991;31:1457–1488. doi: 10.1016/0042-6989(91)90125-o. [DOI] [PubMed] [Google Scholar]
- Victor JD, Conte MM. The role of high-order phase correlations in texture processing. Vision Research. 1996;36:1615–1631. doi: 10.1016/0042-6989(95)00219-7. [DOI] [PubMed] [Google Scholar]
- Victor JD, Conte MM. Visual working memory for image statistics. Vision Research. 2004;44:541–546. doi: 10.1016/j.visres.2003.11.001. [DOI] [PubMed] [Google Scholar]
- Victor JD, Mast J. A new statistics for steady-state evoked potentials. Electroencephalography and Clinical Neurophysiology. 1991;78:378–388. doi: 10.1016/0013-4694(91)90099-p. [DOI] [PubMed] [Google Scholar]
- Victor JD, Zemon V. The human visual evoked potential: Analysis of components due to elementary and complex aspects of form. Vision Research. 1985;25:1829–1842. doi: 10.1016/0042-6989(85)90006-9. [DOI] [PubMed] [Google Scholar]
- Wenderoth P. The effects of the contrast polarity of dot-pair partners on the detection of bilateral symmetry. Perception. 1996;25(7):757–771. doi: 10.1068/p250757. [DOI] [PubMed] [Google Scholar]
- Wilson HR, Wilkinson F, Asaad W. Concentric orientation summation in human form vision. Vision Research. 1997;37:2325–2330. doi: 10.1016/s0042-6989(97)00104-1. [DOI] [PubMed] [Google Scholar]
- Wilson HR, Wilkinson F. Detection of global structure in glass patterns: implications for form vision. Vision Research. 1998;38:2933–2947. doi: 10.1016/s0042-6989(98)00109-6. [DOI] [PubMed] [Google Scholar]


