Abstract
A computer-aided-diagnosis (CAD) method has been previously developed based on features extracted from phalangeal regions of interest (ROI) in a digital hand atlas, which can assess bone age of children from ages 7 to 18 accurately. Therefore, in order to assess the bone age of children in younger ages, the inclusion of carpal bones is necessary. However, due to various factors including the uncertain number of bones appearing, non-uniformity of soft tissue, low contrast between the bony structure and soft tissue, automatic segmentation and identification of carpal bone boundaries is an extremely challenging task. Past research works on carpal bone segmentation were performed utilizing dynamic thresholding. However, due to the limitation of the segmentation algorithm, carpal bones have not been taken into consideration in the bone age assessment procedure. In this paper, we developed and implemented a knowledge-based method for fully automatic carpal bone segmentation and morphological feature analysis. Fuzzy classification was then used to assess the bone age based on the selected features. This method has been successfully applied on all cases in which carpal bones have not overlapped. CAD results of total about 205 cases from the digital hand atlas were evaluated against subject chronological age as well as readings of two radiologists. It was found that the carpal ROI provides reliable information in determining the bone age for young children from newborn to 7-year-old.
Keywords: Bone age assessment, Computer-aided-diagnosis, Carpal region of interest, Carpal bone segmentation, Anisotropic diffusion, Canny edge detection, Feature extraction, Fuzzy classification
1. Introduction
The determination of skeletal maturity (‘bone age’) plays an important role in diagnostic and therapeutic investigations of endocrinological problems and growth disorders of children [1,2]. In clinical practice, the most commonly used bone age assessment method is atlas matching by a left hand and wrist radiograph against the Greulich & Pyle (G&P) atlas [3] which contains a reference set of normal standard images. However, besides the fact that the data in G&P atlas was collected in 1950s, this method strongly depends on experience of the observer, leading to considerable inter- and intra-observer discrepancy. Therefore, an updated data collection and an objective method are desirable.
A computer-aided-diagnosis (CAD) method [4–8] has been previously developed in our laboratory based on features extracted from regions of interest (ROI) in phalanges from a digital hand atlas. One thousand one hundred and three left hand and wrist radiographs of normal children, from newborn to 18-year-old, were acquired at the Childrens Hospital Los Angeles (CHLA) and digitized at IPI (Image Processing and Informatics Lab, USC). The data was evenly distributed into four races (Asian, Caucasian, African-American and Hispanic) for both gender (male and female). Each case was read by two radiologists independently. Fig. 1 shows an example image with phalangeal and carpal ROIs superimposed.
Fig. 1.
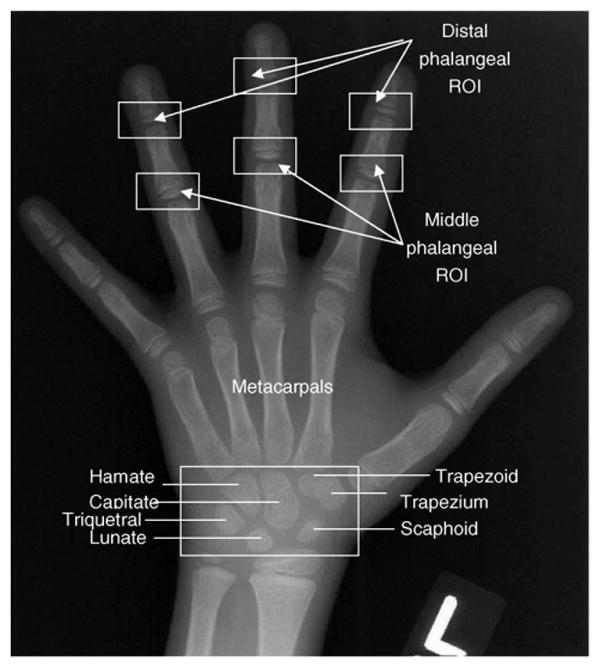
A left hand and wrist radiograph marked with six phalangeal ROIs and carpal ROI (box at the bottom).
For children above 6 of female or 8-year-old of male, phalangeal feature analysis was very reliable. Therefore, CAD method yields very accurate bone age assessment. However, for ages below 5–7, the phalangeal analysis fails to extract the features correctly in some cases, especially in very young children. This is due to the following problems: first, soft tissue deteriorates the border and makes the segmentation between epiphysis and metaphysis an extremely difficult task. Second, the developments of epiphysis of the six phalangeal ROIs are not parallel. Third, it is not reliable to locate the phalangeal ROIs correctly if the hand is rotated when the upright hand position is not achieved during acquisition. Lastly, the phalangeal ROIs analysis is sensitive to bending of fingers during acquisition.
Therefore, in order to achieve similar degree of accuracy in bone age assessment for children of all ages, we hypothesized that the CAD method may benefit from the augmentation of features extracted from the carpal ROI of young children. Medical studies [1,2,9] verified the value of carpal bone in determining the bone age of young children. Past research work on carpal bone segmentation has been done by Pietka et al. [10] utilizing dynamic thresholding. However, due to the limitation of the algorithm, carpal ROI have not been taken into consideration in the bone age assessment procedure.
This paper described a knowledge-based carpal ROI analysis for fully automatic carpal bone segmentation and feature analysis for bone age assessment by fuzzy classification. Table 1 shows the reliability of phalangeal and carpal ROIs analysis for different age groups in CAD system. The carpal bone segmentation and feature extraction were proven to be very reliable for young children before the carpal bones start to overlap. Combining with the existing phalangeal ROI, it improved the accuracy of computerized bone age assessment for young children significantly. Hence, accurate bone age assessment was ensured for the entire age range.
Table 1.
Reliability of ROI analysis for different age groups in CAD method
| Age group (years) | ROI | |
|---|---|---|
| Phalangeal ROI analysis | Carpal ROI analysis | |
| 0–5 (female), 0–7 (male) | Size and shape analysis of epi-metaphysis: feature extraction is not reliable | Size and shape analysis of carpal bones: feature extraction is reliable |
| 6–12 (female), 8–12 (male) | Size and shape analysis of epi-metaphysis: feature extraction is reliable | Degree of overlapping of carpal bones: feature extraction is not reliable |
| 13–18 (female and male) | Degree of fusion of epi-metaphysis: feature extraction is highly reliable | |
2. Materials and methods
2.1. Growth pattern of carpal bones
At the early stage of development, carpals appear as dense pin points on a radiograph. During development, they increase in size until reaching their optimal sizes and characteristic shapes. Fig. 2 shows an ROI image with seven carpal bones appearing.
Fig. 2.

Description of carpal bones in a hand radiograph.
Fig. 3 demonstrates the growth pattern of carpal bones of Asian males from newborn to 7-year-old. Carpal bones ossified in chronological order, Capitate, Hamate, Triquetral, Lunate, followed usually by Scaphoid, then either the Trapezium or the Trapezoid [3,11]. Female developments noticeably more advanced than male by as many as 3 years.
Fig. 3.
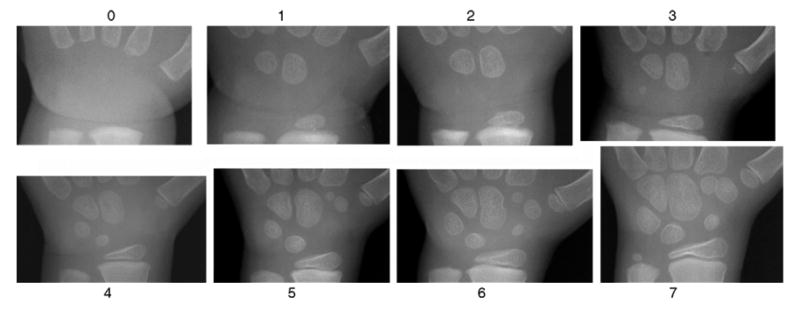
Growth pattern of carpal bones of Asian male from newborn to 7-year-old. The number represents the corresponding age group for each image.
Medical study [9] indicated that, due to the nature of carpal bone maturity, their analysis does not provide accurate and significant information for patients older than 7–12 years of age. This is due to the fact that carpal bones start overlap at age around 7-year-old in male and 5 in female. In this stage of development the phalangeal analysis yields more reliable information. Therefore, in this research, carpal bone analysis focuses on age group from 0 to 7 for male and 0 to 5 for female.
2.2. CAD methodology overview of carpal ROI analysis
The workflow of carpal ROI analysis procedure which includes seven steps is shown in Fig. 4. The carpal bone region of interest was first extracted from the entire hand image (Fig. 1) (1). Due to the non-uniform background and noise, the carpal bone ROI was subjected to an anisotropic diffusion filter (2) which smoothed out the noise and preserves the edges at the same time. Then, the object contours were extracted by the Canny edge detector (3). A series of knowledge-based operations based on morphological properties of segmented objects were implemented in order to single out the carpal bones by eliminating the non-carpal bones (4). The carpal bones contours went through feature extraction phase which yields the inputs into the fuzzy classifiers to assess the bone age (5–7). This section discusses the procedure in the following order: carpal bone segmentation, carpal bone identification, feature analysis and bone age assessment using fuzzy logic.
Fig. 4.
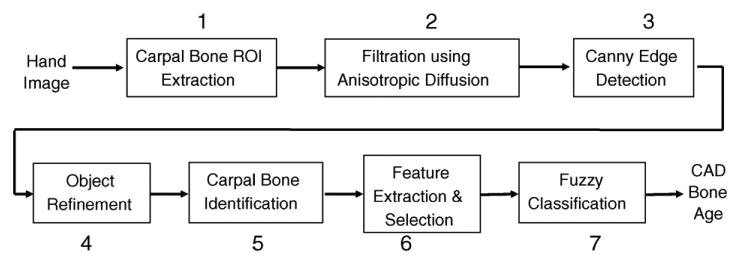
Carpal ROI analysis workflow with seven steps.
2.3. Carpal bone segmentation
2.3.1. Carpal ROI extraction from entire hand image
The first step (in Fig. 4) was to locate and extract carpal ROI for further analysis. Fig. 5 shows the procedure. A binary hand silhouette was obtained by adaptive thresholding of the hand image with background removed. The carpal ROI was then located in the hand silhouette after artifacts deletion. The upper edge of the carpal ROI was found by scanning a horizontal line and searching for the junction between the second and third metacarpal bone. Perpendicular to the upper edge of the image, starting from its middle, two lines were scanned one pixel at a time toward the left and right borders of the image. The first line on both sides that did not intersect the wrist, fixed the left and right border, respectively. The lower edge of the CROI was the line that intersected the forearm with the minimal width. It was determined by scanning the forearm, one line at a time, from the proximal end of the hand and moving toward the distal end. The carpal ROI was defined within these four edges.
Fig. 5.
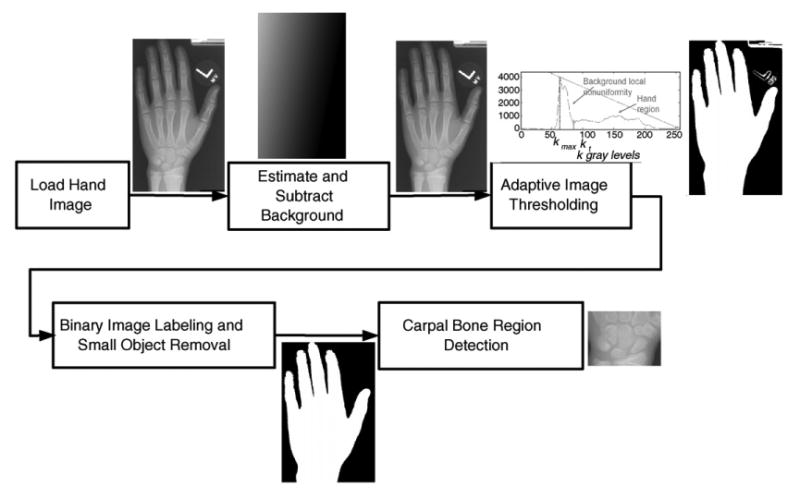
The procedure of carpal ROI extraction from the entire hand image.
2.3.2. Image smoothing by anisotropic diffusion
Carpal bones in the image are generally poor in contrast. Furthermore, the bone edges are often degraded by noise and artifacts. In order to better differentiate carpal bones from the background, an anisotropic diffusion filter proposed by Perona and Malik [12] was applied to the carpal ROI image (second step in Fig. 4).
This filter was able to greatly reduce noise in homogeneous areas of carpal ROI images while preserving the edges and contrast associated with bony structures. The principle is to smooth out noise locally by diffusion while at the same time preventing diffusion across object boundaries. The diffusion coefficient is chosen to vary spatially based on a measure of edge strength to encourage intra-region smoothing in preference to inter-region smoothing. The diffusion process achieves piecewise smoothing while preserving the relevant image edges.
Fig. 6(a) and (b) shows the original carpal ROI image and the result after anisotropic diffusion filtration, respectively. The comparison of profiles along one horizontal line (same position in both images) which runs across the Capitate and Hamate is given in Fig. 6(c) and (d). It demonstrates that noise is greatly suppressed by the diffusion process while the sharp edges are well preserved.
Fig. 6.
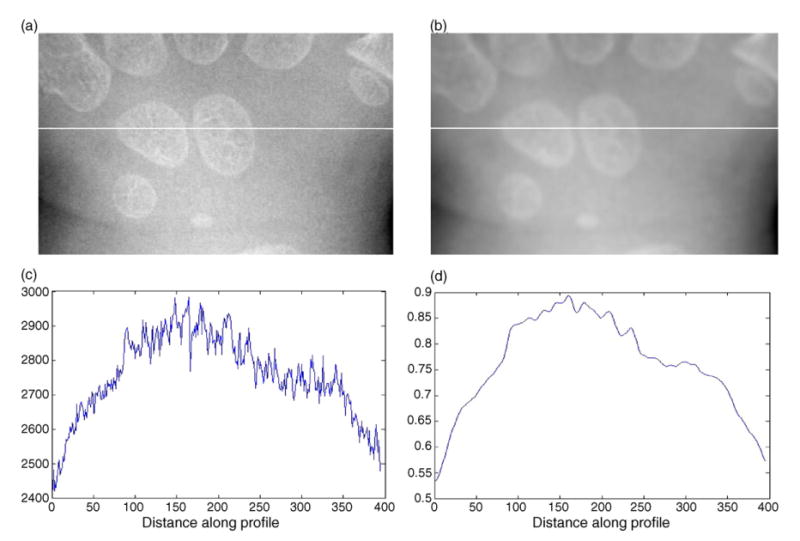
Illustration of anisotropic diffusion filtration: (a) original carpal bone ROI image; (b) the result image after anisotropic diffusion filtration; (c) profile of the original image along the horizontal line; (d) profile of the filtered image along the horizontal line.
Size and shape of carpal bone are the characteristics related with skeletal development. Bony texture inside the carpal bone is not the factor that radiologist investigate in assessing the bone age. The next step is to segment the carpal bones from the carpal ROI image.
2.3.3. Edge detection by Canny
Edge detection by Canny method (third step in Fig. 4) was performed on the smoothed ROI image. The Canny edge detector finds linear, continuous edges and is known as the optimal edge detector [11,13,14]. The Canny method differs from other edge-detection methods in that it uses two different thresholds, and includes the weak edges in the output only if they are connected to strong edges. Fig. 7 shows an example of a filtered image by using the anisotropic diffusion (shown in Fig. 7(b)) and the edges detected by Canny method. This method is less likely than the others to be confused by noise and the carpal bones were detected as closed-contours.
Fig. 7.
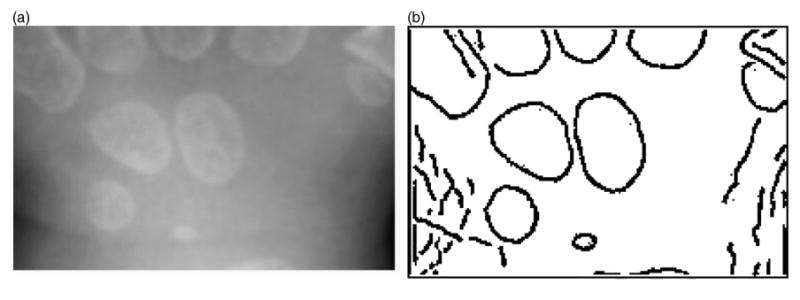
Canny edge-detection example: (a) original image (Fig. 6(b)) and (b) result image after Canny edge detection.
2.3.4. Objects refinement
The carpal ROI includes carpal bones and parts of the radius, ulna, and metacarpals. Before the features that describe the carpal bones were extracted, the carpal bones themselves needed to be identified from the result of Canny edge detection. An original image and the final result after object refinement (fourth step in Fig. 4) are shown in Fig. 8(a) and (b), respectively.
Fig. 8.
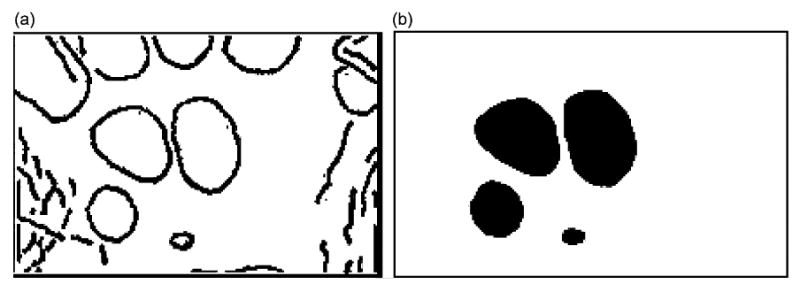
The goal of objects refinement procedure: (a) original image (Fig. 7(b)) and (b) image after objects refinement.
Knowledge-based morphological operations were used to clean-up the objects. The removal of non-carpal bones was performed in several steps. In the first step all objects that touch the CROI borders were extracted and eliminated. These include the metacarpal bones, wrist bones including ulna and radius touching the CROI borders. In the second step straight and short lines and spots were removed. Eccentricity, a morphological property, of each object was used to identify the carpal bones. It measures how far the object deviates from a circle. Fig. 9 shows an ellipse that has the same area as the segmented carpal bone. Eccentricity is defined as the ratio of the distance between the foci (F1 and F2) to the major axis; i.e. .
Fig. 9.
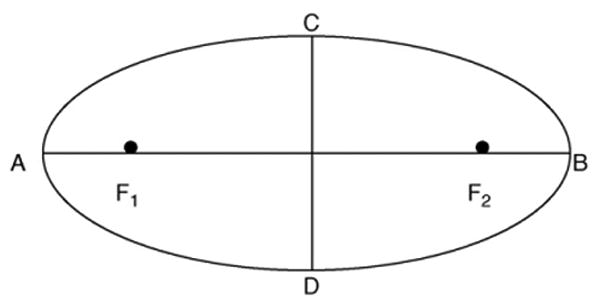
Illustration of an ellipse with foci (F1 and F2) and major axis (between A and B). Eccentricity is defined as the ratio of distance of F1 and F2 and major axis.
Based on our experiments, the eccentricity of carpal bone falls between .1 and .9 and can be used as a prior knowledge. Therefore, objects which have eccentricities under .1 or above .9 were eliminated. In the third step objects were filled and closed-contour objects were selected based on solidity, a morpholoical property of each object. A convex hull for each filled object is first found as the smallest convex polygon that can contain the object. The proportion of pixels in its convex hull that are also in the studied object is then defined as solidity. The objects, which solidities are above .5, were taken as the closed-contour objects. The others were discarded. Fig. 10 shows the final carpal bone contours overlapped on a carpal bone region image.
Fig. 10.
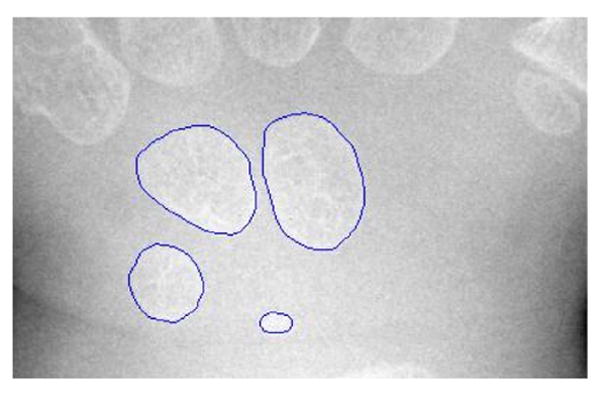
Final segmentation results superimposed on the original carpal ROI shown in Fig. 6(a).
2.4. Model-based carpal bone identification
From the carpal bone contours, the post-processing procedure utilizing a prior knowledge was developed to identify the bones (fifth step in Fig. 4). The Capitate is the first bone to appear in chronological order and the biggest one among all the carpal bones. It is also the most reliable bone to segment out. A polar coordinate system with the origin at the center of gravity of the Capitate, which was identified as the largest object, was built. The major axis was set as the original normal axis of the polar system. The carpal ROI was then divided into five empirical regions shown in Fig. 11. The positions of regions define the prior knowledge about where a carpal bone should be located in the carpal ROI.
Fig. 11.
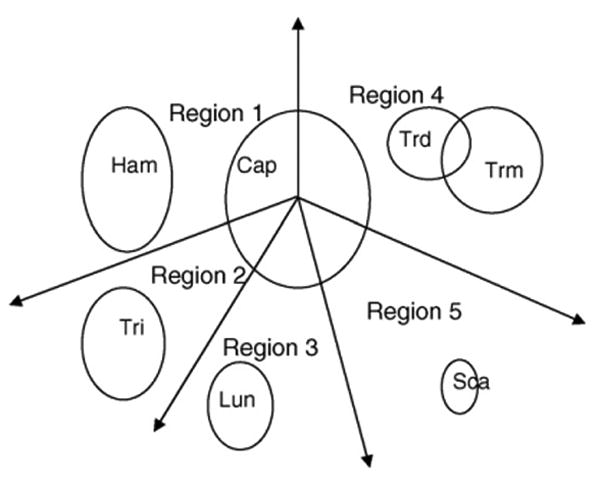
Carpal bone identification model. The polar coordinate system with the centroid of the Capitate as the origin is divided into five regions. Based on a priori anatomical knowledge, each of which houses a carpal bone(s): Capitate, Hamate, Triquetral, Lunate, Scaphoid, Trapezium and Trapezoid.
The center of gravity of each object was then computed based on polar coordinates. Each object was assigned to the region it belongs to, based on the polar angle and radius of each object. The identification model is hand rotation invariant because the major axis of Capitate follows the rotation of the hand. Fig. 12 shows the one example case with identified carpal bones.
Fig. 12.
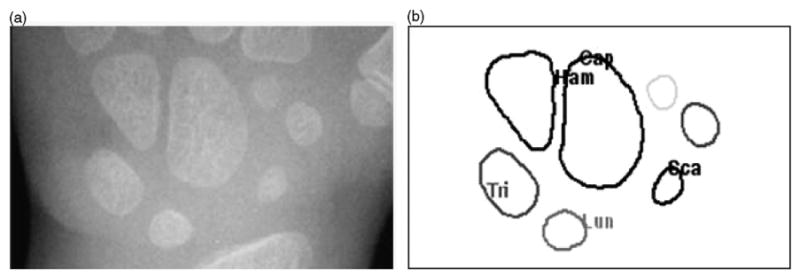
A carpal bone identification example: (a) original carpal ROI image and (b) identified carpal bones—Cap: Capitate, Ham: Hamate, Tri: Triquetral, Lun: Lunate and Sca: Scaphoid.
The first two bones which appear in chronological order, Capitate and Hamate, were selected for further analysis. The other identified bones which appear later will be analyzed for future refinement in case that Capitate and Hamate are failed to extract because of fusion with each other.
2.5. Feature analysis
From the identified carpal bones, features related to the bony growth were extracted for bone age assessment (sixth step in Fig. 4).
2.5.1. Morphological feature extraction
To describe the size and shape of the carpal bones identified, four morphological features were extracted from Capitate and Hamate. Feature 1 measures equivalent diameter, which specifies the size of the object. An ellipse that has the same normalized second central moments as the region was found for each bone. Feature 2 is eccentricity which we defined in Section 2.3.4. The value of eccentricity is between 0 and 1. Feature 3 is solidity (also refer to Section 2.3.4). Feature 4, triangularity measures the ratio of equivalent diameter and the product of major axis length and minor axis length.
2.5.2. Feature selection
To evaluate the performance of each feature in assessing the bone age, correlation with the chronological age was analyzed. Among all the features, sizes of Capitate and Hamate have the most significant correlations with age, which are over .90. To simplify the feature space, all features which have the correlation above .60 were selected and form the feature space for bone age assessment. Table 2 shows the correlation coefficients for selected features from an example category of one race and one gender.
Table 2.
Correlation coefficients for selected features
| Capitate | Hamate | ||||||
|---|---|---|---|---|---|---|---|
| Size | Eccentricity | Triangularity | Size | Eccentricity | Triangularity | ||
| Correlation coefficient | .94** | .74** | −.65** | .92** | .70** | −.62** | |
p-Value < .01, highly correlated.
2.6. Bone age assessment using fuzzy logic
The last step in carpal ROI analysis (seventh step in Fig. 4) is to assess the bone age using fuzzy classification based on the features extracted and selected from the Capitate and Hamate. Two characteristics of carpal bone features make bone age assessment difficult. First, the growth of carpal bones does not have a linear relationship with chronological age. The imprecise nature leads to the inter- and intra-observer discrepancy. Second, some features may be missed by the segmentation and feature extraction procedure. Most of past attempts of using linear approach failed because it is insufficient to model the growth pattern. Fuzzy logic [15–18] incorporates a simple and rule-based approach and is suitable for this application because it is robust and does not require precise and noise-free inputs. As long as some features from any bone are provided, it is sufficient to activate the fuzzy system to generate the output.
The three features, size, eccentricity and triangularity extracted from Capitate and Hamate each were taken as an input into the fuzzy classifier. The system was broken into smaller sub-classifiers based on Capitate and Hamate, respectively. Fig. 13 shows the workflow of the fuzzy classification for bone age assessment.
Fig. 13.

Fuzzy classification workflow for bone age assessment.
An automatic training algorithm with the features from our normal data collection was developed for fuzzy classifiers. The output was set as the subject chronological age since the normality of children was ensured for each case during data collection. The data of young children from newborn to age group of 7 (male) or 5 (female) was divided into age groups with an interval of 1 year. Therefore, total of 8 (0, 1, 2, …, 7 for male) or 6 (0, 1, 2, …, 5 for female) initial Gaussian membership functions were generated for each input feature (size, eccentricity, and triangularity) and output (chronological age). The mean and standard deviation of each feature from each age group were calculated and taken as the Gaussian parameters for the corresponding membership functions. Merging of adjacent membership functions was then performed based on the t-test of the mean difference for specific feature between adjacent age groups. The same merging procedure was performed for output depending on the inputs. Fewer number of membership functions simplifies the processing logic and even improving the fuzzy logic system performance. Fig. 14 use Caucasian male as an example to show the groups of membership functions for the three features (Fig. 14(a)–(c)) of Capitate and output (Fig. 14(d)) as chronological age.
Fig. 14.
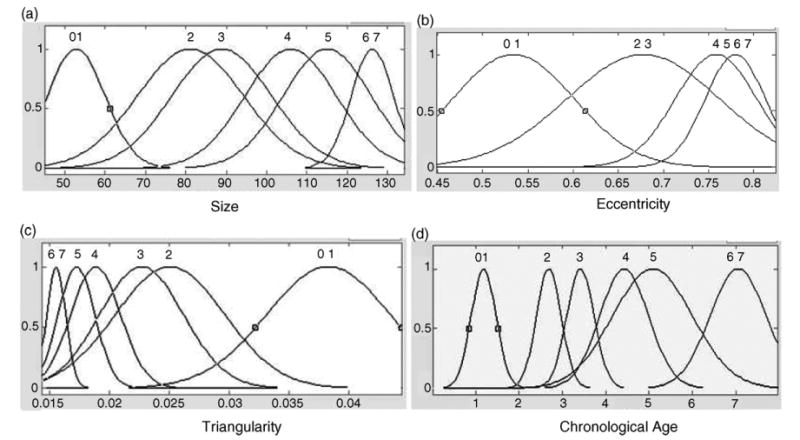
Four membership functions of Capitate sub-classifier for Caucasian male category. In this fuzzy logic training, a normal distribution curve is used to represent a membership function using the mean and standard deviation obtained from each feature. (a), (b), and (c) are the three input features: size, eccentricity, and triangularity, the x-axis is the value of the corresponding feature. The output membership function (d) is the chronological age represented by the x-axis. Each of the four y-axes represents degree of the membership function which has a range from 0 to 1. Number on top of each membership function represents the chronological age group. Multiple numbers appear together if membership functions for adjacent groups were merged, for instance, age group 0 and 1 in (a). These membership functions were derived from the data collected from each age group.
A firing strength for each output membership function is computed. Then a max–min rule operation was applied to combine the inputs logically to produce output response values for all expected inputs. It took two steps. A min fuzzy operation was first applied to integrate the multiple inputs of features for each output class. Then the active conclusion was combined by finding the max from all the classes.
Take the Capitate of Caucasian male as an example, after feature extraction it yields input features (size: 89.5, eccentricity: .636, triangularity: .0294) shown in Fig. 15(a)–(c), an output membership function (CAD bone age based on the Capitate) was derived shown at the bottom graph of Fig. 15(d).
Fig. 15.
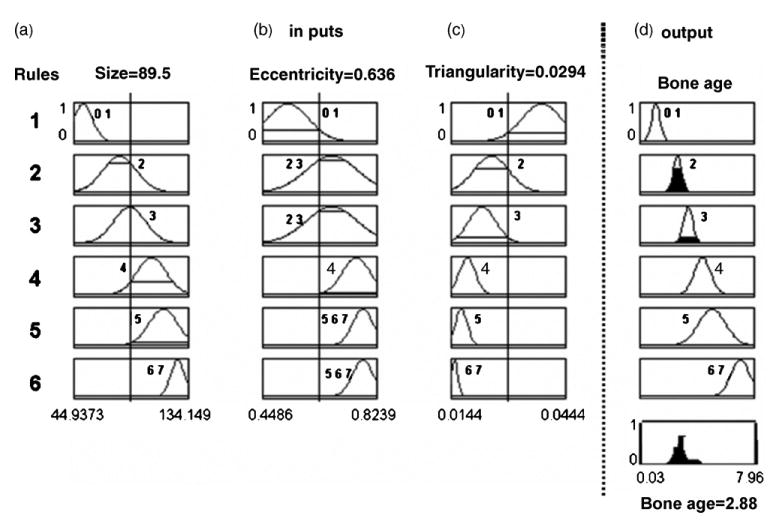
An example of using fuzzy classification for CAD bone age assessment of a given Caucasian male based on membership functions depicted in Fig. 14. Membership functions for each of the three input features (size, eccentricity, and triangularity; columns a, b, and c), and one output which is the chronological age (column d), are reoriented vertically forming six rules (1, 2, …, 6) based on Fig. 14. Three extracted features from the hand image are: size: 89.5, eccentricity: .636, and triangularity: .0294, represented by three vertical lines at each of the three columns, respectively. The output is the aggregation of the solid areas under each rule, which yields a crisp CAD bone age as 2.88-year-old shown in the bottom graph in column (d).
A final output (CAD bone age) needs to be aggregated from the sub-systems based on the Capitate and the Hamate, respectively. It was determined by finding the logic mean of the two outputs. The defuzzification process used center of gravity method to obtain a final CAD bone age.
2.7. System evaluation
Three types of tests were conducted to evaluate the performance of using the fuzzy logic for bone age assessment. Test 1 separated the data into eight categories of four races and two genders. Classifiers were trained and tested on each case from each category. Test 2 had two categories for female and male with four races combined together. Test 3 combined the entire data collection into one universal category.
For the above three tests, CAD bone age assessed by fuzzy classification was evaluated against chronological age which was taken as the gold standard as the normality of each case was ensured. The same evaluation was performed on readings. The CAD bone age results were plotted with the average reading of two radiologists against chronological age. The mean difference of each of the two readings versus chronological age or CAD bone age versus chronological age was computed by paired t-test.
3. Results
Hand images for females of age groups from 0 to 5 and males from 0 to 7 from the entire data collection of 205 images went through the carpal ROI analysis, including carpal bone segmentation, feature extraction and fuzzy classification for bone age assessment. The segmentation and CAD bone age results are presented in this section.
3.1. Segmentation success rate
Due to the reasons described in Section 1, phalangeal ROI segmentation is not reliable for young children. The comparison of the bone age assessment results for both female and male using phalangeal versus phalangeal and carpal features together are shown in Fig. 16. The striped bars show the percentage of successfully processed cases with phalangeal ROI only. However, after carpal ROI analysis was included, the percentage of successfully processed cases (gray bars in Fig. 16) was improved significantly especially for age groups from newborn to 3 years. Fig. 15(a) shows the results for female and (b) for male.
Fig. 16.
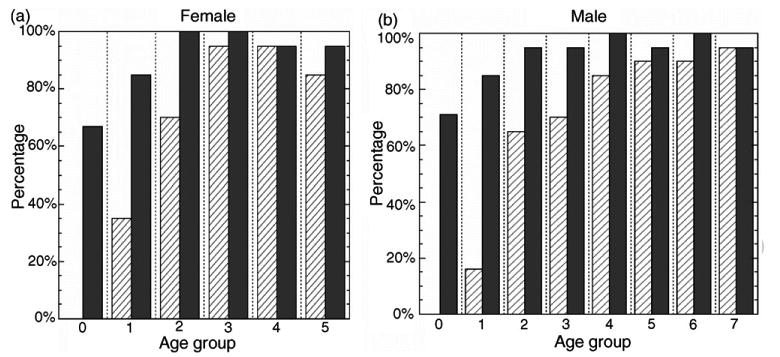
Percentage of successfully processed cases of all four races. Striped bars represent the percentage for phalangeal ROI analysis only and gray bars stand for the percentage after the inclusion of carpal ROI. (a) is for female of 6 age groups from 0 to 5 and (b) is for male of 8 age groups from 0 to 7.
The results show that the percentage of success rate is close to 100% at age above 2-year-old. For case below 2 years, the success rate is about 80%. This is due to the general poor contrast of hand images for young children because of the low bone density and thick soft tissue. It leads to the difficulty in segmenting the carpal bones from background. This could be improved by using adaptive diffusion parameters based on the contrast of individual carpal ROI image and will be considered for future work.
3.2. Plots
The CAD results based on carpal ROI were compared with the average reading of two radiologists. Fig. 17 shows the results set for eight categories from test 1. Fig. 18 is the results set for two categories from test 2. Fig. 19 is for the universal category from test 3. The CAD results generally follow the average reading of two radiologists comparing with the chronological age.
Fig. 17.
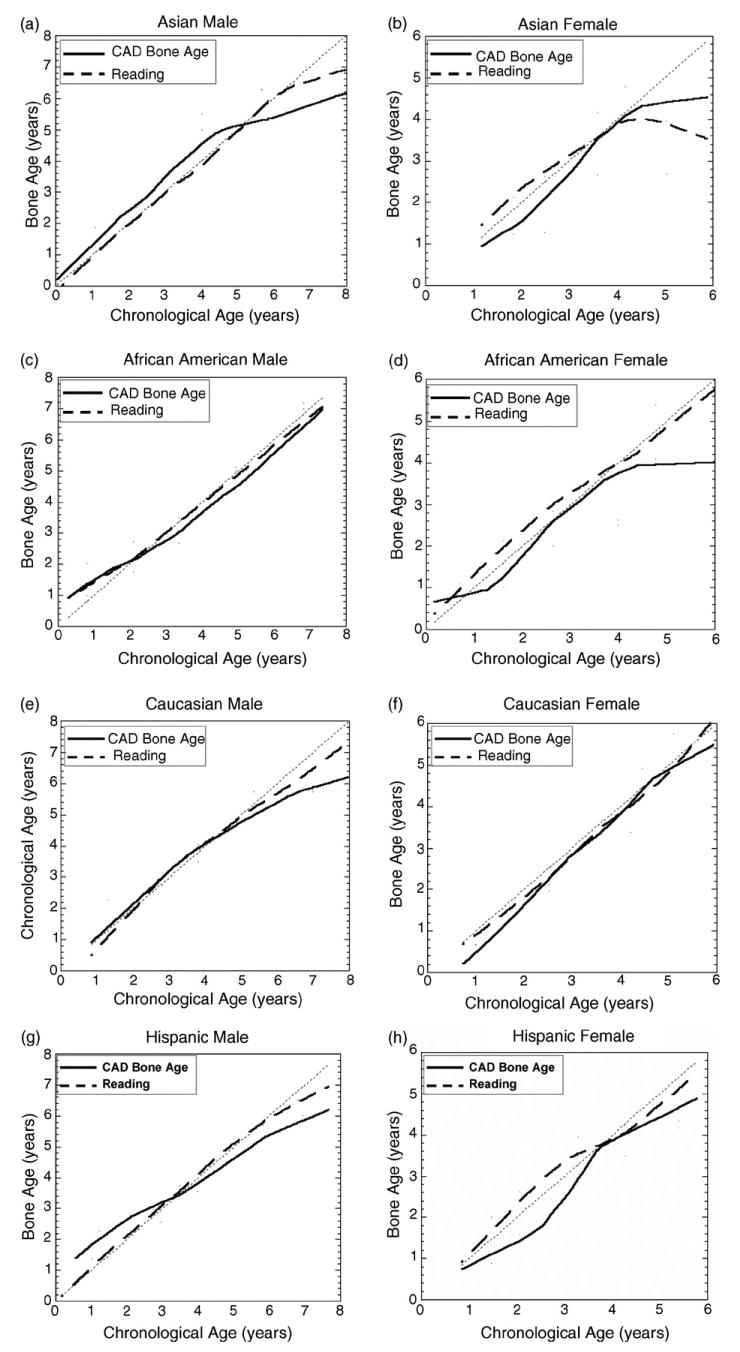
Results from the test with race and gender separated. In each plot, the solid line represents the CAD results and dashed line represents the average reading of two radiologists. See Section 4 for discrepancies.
Fig. 18.
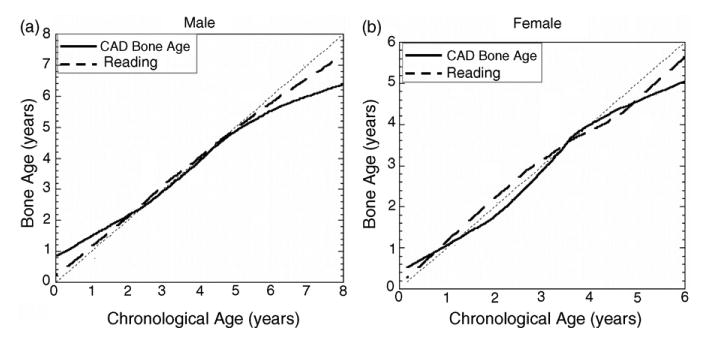
Results from the test for two genders with four races combined. In each plot, the solid line represents the CAD results and dashed line represents the average reading of two radiologists. See Section 4 for discrepancies.
Fig. 19.
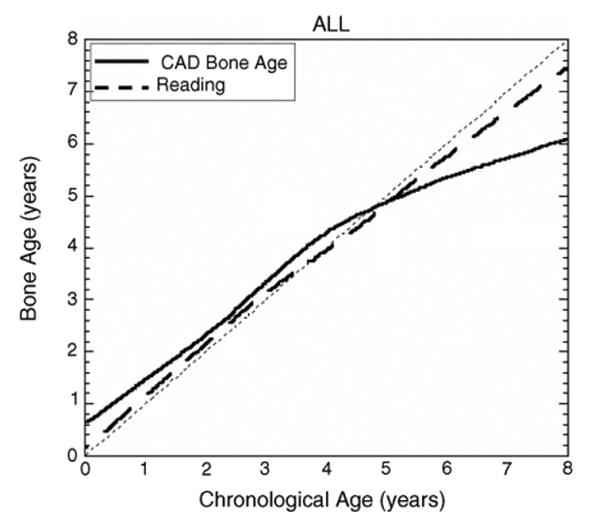
Results from the test for one universal category with both races and genders combined. In this plot, the solid line represents the CAD results and dashed line represents the average reading of two radiologists. See Section 4 for discrepancies.
3.3. CAD evaluation
Paired-samples t-test for the above three tests was performed against chronological age for two readings and CAD result. The following tables show the mean difference between reading 1, reading 2 and CAD result versus chronological age. The number with asterisk represents the difference is significant at p-value < .05.
From the evaluation Tables 3 and 4, we can see that the CAD result based on carpal ROI analysis is comparable to the readings within the mean difference of half year.
Table 3.
CAD evaluation for test 1 with races and genders separated
| Asian | African-American | Caucasian | Hispanic | ||||||||
|---|---|---|---|---|---|---|---|---|---|---|---|
| Female | Male | Female | Male | Female | Male | Female | Male | ||||
| Reading 1 | .19 | −.05 | −.08 | −.13 | .12 | .02 | .07 | −.04 | |||
| Reading 2 | .19 | .23 | .01 | −.03 | .14 | .25* | −.11 | .08 | |||
| CAD BA | .46* | .16 | .27 | .12 | .28* | .20 | .36* | .20 | |||
| Number of cases | 21 | 28 | 21 | 30 | 22 | 34 | 22 | 27 | |||
p-Value < .05, significant mean difference (in year).
Table 4.
CAD evaluation for test 2 with two genders, each gender is combined with four races, and test 3 has only one universal category
| Test 2 | Test 3 | ||
|---|---|---|---|
| Female | Male | ||
| Reading 1 | .08 | −.05 | .00 |
| Reading 1 | .06 | .13* | .10* |
| CAD BA | .25* | .20* | .01 |
| Number of cases | 86 | 118 | 204 |
p-Value < .05, significant mean difference (in year).
4. Discussion and conclusion
A method of carpal ROI determination, carpal bones segmentation, feature extraction and fuzzy classification for bone age assessment was developed and tested on the 205 young children from the data collection in the digital hand atlas (see Section 1). The percentage of successfully processed cases was improved significantly over the one with phalangeal ROI analysis only. This demonstrates that the feature extraction of carpal ROI is reliable for young children (third column, first row of Table 1).
The CAD results by fuzzy classification were evaluated by comparison with readings and chronological age. The CAD results shown in Section 3.2 based on carpal ROI features follow the readings comparing with chronological age, with the verification from statistical analysis in Section 3.3. The results verified the value of carpal ROI in assessment of skeletal development for young children.
Furthermore, carpal ROI has advantages over phalangeal ROI in bone age assessment for young children in that the appearance of carpal ROI in the radiograph is not influenced by finger bend and hand rotation during acquisition. This happens frequently since straight fingers and upright position of the hand is hard to achieve in young children.
However, a general observation could be drawn from the curves of Figs. 16–18, that the CAD results have large discrepancy to the chronological age after age of 5.50 for male and 4 for female. This phenomenon appears in radiologists readings also. The possible reason is that after this point, the growth of Capitate and Hamate slow down and carpal ROI does not reflect very accurate information. The other bones which appear later than Capitate and Hamate, identified by the knowledge-based model (Fig. 10) could be taken into consideration to improve the accuracy for these age groups by augmentation of feature space for bone age assessment.
The diverse growth patterns in different race and gender were observed from curves of average reading of radiologists shown in Fig. 16. This justifies that it is necessary to distinguish the race in bone age assessment. Two evaluations of two readings in Tables 3 and 4 show the inter-observer discrepancy between two radiologists on the same data collection.
The CAD bone age based on carpal ROI could be integrated with phalangeal ROI to provide more accurate bone age assessment. With up-to-date data collection and objective and fully automatic bone age assessment, the CAD system integrated with PACS [19] could provide the radiologists second opinion and help improve the accuracy in clinical practice.
Acknowledgments
This work has been supported by NIH R01 EB 00298.
Biography
Ms. Aifeng Zhang received her bachelor degree in optoeletronics and master degree in physical electronics from Nanjing University of Science & Technology, China in 1999 and 2002, respectively; PhD in image processing and image informatics at the Department of Biomedical Engineering, USC in 2007. She joined the Image Processing & Informatics Laboratory, Department of Radiology as a research assistant. During the past 4 years she has become a key researcher in the Digital Hand Atlas project. Her PhD dissertation is to augment and extend carpal bone analysis with the existing phalanges analysis to improve accuracy of computerized bone age assessment for children less than 7 years old based on normal digital hand images from four ethnic origins and two genders. Her other research interests include medical image segmentation, feature extraction and fuzzy classification, statistical analysis of medical data, data mining in medical imaging informatics and PACS.
Arkadiusz Gertych received the master degree in 1995 and the PhD degree in 2003 in electrical engineering from the Silesian University of Technology, Poland. In 1996 he started working for Silesian University of Technology in Department of Biomedical Electronics and from 2003 he is also an Assistant Professor at this University. From 2004 he continues post-doctoral studies at University of Southern California Department of Radiology in Image Processing and Informatics Laboratory in Los Angeles. His research activities include signal and image processing, design and development of computer-aided (CAD) medical diagnosis support systems, radiation therapy systems and medical informatics.
Dr. Brent Liu earned a PhD degree from the UCLA Biomedical Physics Graduate Program and performed research as a Post Doctorate. He is currently has a joint appointment with the Departments of Radiology, Keck School of Medicine, and Biomedical Engineering, Viterbi School of Engineering. He is also a senior research staff member of the Image Processing and Informatics Laboratory located at Marina del Rey. He has implemented fully filmless PACS in a clinical setting within the Imaging Department of both a high-profile community hospital (Saint John's Health Center, Santa Monica) and a high-profile academic hospital (UCLA) that has multiple campus sites and is currently advising multiple hospitals on their PACS process, including the USC Health Science Campus. His research areas of interest include Medical Imaging Informatics, Picture Archiving and Communication Systems (PACS) clinical uptime and usability, new PACS technology, Disaster Recovery for PACS, design and implementation of high-resolution image display workstations, next generation Internet and its clinical applications, and advances in the area of image processing and information management for healthcare including Security and HIPAA-compliance related issues.
References
- 1.Tanner JM, Healy MJR, Goldstein H, Cameron N. Assessment of skeletal maturity and prediction of adult height (TW3 method) London: WB Saunders; 2001. [Google Scholar]
- 2.Kirks D. Practical pediatric imaging, diagnostic radiology of infants and children. 1. Boston/Toronto: Little, Brown & Company; 1984. pp. 198–201. [Chapter 6] [Google Scholar]
- 3.Greulich WW, Pyle SI. Radiographic atlas of skeletal development of hand wrist. Stanford, CA: Stanford University Press; 1959. [Google Scholar]
- 4.Pietka E, Gertych A, Pospiech S, Cao F, Huang HK, Gilsanz V. Computer assisted bone age assessment: image processing and epiphyseal/metaphyseal ROI extraction. IEEE Trans Med Imag. 2001;20:715–29. doi: 10.1109/42.938240. [DOI] [PubMed] [Google Scholar]
- 5.Pietka E, Pospiech S, Gertych A, Cao F. Integration of computer assisted bone age assessment with clinical PACS. Comput Med Imag Grap. 2002:1–12. doi: 10.1016/s0895-6111(02)00076-9. [DOI] [PubMed] [Google Scholar]
- 6.Cao F, Huang HK, Pietka E, Gilsanz V. Digital hand atlas and web-based bone age assessment: system design and implementation. Comput Med Imag Grap. 2000:297–307. doi: 10.1016/s0895-6111(00)00026-4. [DOI] [PubMed] [Google Scholar]
- 7.Zhang A, et al. Data mining for average images in a digital hand atlas. Proc SPIE Med Imag. 2004;5371:251–8. [Google Scholar]
- 8.Huang HK, Zhang A, Liu B, Zhou Z, Documet J, King N, et al. Data grid for large-scale medical image archive and analysis. Proceedings of the 13th ACM international conference on multimedia; 2005. pp. 1005–13. [Google Scholar]
- 9.Johnston FE, Jahina SB. The contribution of the carpal bones to the assessment of skeletal age. Am J Phys Anthrop. 1965;23:349–54. doi: 10.1002/ajpa.1330230408. [DOI] [PubMed] [Google Scholar]
- 10.Pietka E, Kaabi L, Kuo ML, Huang HK. Feature extraction in carpal-bone analysis. IEEE Trans Med Imag. 1993;12(1) doi: 10.1109/42.222665. [DOI] [PubMed] [Google Scholar]
- 11.Zhang A, Gertych A, Liu B, Huang HK, Pospiech S. Carpal bone segmentation and features analysis in bone age assessment of children. Proceedings of the RSNA conference; 2005. p. 688. [Google Scholar]
- 12.Perona P, Malik J. Scale-space and edge detection using anisotropic diffusion. PAMI. 1990;12(7):629–39. [Google Scholar]
- 13.Canny JF. Master thesis. Massachusetts Institute of Technology; 1983. Finding edges and lines in images. [Google Scholar]
- 14.Canny JF. A computational approach to edge detection. IEEE Trans PAMI. 1986;8(6):679. [PubMed] [Google Scholar]
- 15.Ross TJ. Fuzzy logic with engineering applications. 2. England: John Wiley & Sons Ltd; 2004. [Google Scholar]
- 16.Zadeh LA. Fuzzy sets. Inf Control. 1965;8:338–53. [Google Scholar]
- 17.Zadeh LA. Fuzzy logic. Computer. 1988;1(4):83–93. [Google Scholar]
- 18.Zadeh LA. Knowledge representation in fuzzy logic. IEEE Trans Knowl Data Eng. 1989;1:89–100. [Google Scholar]
- 19.Huang HK. PACS and imaging informatics: basic principles and applications. New Jersey: Wiley & Sons; 2004. pp. 504–7. [Google Scholar]


