

Abstract
An active, hardware-based retinal tracker was built into a clinical optical coherence tomography (OCT) system for stabilization of high-resolution retinal sections. The retinal tracker locks onto common fundus features, detects transverse eye motion via changes in feature reflectance, and positions the OCT diagnostic beam to fixed coordinates on the retina with mirrors driven by a feedback control loop. The system was tested in a full clinical protocol on subjects with normal and glaucomatous eyes. Analysis software was developed to co-align and co-add multiple fundus and OCT images and to extract quantitative information on location of structures in the images. Tracking was highly accurate and reproducible on all but one subject resulting in the ability to scan the same retinal location continually over long periods of time. The results show qualitative improvement in nearly all co-added OCT scans and a reduction in the variance of the position of the optic disc cup edge to less than one pixel. The tracking system can be easily configured for ultrahigh-resolution OCT systems for advanced image modalities. For example, tracking will allow full three-dimensional scans of the retina, the duration of which is currently effectively prohibited by eye motion.
Keywords: Retinal tracker, image stabilization, optical coherence tomography, glaucoma, retina, low-coherence imaging
1. Introduction
Optical coherence tomography (OCT) has rapidly become a standard clinical tool for ophthalmologist in the diagnosis of retinal diseases [1]. OCT uses heterodyne detection of backscattered low coherence light scanned transversely and axially to produce high-resolution two-dimensional sections of tissues. In the eye, OCT has been used to image macular edema [2], macular holes, retinal detachments [3], and retinal vein occlusions [4], among other conditions. One of the most promising applications of OCT in ophthalmic imaging is for the early diagnosis of glaucoma [5]. This application requires accurate and reproducible measurement of retinal nerve fiber layer (RNFL) for multiple patient visits over an extended period of time. Clinical OCT instruments manufactured by Carl Zeiss Meditec Inc. (CZMI) have been shown to produce highly accurate maps of RNFL [6].
Although the image orientation for OCT differs from other types of retinal diagnostic techniques such as flash fundus photography and scanning laser ophthalmoscopy (SLO), OCT is limited by the same physical parameters as other imaging types. For example, OCT and SLO both use focused coherent light and are therefore restricted by ANSI standards to certain radiant exposure levels delivered to the eye. In order to collect photons at a sufficient signal-to-noise ratio to produce high quality images, the frame rate must be kept low [7]. Another limitation in retinal imaging is imposed by involuntary eye motion (e.g., microsaccades), which conversely requires very rapid frame rates to produce crisp images. Even in patients that are ideal fixators, eye motion amplitude may be several hundred microns, much larger than the resolution of the recently released third-generation CZMI OCT instrument (Stratus). Also, patients with diseases such as glaucoma require image registration over long periods of time (i.e., years) in order to accurately track disease progression. Moreover, advanced imaging modalities, such as full three-dimensional maps of the retina, are currently impossible because of the duration of the scan. OCT is therefore ideally suited for application of a retinal tracking technique.
We have modified and tested a commercial clinical OCT system to include an active, hardware-based retinal tracker for image stabilization. The new instrument, called tracking optical coherence tomography (TOCT), uses a laser beam dithered on common fundus features and phase sensitive detection to track eye motion [8]. This type of retinal tracker is distinguished from other eye trackers in both target and speed. Most eye trackers target the anterior segment, such as those active trackers that use Purkinje reflections from the cornea. To register frames, other eye trackers use a passive software-based image processing approach, limited by camera frame rate. The retinal tracking system operates with a closed loop bandwidth in excess of 1 kHz, which thereby renders OCT scans insensitive to all rotational (but not torsional) eye motion. This paper describes the TOCT, clinical trials to characterize tracking improvement, and software developed to analyze clinical results.
2. TOCT System Overview
The TOCT is comprised of a hardware-based, active retinal tracker incorporated into a clinical OCT II instrument, manufactured by CZMI. A picture of the optical head of the TOCT instrument is shown in Fig. 1. The retinal tracking software user interface, written in LabVIEW (National Instruments Inc.), was run on a separate computer from the OCT system. The computer also housed a real-time digital acquisition processor (DAP, Microstar Laboratories Inc.) and an analog framegrabber (National Instruments Inc.). Several instrumentation boxes contained detection, signal processing, and power supply electronics for the retinal tracker.
Figure 1.

Photograph of TOCT system. a. Clinical prototype (tracking optics enclosed on left), b. Picture with tracking optics exposed.
Figure 2 is a diagram of the optical components of the TOCT system modeled with optical design software (Zemax Inc.). A complete description of the principle of operation of the retinal tracker can be found elsewhere [9,10]. The retinal tracking system consists of a confocal reflectometer and tracking mirrors. The tracking beam is dithered on a retinal target with scanners and the reflectance signal from that target is used to control the position of tracking mirrors, through which both the tracking and OCT beams pass. The low-coherence OCT beam is collimated in the scanner space with a beam diameter of 5 mm. The pupil of the eye is imaged between the two dither scanner mirrors. The tracking and OCT beams are combined by transmission through and reflection off a dichroic beamsplitter. This arrangement, which requires no less than 20 nm of separation between the edge of the OCT spectrum and tracking beam wavelength and the sharpest possible filter cut-on at 850 nm, eliminates the need for troublesome re-imaging of the tracking beam. The result is the ability to aim the OCT beam and tracking beam independently of each other. The tracking mirrors were placed as close as possible to the back surface of the 60-mm scan lens. This provides the maximum tracking range without vignetting and maintains equal angular magnification for the x and y tracking mirrors.
Figure 2.
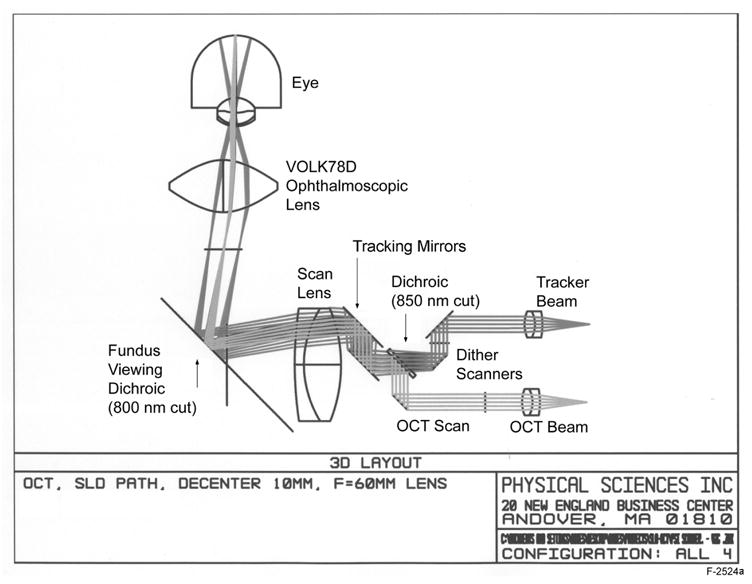
Optical layout of TOCT system as modeled in Zemax optical design software.
Due to the high longitudinal magnification (~16:1) of the scanning optics path, the scanning mirrors were separated from each other by only about 0.5 mm at the eye pupil plane conjugate. This design provides a fairly simple and reliable interface to the eye, with an ophthalmoscopic objective that provides the required field-of-view at the retina. The placement of the OCT scanning mirrors and dither scanners very near the pupillary conjugate insures that OCT and tracking beams will pass through the cornea at the full scan angle range without significant vignetting. The optical system is de-centered, which eliminates unwanted reflections but causes slight astigmatism.
The fundus viewing path of the OCT II uses another dichroic beamsplitter to separate the illumination wavelengths (400 to 700 nm) from the OCT band (800 to 840 nm). The coating of the fundus viewing beamsplitter was designed by CZMI for efficient reflection at ~35-deg incidence angle from 800 to ~860 nm. Since the tracking beam must also be efficiently turned by this beamsplitter, a 2-mW (typically ~25 μW at the cornea), narrowband 860-nm VCSEL laser diode (Lasermate Corp) was used to fulfill the beam wavelength separation requirement of the first dichroic beamsplitter. The transmit and receive ports of the tracker reflectometer were coupled to the VCSEL source and an avalanche photodiode detector (Hamamatsu Inc.) via multi-mode fibers with a range of core sizes to control tracking beam size. (The receive port is not shown in Fig. 2.) A 100-μm diameter core fiber was used in the clinical trials for tracking on the optic nerve head, which produced a ~350-μm beam diameter at the retina. Smaller fibers that produce a smaller tracker beam diameter may be more appropriate for tracking other targets such as blood vessel junctions. To eliminate possible tracking interference from the OCT beam itself, an 860-nm, 10-nm FWHM bandpass filter was used in front of the detector.
Although the optical paths of the OCT and retinal tracker instruments were combined, the software and user interface for both systems remained essentially independent from one another. CZMI software controlled, acquired, and displayed the OCT scans. The retinal tracker control software and user interface were similar to other implementations of retinal tracking [9–11]. The TOCT functioned quite robustly even though the two systems were not fully integrated into a single platform.
3. Clinical Trial Protocol and Procedure
The clinical protocol called for a series of OCT scans to be collected both with and without the retinal tracker engaged on 3 visits to the clinic. Two groups of subjects were recruited, one with normal, healthy eyes and one with glaucomatous eyes. The tracking feature for all scans was the lamina cribrosa, a bright layer within the optic nerve head. Lamina cribrosa is generally a stable, robust feature with characteristics suitable for tracking. The sequence of OCT scans used in this protocol for each visit is listed in Table 1. For each type of scan, the order of scans acquired with and without tracking was randomized. Figure 3 illustrates the scan types listed in Table 1. The circle scans were centered on the optic disc (Fig. 3a). The scan length (circumference) of the circle scan is 10.85 mm, corresponding to an angular diameter of ~12 deg and a resolution of 108.5 μm (100 pixels). The circle scan is generally used to measure retinal nerve fiber layer (RNFL) thickness around the optic disc to screen or monitor subjects with glaucoma. The radial scan set consists of 6 scans successively rotated by 60 deg and centered either on the optic disc or the fovea (Fig. 3b and 3c). The scan length of the radial scan is 5.9 mm or ~20 deg and the resolution is 59 μm. The radial scan is used to generate a map of a large region of the retina for measurement of RNFL or retinal thickness.
Table 1.
Scan type and number for each subject visit in the clinical protocol.
| trials | na | Scan type | Target | Nb | |
|---|---|---|---|---|---|
| 1. | 1 | 20 | Circle | Optic disc | 40 |
| 2. | 3 | 6 | Radial | Optic disc | 36 |
| 3. | 3 | 6 | Radial | Fovea | 36 |
|
| |||||
| TOTAL | 112 | ||||
Number of scans in each set
Total number of scans in all sets (tracking and non-tracking)
Figure 3.

Fundus images illustrating OCT scan types used in this clinical trial. a. Disc circle scan (single fundus image), b. Disc radial scan, c. Fovea radial scan. Fundus images of radial scans were created by co-adding 6 individual images while the tracker was engaged. (Normal Subject 10, OD)
A total of 11 subjects with normal healthy eyes and 11 subjects with glaucomatous eyes were scanned in the full protocol. Women comprised 45% and minorities (Asian-American and African-American) comprised 14% of the study group. The median age (range) for the normal group was 39 (26–58) and for the glaucoma group was 70 (42–85). In addition, 2 normal subjects partially completed the full protocol (single complete visits) and 4 more were scanned to test tracking fidelity. Of the 28 scanned, only 1 was disqualified from participation due to a condition that affected tracking. This condition, known as spontaneous venous pulsation, which causes vessels within the optic nerve head to collapse when the intraocular pressure exceeds the venous pressure during the cardiac cycle, caused a modulation in the reflectance with heart rate from the vessel that lay over the lamina cribrosa. Although this modulation did not prevent the system from tracking, the tracking position shifted during the cardiac cycle and made image registration impossible. Three glaucoma subjects also exhibited multiple tracking loci within the lamina cribrosa. Although tracking was robust on individual loci, this characteristic of lamina cribrosa for a fraction of patients may lead to errors if tracking is initiated on different loci within the same scan set.
4. Analysis Methods
The goal of the clinical protocol was to measure, both qualitatively and quantitatively, the transverse image registration achieved by TOCT compared to that achieved by the unaided subject who is asked to fixate. The amplitude of involuntary microsaccades for a good fixator is approximately 0.3 deg. If drift and other types of fixational eye motion are also considered, a reasonable estimate for the amplitude of eye motion while a healthy subject fixates is ~0.5 deg (~150 μm). For circle and radial OCT scans respectively, this equates to approximately 1.5 and 3 pixels. Since reproducibility in scan-to-scan registration is the ultimate measure of success, the appearance and position variance of landmarks in co-added images will be the primary analysis endpoint. Image co-addition is generally used to increase signal-to-noise, since the noise varies inversely with the square root of the number of measurements. Therefore, even images co-added with fixation (without tracking) will show substantial improvement over single scans. Comparison of qualitative improvement in co-added OCT images can be accomplished by observation of the sharpness of fine structures and layers within the retina. One type of fine structure that is readily apparent in the co-added cross-sectional images is blood vessels, which leave a shadow in the regions below them due to the relatively high extinction of blood at these wavelengths.
Although the accuracy of the tracking system was found to be <0.05 deg (~15 μm) in other implementations of retinal tracking (TSLO) [9], the analysis of OCT images from this protocol is not expected to yield similar results because the scan resolution for the OCT II platform is much larger. The tracking accuracy measured from OCT scans will therefore scale with image resolution until the image resolution is lower than the ultimate noise-limited performance of the tracking system.
The OCT analysis software developed by CZMI, which provides quantitative information on retinal and RNFL thickness, was not a suitable measure of the improvement due to retinal tracking. The reason for this is that the shallow gradients of these layers, even in subjects with glaucoma, renders such measures less sensitive to motion. In other words, the appearance of the co-added scans is quite similar because the layer thickness does not change rapidly in the retinal plane. Therefore, we developed a library of software routines (with simple graphical user interfaces, GUIs) in LabVIEW g-programming language (National Instruments Inc.) specifically designed to automate the process by which qualitative and quantitative measures of the improvement due to tracking are collected from the large data set of each subject. The software includes the following overall functions: (1) An alignment algorithm was written to register and co-add fundus images for an en face view of the retinal region scanned. (2) A z-axis alignment algorithm was created for use on all sets of OCT scans to be registered and co-added. (3) An edge position measurement algorithm was created to provide a measure of the variance of the position of a landmark edge in a set of individual scans. These functions are discussed in detail in the following sections. In addition to these algorithms, the software library included functionality to read, write, and resize OCT and fundus images, stretch and equalize all images, sort and display OCT and fundus images within various data sets, remove poor quality images or those collected in error, set analysis parameters from dialog boxes from the GUI front panel, and save analysis data.
4.1 Fundus Image Registration Software
For each OCT scan collected, a fundus image is also saved. Although the quality of the fundus images is poor compared to other types of ophthalmic imaging technologies (i.e., scanning laser ophthalmoscopy), they show sufficiently good detail of retinal features to provide useful qualitative information on tracking accuracy and reproducibility. Therefore, a software program was devised and developed to co-align sets of fundus images. The software algorithm works by registration of all images in a set to the position of the OCT beam. If the eye moves with respect to the OCT scan, fundus features will appear blurry in the co-added image. If the eye is made stationary with respect to the OCT scan, fundus features will appear crisp.
For circle scans, the approximate center of the OCT scan is first located. This can be done in an automated fashion since the tracker beam creates a bright reflection in the optic disc. Errors in automated analysis are created when corneal reflections are more intense than the reflection from the tracker beam. In this case, the center can be fixed or located manually. It is not important to locate the exact center at this point. Once the approximate center is located, a region demarcated by an annulus is examined. Changes in image intensity (i.e., edges) in a region described by a set of radial scans within the annulus (i.e., spokes) are measured. By careful selection of annulus and edge detection parameters, the OCT beam and its center can then be located precisely. Error checking is accomplished by throwing out analyses that result in an OCT circle beam diameter outside of a tight range around its known diameter. Once the center of the OCT beam is precisely located, the images can be shifted to a single location and co-added (zero-padded prior to shift and cropped after co-addition). For the radial scans, the procedure is similar, except that the OCT beam is located precisely be analysis of a rectangular region. All of the co-added fundus images displayed in this report were analyzed in this manner. The accuracy of the algorithm can be seen by comparison of the sharpness of the OCT beam in the co-added image to the sharpness in a single fundus image. In other words, if there is any blur in the OCT beam (or in the worse case scenario, multiple OCT beams), then it is clear that the algorithm failed. However, the sharpness of the OCT beam did vary from person to person because of the variance in fundus reflectivity, because many subjects had poor ocular optics that did not allow clear visualization of the fundus, and because the OCT beam was often inadvertently not correctly focused.
4.2 OCT Scan Registration Software
OCT analysis software generally contains an algorithm for z-axis registration. This algorithm is necessary to remove depth motion since OCT scans are acquired with high depth resolution such that the fast axis is the z-axis and the slow axis is in the transverse plane. Therefore, the time duration between adjacent transverse pixels is larger than that for other video rate en face imaging techniques (e.g., scanning laser ophthalmoscopy). Whereas SLO instruments, with an image duration of 33 ms but an extremely long confocal range gate in the eye, are more susceptible to transverse than depth motion, OCT instruments (i.e., OCT II), with 10 ms depth scan duration and 8–15 μm depth resolution, are susceptible to both. Depth motion is uncompensated in the transverse tracking system and therefore must be corrected for in all the images. Although the goal of typical OCT alignment software is to correct for depth motion in single images, alternate scan alignment software was developed to correctly co-align multiple sets of images.
The z-axis alignment algorithm was developed to align a weighted mean contour estimate to preserve real surface height information to the extent possible. This algorithm locates a feature or layer in every depth scan and aligns to the same z location all the depth scans from a set of images to be co-added. The layers are located by different edge detection algorithms. The edge detection algorithms were required to work equally well for every depth scan through different portions of the retina. For radial scans through the disc, the retinal or optic disc edge is easily located simply by finding the first pixel above a threshold as the pixel index (i.e., location in depth) is increased. Since the vitreous is transparent, there is a large sharp increase in pixel intensity when the retina or optic disc is encountered. A median filter is applied to the retinal edge to remove any errors that arise from spurious signals or pixel noise. The median filter rank is kept as small as possible to preserve edges and depth motion (subsequently corrected for). This simple method was extremely robust – very few errors inherent to the algorithm (choice of threshold or median filter rank) resulted during analysis of hundreds of images (and thousands of depth scans) from the study group even though the same parameters were used for every patient. This result occurred because the OCT reflectance gradient at the retina edge, which depended to a large extent upon the fixed OCT beam power, was fairly constant.
For radial scans through the fovea, the threshold algorithm described above is inappropriate because at the fovea, the OCT signal is extremely weak and thus the retinal edge not easily located. Therefore an algorithm was developed to locate what shall henceforth be called the retinal pigment epithelium (RPE) edge. (The exact retinal layers are still a matter of debate among clinicians and researchers alike.) The target edge here is between the photoreceptors, which have extremely low pixel intensity, and the second major bright layer in the OCT image caused by the highly vascular choriocapillaris. Since the thickness and brightness of every individual’s anterior retinal layers (RNFL to the photoreceptors) is variable, the region to threshold is unknown. However, since this region has the largest gradient, standard edge detection algorithms used for image processing can be employed. The algorithm implemented first applies a median filter to every depth scan, takes the derivative to locate sharp gradients, and uses a peak detection algorithm to find the two largest gradients. The rank of the median filter can be made large to minimize false peaks, as the rank will have only minimal effect over the location of the final peak. Absent excessive noise, these peaks result from the interface between the vitreous and retina and the photoreceptors and choriocapillaris where the change in pixel intensity is largest. The second peak is the target for this algorithm. Finally, a median filter with low rank is applied to remove any errors in the edge/peak detection algorithms. This algorithm was also very robust with very few errors in the hundreds of images analyzed.
Although the second algorithm worked well for radial scans through the fovea, it will not work for radial scans through the disc since there is no second edge corresponding to the RPE. Therefore, two different edge detection algorithms were necessary. For the disc circle scans, both algorithms worked reasonable well. In general, the retinal edge algorithm worked better, although for subjects with a thin RNFL thickness in this can region (i.e., glaucoma patients), the RPE edge algorithm frequently worked better.
The next step is to align multiple images so that they can be co-added. After the edge (retinal or RPE) of each image is located, a weighting factor, w, is calculated. This factor is derived from the fact that the greater the depth motion, the longer the pathlength of the edge for similar scans. Therefore, the weight was calculated as the inverse of the total pathlength (mean-squared distance calculation). For a set of n images, the mean shift, μ, is then calculated from,
where L is the retinal or RPE edge (i.e., a vector). Thus every depth scan in the set of images is shifted to a location that corresponds to the weighted mean of the set. In principle, by using a weighted mean of the location of the edge for several individual scans, motion artifact can be removed while anatomical contours maintained. In practice, some small amount of residual depth motion could remain in the image, particularly if the number of images co-added was small. Once the depth scans are shifted, the images are co-added.
The final step in the OCT scan registration software is to flatten the final co-added image. The procedure shifted the RPE edge in each depth scan of the co-added image to a fixed position. Flattening the RPE edge rather than the retinal edge preserves topographical information of the retinal surface. This last step is optional for the disc circle and fovea radial scans (it may aid in visualization of some structures within the retina but may distort the actual retinal curvature) but was not used for the disc radial scans, because the disc lacks an RPE layer.
4.3 Edge Position Measurement Software
The analysis algorithms in the preceding sections will result in the creation of co-added images for qualitative comparison. In order to establish a quantitative measure of tracking accuracy and reproducibility, the variance of the location of image landmarks with sharp gradients must be measured. In the radial disc scans, the edge of the disc is a clear and appropriate landmark. In the macular radial scans, the foveal pit is also a potential landmark. However, as already discussed, the bottom edge of the foveal pit is difficult to locate since it is absent the overlying layers (RNFL to outer nuclear layer) of the peripheral retina and the photoreceptors have extremely weak back-reflectance. In the circular disc scan, there are no clear landmarks to measure transverse position variance. In all scans, blood vessel shadows are potential markers but may not have sufficient contrast in the individual images to compare. In general, the retinal and choroidal layers do not have a sharp enough gradient to make a meaningful measurement. Because of these difficulties, we only report on measurements made on the relative location of the edge of the optic nerve head acquired with radial OCT scans. Future analysis may focus on extraction of quantitative information from the other types of scans.
After retinal edge detection but prior to depth scan registration, the full-width half-maximum (FWHM) of both the right and left edges was found. The algorithm finds the baseline, the maximum, and the index that corresponds to the FWHM point. It was important to perform the measurement prior to alignment as the re-registration process could mask transverse motion if there were spikes in the shift of individual scans because of movement of the edges. Thus the analysis was performed on essentially raw data and unfortunately was susceptible to errors caused by depth motion. It was also important to include both edges of the optic nerve head. Since eye movement is possible in every transverse direction, the vector component of motion normal to the OCT scan plane will cause out-of-plane errors and a change in the area of the optic disc cup during saccades. Therefore, the measured left and right edges of the disc cup may shift by different amounts for a non-symmetrical cup.
In order to facilitate accurate measurement of baseline and hence disc cup edge, a flattening algorithm was implemented (different from the final flattening of the co-added images described in Section 4.2). The algorithm measures the slope of the left and right baseline regions that do not include the disc cup (i.e., usually omitting the central 40 pixels), and shifts the scan (in the opposite direction) by the pixel value calculated from the slope. Since the region where the optic nerve head is located is omitted, no artifact is introduced to the edge location from the flattening. The software was written to assure that no discontinuities were introduced in the retinal edge from the flattening. In addition to the disc cup edges, the disc cup and foveal pit area were also measured by the software using discrete integration.
5. Results
5.1 Disc Circle Scans
The average fundus images with and without tracking for each visit of each subject were compared after application of the registration software detailed in Section 4.1. For a few visits, the OCT scan was not intense enough (due to poor ocular transmissivity) or the fundus images were of such poor quality that registration could not be completed. Approximately 20 images were co-added to produce the final average fundus image for the disc circle scan type. A qualitative improvement (sharpness of edges along vessels and the optics disc) was found in 94% and 82% of the visits for normal and glaucoma subjects, respectively. Of the visits where no improvement was seen, the original fundus images were often too unfocused to see sharp edges. Also, many of the fundus images collected were too dark because of vignetting on the pupil. Therefore, the averaged fundus images do not give a final measure of tracking improvement but merely indicate those fundus images where clear improvement occurred.
The average OCT disc circle scans were similarly compared after application of the registration and co-addition software detailed in Section 4.2. For the OCT images, the qualitative criteria for improvement due to eye motion stabilization were the number and width of blood vessel shadow edges, and the clarity of clearly identifiable features such as distinct retinal and sub-retinal layers. For example, the most posterior layer visible in OCT images is the choriocapillaris due to decreased signal caused by absorption and scattering from overlying structures. The degree to which these structures (vessels, etc.) can be visualized within this layer depends on the ability to stabilize eye motion. Improvement in OCT images taken with tracking compared to without tracking was found in 100% and 94% of the visits for normal and glaucoma subjects, respectively. Figure 4 and 5 present representative results from one normal and one glaucoma subject. Note the significant reduction of speckle noise in the averaged OCT images (Figs. 4b–c, 5b–c). Although improvement in the image signal-to-noise ratio (SNR) is clear in both averaged OCT scans (with and without tracking), it is equally clear that eye motion causes significant image feature blur. Also note the blurred retinal features in the co-added fundus images acquired without tracking engaged (Figs. 4f and 5f). Conversely, the co-added fundus images acquired with tracking engaged (Figs. 4e and 5e) retain almost all of the clarity of the retinal features of the single image (Figs. 4d and 5d).
Figure 4.
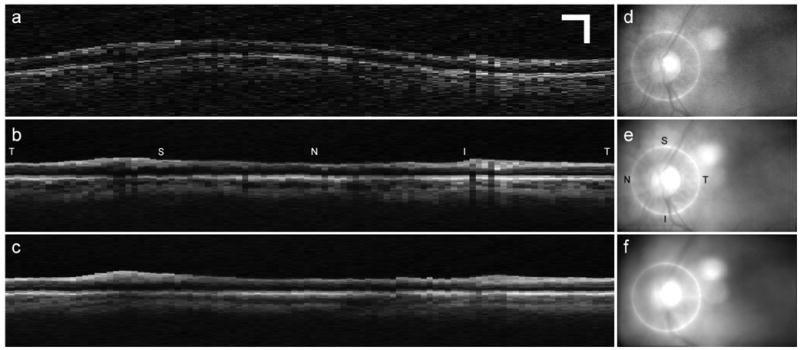
Representative disc circle scans for normal subject. a. Single OCT scan, b. Co-added OCT scan with tracking engaged, c. Co-added OCT scan with tracking disengaged, d. Fundus image corresponding to OCT scan in a., e. Co-added fundus image corresponding to OCT image in b., Co-added fundus image corresponding to OCT image in c. Scale bar for all images is 0.5 mm. (Normal Subject 5, OS). T: temporal, S: superior, N: nasal, I: inferior.
Figure 5.

Representative disc circle scans for glaucoma subject. Images arranged as in Fig. 4. (Glaucoma Subject 11, OD).
5.2 Disc Radial Scans
For the disc circle scans, a large number of consecutive images could be co-added and compared. For the radial scans (disc and macula), each set took several minutes and therefore only 3 each with and without tracking were acquired. The reduction of speckle noise and image improvement due to tracking is therefore less easily distinguishable in the three scan average. For this and other reasons, objective comparison of averaged images for the radial scans (disc and macula) was deferred. This analysis may eventually be performed to provide further characterization of any improvement that may be gleaned from the images.
Registration and edge analysis were applied to the disc radial scans as discussed in Sections 4.2–3. Figure 6 shows representative averaged OCT and fundus images for a normal subject with and without tracking. Note the marginal improvement of image SNR when co-adding 3 images compared to 20. Figure 7 plots the results of the edge detection algorithm. The motion is clear in Fig. 7a. Also note the change in the shape of the disc cup for run 3 – the lack of the flat trough seen in the other profiles. This indicates an out-of-plane error, where large eye motion 90 deg. to the direction of the OCT scan occurs.
Figure 6.
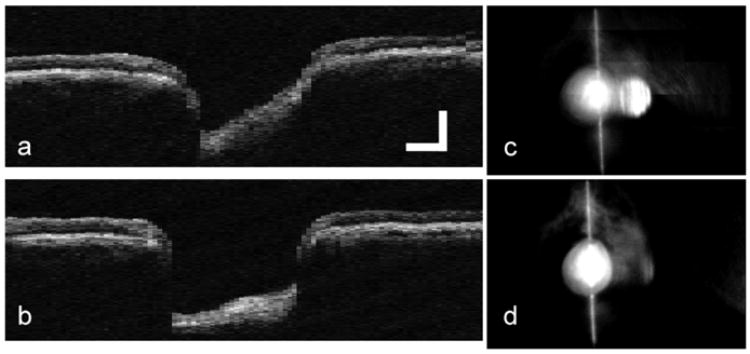
Representative disc radial scan (1 of 6 in a set). a. Co-added OCT scan with tracking disengaged, b. Co-added OCT scan with tracking engaged, d. Co-added fundus image corresponding to OCT scan in a., Co-added fundus image corresponding to OCT scan in b. (Glaucoma Subject 5, OS).
Figure 7.

Retinal edges for individual scans used to create images in Fig. 6. a. Tracker disengaged, b. Tracker engaged.
Tables 2 and 3 list the results of the disc cup edge position analysis for normal and glaucoma subjects. The third and fourth columns refer to the mean variance (standard deviation) in edge position for all sets of all visits (both left and right edge) for the tracking (T) and non-tracking (NT) trials. The standard deviation of each set of three scans was calculated, and then all scans (i.e., different radial angles) for all visits were averaged (n = 18 for 6 radial angles and 3 visits, tracking or non-tracking). The fifth column is the percentage of individual sets where the tracking standard deviation was less than the non-tracking standard deviation. The sixth and seventh columns are the percentage of individual sets where the tracking standard deviation is less than a fixed threshold, R, of 2 pixels.
Table 2.
Disc edge statistics for normal subjects analyzed from individual visits. See text for a description.
| Subject | Age | T avg [pixel] | NT avg [pixel] | T<NT [%] | T<Rb [%] | NT<Rb [%] |
|---|---|---|---|---|---|---|
| 1 | 26 | 0.98 | 1.46 | 0.50 | 0.89 | 0.69 |
| 2 | 47 | 1.32 | 3.25 | 0.75 | 0.81 | 0.44 |
| 3 | 33 | 0.50 | 1.65 | 0.81 | 1.00 | 0.72 |
| 4 | 39 | 0.65 | 2.05 | 0.81 | 0.94 | 0.58 |
| 5 | 34 | 0.50 | 1.87 | 0.92 | 1.00 | 0.75 |
| 6 | 50 | 0.85 | 1.52 | 0.78 | 0.94 | 0.64 |
| 7 | 58 | 0.70 | 2.13 | 0.88 | 1.00 | 0.63 |
| 8 | 34 | 0.64 | 2.27 | 0.92 | 0.97 | 0.39 |
| 9 | 50 | 0.74 | 2.37 | 1.00 | 1.00 | 0.45 |
| 10 | 54 | 0.63 | 1.48 | 0.79 | 1.00 | 0.79 |
| 11 | 39 | 0.63 | 2.58 | 0.94 | 1.00 | 0.44 |
|
| ||||||
| TOTAL | 39a | 0.76 | 2.07 | 0.82 | 0.95 | 0.59 |
median age
The threshold R = 2 pixels
Table 3.
Disc edge statistics for glaucoma subjects analyzed from individual visits
| Subject | Age | T avg [pixel] | NT avg [pixel] | T<NT [%] | T<Rb [%] | NT<Rb [%] |
|---|---|---|---|---|---|---|
| 1 | 42 | 0.81 | 2.24 | 0.83 | 0.97 | 0.56 |
| 2 | 74 | 1.12 | 1.78 | 0.81 | 0.81 | 0.61 |
| 3 | 85 | 1.82 | 3.2 | 0.77 | 0.66 | 0.31 |
| 4 | 70 | 1.03 | 3.24 | 0.64 | 0.92 | 0.25 |
| 5 | 57 | 0.51 | 2.00 | 0.96 | 0.96 | 0.58 |
| 6 | 77 | 0.96 | 1.71 | 0.75 | 0.92 | 0.67 |
| 7 | 68 | 1.04 | 2.07 | 0.82 | 0.85 | 0.58 |
| 8 | 55 | 1.07 | 1.74 | 0.71 | 0.86 | 0.67 |
| 9 | 70 | 1.91 | 2.48 | 0.67 | 0.78 | 0.47 |
| 10 | 75 | 1.17 | 2.54 | 0.79 | 0.85 | 0.39 |
| 11 | 63 | 0.75 | 1.66 | 0.81 | 0.92 | 0.69 |
|
| ||||||
| TOTAL | 70 | 1.13 | 2.25 | 0.77 | 0.86 | 0.53 |
5.3 Macula Radial Scans
Edge position analysis was also performed on the OCT scans collected from the foveal pit of each subject. However, since the signal is decreased in the fovea, the retinal edge is extremely difficult to measure regardless of the processing technique used. Therefore, a quantitative and automated analysis could not be completed for the macular scans because of the large number of software errors from retinal edge misidentification. Figures 8 and 9 show data collected on a glaucoma subject that had high enough brightness in the fovea to allow registration and measurement of retinal edge.
Figure 8.

Representative fovea radial scan. Images arranged as in Fig. 6. (Glaucoma Subject 10, OS)
Figure 9.

Retinal edges for individual scans used to create images in Fig. 8. a. Tracker disengaged, b. Tracker engaged.
5.4 Comparison of Scans from Multiple Visits
One of the significant improvements expected from TOCT is the ability to measure the same retinal location every time a patient is examined to monitor longitudinal progression of a disease or defect. To test the hypothesis that tracking improved the ability of the technician to return to a fixed retinal position, the variance in disc cup edge position for multiple visits was examined. For reasons related to platform integration, there were difficulties in comparing every visit of every subject that had nothing to do with tracking fidelity. The inter-visit results for normal and glaucoma subjects are listed in Tables 4 and 5 and displayed in Fig. 10 for one normal subject. Tables 4 and 5 are arranged in a similar manner as Tables 2 and 3. However, the values in the third and fourth column refer to the mean variance (standard deviation) in edge position calculated across visits. In other words, the standard deviation of 9 scans was calculated and then all scans for each radial angle were averaged (n = 6).
Table 4.
Disc edge statistics for normal subjects analyzed from multiple visits.
| Subject | # visits | T avg [pixel] | NT avg [pixel] | T<NT [%] | T<R [%] | NT<R [%] |
|---|---|---|---|---|---|---|
| 1 | 2 | 1.09 | 2.72 | 0.83 | 0.92 | 0.33 |
| 2 | 2 | 1.48 | 2.67 | 0.83 | 0.75 | 0.50 |
| 3 | 3 | 0.75 | 3.09 | 1.00 | 1.00 | 0.17 |
| 4 | - | - | - | - | - | - |
| 5 | - | - | - | - | - | - |
| 6 | 3 | 1.51 | 1.99 | 0.67 | 0.75 | 0.67 |
| 7 | 2 | 0.88 | 2.95 | 1.00 | 1.00 | 0.08 |
| 8 | 3 | 1.11 | 3.07 | 1.00 | 1.00 | 0.08 |
| 9 | 2 | 0.99 | 3.16 | 1.00 | 1.00 | 0.08 |
| 10 | 2 | 0.78 | 1.89 | 1.00 | 0.92 | 0.58 |
| 11 | 3 | 1.17 | 3.11 | 1.00 | 1.00 | 0.08 |
|
| ||||||
| TOTAL | 1.08 | 2.74 | 0.93 | 0.93 | 0.29 | |
Table 5.
Disc edge statistics for glaucoma subjects analyzed from multiple visits.
| Subject | # visits | T avg [pixel] | NT avg [pixel] | T<NT [%] | T<R [%] | NT<R [%] |
|---|---|---|---|---|---|---|
| 1 | 2 | 0.68 | 2.13 | 0.92 | 1.00 | 0.58 |
| 2 | - | - | - | - | - | - |
| 3 | - | - | - | - | - | - |
| 4 | 3 | 1.66 | 4.27 | 1.00 | 0.67 | 0.00 |
| 5 | 2 | 0.83 | 2.23 | 1.00 | 1.00 | 0.33 |
| 6 | 3 | 1.29 | 2.79 | 1.00 | 1.00 | 0.00 |
| 7 | - | - | - | - | - | - |
| 8 | 2 | 1.18 | 2.85 | 0.92 | 0.83 | 0.33 |
| 9 | 3 | 2.83 | 3.31 | 0.67 | 0.33 | 0.08 |
| 10 | 2 | 0.95 | 3.29 | 1.00 | 0.92 | 0.00 |
| 11 | 3 | 0.95 | 2.32 | 1.00 | 0.92 | 0.33 |
|
| ||||||
| TOTAL | 1.30 | 2.90 | 0.94 | 0.83 | 0.21 | |
Figure 10.

Representative OCT scans for multiple visits. a. Single OCT scan from one visit, b. Co-added OCT scan combined from three visits with tracker engaged, c. Co-added OCT scan combined from three visits with tracker disengaged. d. Fundus image corresponding to OCT scan in a., e. Co-added fundus image corresponding to OCT image in b., Co-added fundus image corresponding to OCT image in c. (Normal Subject 3, OD).
6. Discussion
To summarize results, robust, continuous, repeatable, and clinically useful tracking on the lamina cribrosa was achieved in 96% of subjects tested in the clinical protocol. Examination of co-added disc circle OCT images found an improvement in 100% and 94% of the images for normal and glaucoma subjects. Analysis of the mean variation in disc edge position found an improvement in every subject. The variation in individual sets found an improvement in 82% and 77% of intra-visit sets and a reduction in standard deviation from greater than 2 to approximately 1 pixel for normal and glaucoma subjects. Similar analysis found an improvement in 93% and 94% of individual inter-visit sets and a variance reduction from nearly 3 to approximately 1 pixel for normal and glaucoma subjects.
As noted above, the purpose of the disc circle scans is to measure RNFL thickness for early diagnosis of glaucoma. Although preliminary analysis of RNFL thickness found no improvement due to tracking [12], RNFL thickness may not be an appropriate measurement endpoint for the characterization of improvement due to tracking. This is because the effect of tracking may not be revealed within the typical RNFL standard deviation (≤10 μm with a ~120 μm mean). As seen in Figs. 4 and 5, the shallow gradients of these layers render such measures less sensitive to transverse motion. This does not mean that tracking is not effective in obtaining more accurate RNFL metrics, and therefore potentially more sensitive and specific glaucoma diagnosis. Rather it means that an improvement should be made in the methodology of standard clinical RNFL measurements. For example, in other current (e.g., OCT III) and future systems, there is an improvement in both transverse and longitudinal image resolution. This should inevitably yield higher precision values for RNFL thickness. Also, as illustrated by Figs. 4 and 5, an increase in the number of co-added images will significantly reduce speckle noise artifacts. This can only be accomplished with perfect registration from scan to scan. A 5% change in RNFL is significant loss. Without tracking, the effect of motion is masked by co-adding noisy scans. This constraint no longer exists with TOCT: boundaries will only become better defined by averaging because high image spatial frequencies are preserved with tracking.
In Figs. 4 and 5, the overall appearance of the averaged circle scans with and without tracking is similar because the layer thickness does not change rapidly in the retinal plane. However, with tracking the most significant improvement is in resolving fine structure. Shadows of major retina vessels and often the vessels themselves can be clearly seen. Note that considerably greater structure in the underlying choroidal vessels is also evident. Further, there is a subtle enhancement of the contrast at the outer boundary of the RNFL. These features are easily understood because tracking causes successive images to align in the transverse directions to much better precision than the ~110-μm pixel size. The positions of fine scale features never shift. Further, to the extent that transverse motion is uncompensated, the vertical alignment algorithm will also induce errors without tracking.
Since only three radial scans (disc cup and macula) at any angle were collected and co-added, the reduction of speckle noise is not as dramatic in Figs. 6 and 8. In Fig. 6a, the true shape of the cup is distorted because of out-of-plane motion (see below). The disc cup edge in Figs. 6a and b is broadened and blurred compared to Figs. 6b and d. Without tracking, vertical alignment suffers somewhat from motion – tending to make boundaries visibly fuzzier. In Fig. 8a, the foveal pit is not visible and the retinal boundary in this region blurred. Retinal layers visible on either side of the fovea (more clearly to the right) with tracking (Fig. 8b) are completely washed out in the non-tracking case (Fig. 8a). Tracking thus provides a benefit by making low contrast boundary detection more robust. But this benefit may not be resolvable with only three scans. The effect lies within the standard deviation of the image noise statistics for so few scans, at least for good fixators. Figure 9 also illustrates one reason why extraction of edge and area information from the foveal pit is more difficult than that for the disc cup: because the pit area is much smaller and the edges more shallow (note the 5× reduction in scale of Fig. 9 compared to Fig. 7). The other primary reason is that the OCT signal is reduced in the foveal pit because of the absence of overlying layers that are more highly scattering and thus produce a clear demarcation of retinal edge.
The appearance of images co-added from 3 visits in Fig. 10 is similar to the images co-added from single visits in Figs. 4 and 5. Since this subject (normal subject 3) was a fairly good fixator and for the reasons discussed above, the appearance of some layers is preserved in the non-tracking co-added OCT image (Fig. 10c). However, distinct layers of both the retina and choroid are blurred in the non-tracking image where they are clear and sharp in the tracking image (Fig. 10b). Moreover, the location of blood vessels, denoted by their shadows, are preserved and enhanced in comparison to the single scan (Fig. 10a). The effect of tracking as illustrated by the fundus images (Figs. 10d–f) is clear.
Before a full discussion of the quantitative analysis presented in Tables 2–5, one consideration of the method of data analysis alluded to in Section 4.3 must be fully explained. For many of the non-tracking scans, eye motion with a large vector component normal to the OCT scan was large enough to prohibit measurement of disc cup edge position. This large out-of-plane motion is illustrated in Fig. 11. In Figs. 11a and d, an appropriate scan through the center of the disc is made. In the very next scan, Figs. 11b and e, the motion was large enough so that no portion of the disc was scanned. Figures 11c and f show the co-added OCT and fundus images from this set. Obviously, the edge position of the disc cup cannot be measured for this large motion. Therefore, the entire set was thrown out. The effect of this is to make the standard deviation in Tables 2–5 for the non-tracking cases artificially lower than is actually the case. Mild out-of-plane motion is also illustrated in the retinal edge position in run 3 of Fig. 7a.
Figure 11.

Large out-of-plane motion, common only in the non-tracking case, made co-addition of images and measurement of disc cup edge impossible. a. Single OCT scan centered on disc, b. Single OCT scan with large position error, c. Co-added OCT image from 3 individual scans including a. and b., d. Single fundus image corresponding to OCT scan in a., e. Single fundus image corresponding to OCT scan in b., f. Co-added fundus image corresponding to OCT scan in c. (Glaucoma Subject 1, OD).
It is clear from the results of the disc cup edge analysis presented in Tables 2–3, that there was a wide range of fixators in both the normal and glaucoma groups. This can be seen in the “NT avg” column, which displays the variation in disc cup edge under normal, non-tracking conditions. It should be emphasized that the standard deviation calculation made in these tables is a measure of the variance and is different from the peak-to-peak amplitude of eye motion estimated in Section 4 to be 0.5 deg (~150 μm) or 3 pixels for radial scans for a good fixator. The peak-to-peak amplitude can be several (i.e., 2–4) times larger than the standard deviation. Thus a range from 1.46 to 3.25 for normal subjects and 1.66 to 3.24 for glaucoma subjects for the standard deviation means a wide range of fixators were present in the sample, with the normal subjects slightly better fixators overall.
Although the overall standard deviation (i.e., mean for all sets) was reduced for all subjects when tracking was engaged, an improvement was found in only 82% and 77% of individual sets for normal and glaucoma subjects, respectively. Further examination of the data shows that the normal subjects that had particularly low percentages were generally the best fixators (Table 2). For example, the three best fixators (subjects 1, 10, and 6) had three of the four worst percentages. This leads to the obvious conclusion that tracking will be less useful for good fixators subject to the transverse image resolution. That is, if the amplitude of involuntary eye motion in a subject is lower than the pixel resolution of the imaging technique, then tracking can only improve position accuracy to the size of an individual pixel. In current and future high-bandwidth OCT systems, the limiting factor may be tracking accuracy rather than pixel resolution. For example, the current CZMI OCT III (Stratus) system uses 500 transverse pixels, or an improvement of 5 fold in resolution to ~12 μm, near the tracking accuracy found in other systems (<15 μm for TSLO [9]).
The limiting factor of pixel resolution on tracking performance can also be seen in the overall reduction in standard deviation from tracking to non-tracking. While the non-tracking standard deviation in disc cup edge position is correlated to the physiological factors that determine involuntary eye motion amplitude, the tracking standard deviation is limited by the image resolution. We expect that as the transverse pixel resolution is decreased to the limit of tracking accuracy, the variation in edge position will remain between 0.5 and 1 pixel for most subjects with tracking engaged, but will increase to the pixel equivalent for the range of fixators tested without tracking engaged (from approximately 0.5 deg or 150 μm for the best fixators).
Although there is a slight difference in disc cup edge position standard deviation between normal and glaucoma subjects, the degree to which this difference is significant is not known. Most of the problems may be traced to factors unrelated to tracking. For example, some glaucoma subjects had intra-ocular lenses (IOLs) that caused a drastic degradation of the OCT signal. Although this didn’t affect tracking robustness, it made extraction of information from poor OCT images difficult. There was also an increase in other problems with the glaucoma group that were not related to the performance of the TOCT system (e.g., subject attentiveness, etc.). As mentioned previously, there were also several subjects in the glaucoma group that had multiple tracking points within the optic nerve disc. These patients require particular attention from the operator. Many of these problems are inevitable in a clinical environment. It is expected that in further clinical testing with higher resolution OCT instruments, the tracker should give transverse scan alignment absolutely equivalent to the normal subjects – better than is possible for even the highest functioning fixators. It is under such circumstances that the clinical value of TOCT will be most evident.
When the data is re-sorted to compare disc cup edge variance between visits (Tables 4 and 5), it is clear that tracking is even more important to register images from visit to visit. An improvement in overall standard deviation was again seen in all subjects, with improvement in 93% and 94% of individual sets. This increased improvement results from the capability of the tracking system to continually return the OCT imaging beam to the same pixel coordinates. Conversely, without tracking, the operator is relied upon to locate the same disc cup position from the mediocre fundus image. (For macular scans, this degradation from visit to visit may not be as profound because the OCT scan automatically goes through the center of the fixation point, that is, the fovea). Thus, between visits with tracking engaged, the disc cup edge position variation is less than a fixed threshold (2 pixels) the same percentage of time as within visits (see “T<R” column in Tables 2–5). However, for the same fixed threshold with no tracking, the percentage drops considerable between visits compared to within visits (“NT<R” column in Tables 4 and 5 compared to 2 and 3). This is also seen in the large increase from approximately 2 to 3 in the total non-tracking standard deviation. The slight increase in tracking standard deviation probably results from the accuracy of a calibration method (± 1 pixel), which was required to align coordinate axes of the OCT and tracker components of the TOCT. In a fully integrated system, we expect the tracking standard deviation to be identical within and between visits.
For the TOCT instrument, these results show a clear and significant enhancement of scan position accuracy and reproducibility for retinal tracking compared to fixation. Fine structure not readily resolved in single scans can easily be seen in averaged images. In the co-added images acquired without tracking, the finest scales are washed out – typically over three or more image pixels (over 300 microns at 110 microns per pixel, i.e., motion of ~1 deg). This motion occurs both laterally, and most problematically, in and out of the image plane. This blurring and distortion is particularly clear with scans through the disc with steep vertical features, at the fovea, and with circular scans with blood vessel and their shadows. The precise shape of cup, disc, and rim area is always certainly degraded by this effect. In multi-frame averages of circular scans around the disc, disc radial scans, and macular scans, the reduction in speckle noise is significant, while the fine structure is still clear. The vessel shadows line up perfectly in all tracked images taken over the hour-long visit duration in all subjects, boundaries are sharp, choroidal vessel structure is evident. For nearly all subjects, the effect of tracking is to make everyone a perfect fixator, regardless of age and eye motion characteristics. The observed level of transverse scan reproducibility appears to be consistent with the requirements for potential acquisition of high quality three-dimensional maps.
Acknowledgments
This work was funded by the National Institutes of Health (National Eye Institute) under grant EY13036. Both Physical Sciences Inc. (PSI) and Carl Zeiss Meditec Inc. (CZMI) provided partial support for the clinical tests.
References
- 1.Puliafito CA, Hee MR, Schuman JS, Fujimoto JG, editors. Optical Coherence Tomography of Ocular Diseases. Slack Inc; Thorofane NJ: 1996. [Google Scholar]
- 2.Massin P, Duguid G, Erginay A, Haouchine B, Gaudric A. Optical coherence tomography for evaluating diabetic macular edema before and after vitrectomy. Am J Ophthalmol. 2003;135:169–77. doi: 10.1016/s0002-9394(02)01837-8. [DOI] [PubMed] [Google Scholar]
- 3.Ikuno Y, Sayanagi K, Oshima T, Gomi F, Kusaka S, Kamei M, Ohji M, Fujikado T, Tano Y. Optical coherence tomographic findings of macular holes and retinal detachment after vitrectomy in highly myopic eyes. Am J Ophthalmol. 2003;136:477–81. doi: 10.1016/s0002-9394(03)00269-1. [DOI] [PubMed] [Google Scholar]
- 4.Spaide RF, Lee JK, Klancnik JK, Gross NE. Optical coherence tomography of branch retinal vein occlusion. Retina. 2003;23:343–7. doi: 10.1097/00006982-200306000-00009. [DOI] [PubMed] [Google Scholar]
- 5.Bowd C, Zangwill LM, Berry CC, Blumenthal EZ, Vasile C, Sanchez-Galeana C, Bosworth CF, Sample PA, Weinreb RN. Detecting early glaucoma by assessment of retinal nerve fiber layer thickness and visual function. Invest Ophthalmol Vis Sci. 2001;42:1993–2003. [PubMed] [Google Scholar]
- 6.accurate RNFL measurement Zeiss OCT reference
- 7.Rollins AM, Kulkarni MD, Yazdanfar S, Ungarunyawee R, Izatt JA. In vivo video rate optical coherence tomography. Opt Express. 1998;3:219–229. doi: 10.1364/oe.3.000219. http://www.opticsexpress.org/abstract.cfm?URI=OPEX-3-6-219. [DOI] [PubMed]
- 8.Daniel Ferguson R. Servo Tracking System Utilizing phase-Sensitive Detection of Reflectance Variation. #5,767,941 and #5,943,115 U S Patent.
- 9.Hammer DX, Ferguson RD, Magill JC, White MA, Elsner AE, Webb RH. Compact scanning laser ophthalmoscope with high speed retinal tracker. Appl Opt. 2003;42:4621–4632. doi: 10.1364/ao.42.004621. [DOI] [PubMed] [Google Scholar]
- 10.Hammer DX, Ferguson RD, Magill JC, White MA, Elsner AE, Webb RH. Image stabilization for scanning laser ophthalmoscopy. Opt Express. 2002;10:1542–1549. doi: 10.1364/oe.10.001542. http://www.opticsexpress.org/abstract.cfm?URI=OPEX-10-26-1542. [DOI] [PubMed]
- 11.Hammer DX, Ferguson RD, Magill JC, White MA, Elsner AE, Webb RH. Tracking scanning laser ophthalmoscopy (TSLO) In: Manns F, Söderberg PG, Ho A, editors. Proceedings of SPIE, Ophthalmic Technologies XIII. Vol. 4951. 2003. pp. 208–217. [Google Scholar]
- 12.Beaton S, Ishikawa H, Stein D, Ferguson RD, Hammer DX, Schuman JS. Nerve Fiber Layer (NFL) Thickness Measurement with Tracking OCT. presented at the American Glaucoma Society Meeting; Sarasota FL. 2004. [Google Scholar]