



Abstract
The off-resonance rotating frame technique based on the spin relaxation properties of off-resonance T1ρ can significantly increase the sensitivity of detecting paramagnetic labeling at high magnetic fields. However, the in vivo detectable dimension for labeled cell clusters/tissues in T1ρ -weighted images is limited by the water diffusion-exchange between mesoscopic scale compartments. An experimental investigation of the effect of water diffusion-exchange between compartments on the paramagnetic relaxation enhancement of paramagnetic agent compartment is presented for in vitro/in vivo models. In these models, the size of paramagnetic agent compartment is comparable to the mean diffusion displacement of water molecules during the long RF pulses that are used to generate the off-resonance rotating frame. The three main objectives of this study were: (1) to qualitatively correlate the effect of water diffusion-exchange with the RF parameters of the long pulse and the rates of water diffusion, (2) to explore the effect of water diffusion-exchange on the paramagnetic relaxation enhancement in vitro, and (3) to demonstrate the paramagnetic relaxation enhancement in vivo. The in vitro models include the water permeable dialysis tubes or water permeable hollow fibers embedded in cross-linked proteins gels. The MWCO of the dialysis tubes was chosen from 0.1 to 15 kDa to control the water diffusion rate. Thin hollow fibers were chosen to provide sub-millimeter scale compartments for the paramagnetic agents. The in vivo model utilized the rat cerebral vasculatures as a paramagnetic agent compartment, and intravascular agents (Gd-DTPA)30-BSA were administrated into the compartment via bolus injections. Both in vitro and in vivo results demonstrate that the paramagnetic relaxation enhancement is predominant in the T1ρ -weighted imaging in the presence of water diffusion exchange. The T1ρ contrast has substantially higher sensitivity than the conventional T1 contrast in detecting paramagnetic agents, especially at low paramagnetic agent volumetric fractions, low paramagnetic agent concentrations, and low RF amplitudes. Short pulse duration, short pulse recycle delay and efficient paramagnetic relaxation can reduce the influence of water diffusion-exchange on the paramagnetic enhancement. This study paves the way for the design of off-resonance rotating experiments to detect labeled cell clusters/tissue compartments in vivo at a sub-millimeter scale.
Keywords: off-resonance rotating frame, paramagnetic relaxation enhancement, diffusion-exchange effect, volumetric coefficient, imaging contrast, rat brain images, gadolinium chelates
1. Introduction
The paramagnetic relaxation enhancement in off-resonance rotating frame can increase the relaxivitiy and detection sensitivity of paramagnetic agents at magnetic fields higher than 3T [1]. The enhanced relaxation rate constant depends on several factors, including the hydration number q, the rotational correlation timeτR and the diffusion correlation time τD of T1-type agents, and the nano-particles’ diameter d of T2-type agents [1, 2]. These factors are critical to the smart labeling of molecular MR imaging. For instance, the alteration of hydration number reports the enzyme activations [3], the change of rotational correlation demonstrates the ligand binding [4-5], and the increase of relaxation rate indicates the DNA oliogmerizations [6]. The off-resonance rotating frame technique can amplify the small difference in the relaxation rate constant, thus, enables the smart labeling strategy to become very efficient at high magnetic fields. In our previous paper, we have reported a novel method to quantify τR of T1-type agents based on the paramagnetic relaxation enhancement effect in off-resonance rotating frame [2], whereτR was extracted through the measurement of various residual z-magnetization profiles or difference magnetization profiles of water protons in off-resonance rotating frame. This method can be further extended to quantify the alterations of other factors such as q, τD and d, and to distinguish the small difference between the relaxation rate constants for T1/T2 type agents. Since the paramagnetic relaxation enhancement increases as the square of magnetic field strength [1], high sensitivity is expected for the detection of paramagnetic agents at high magnetic fields.
For the in vivo applications, the challenge arises from the interference of other relaxation pathways. In our previous paper, we have reported various methods used to quantify and suppress the contribution from the magnetization transfer pathway, and the strategies used to extract the dynamics of paramagnetic agents in the presence of a strong magnetization transfer effect [7]. However, biological systems are highly heterogeneous and contain numerous mesoscopic scale compartments in various tissues. Assuming that paramagnetic agents are restrained in a single compartment, water molecules can diffuse in/out of the influence region of paramagnetic agent molecules and exchanging between different compartments via Brownian motion. Thus, the long off-resonance pulse, which is used to generate the effective field for off-resonance rotating frame, induces magnetization transfer inside tissue compartments [7] and allows water diffusion-exchange between different compartments. This raises an important and fundamental question for in vivo applications besides the magnetization transfer effect: how are the NMR signals affected by the water exchange between different compartments? Normally, the relaxation rate in the paramagnetic agent compartment is much higher than that in the tissue compartment (no paramagnetic agents). Thus, the diffusion-exchange between the tissue compartment and the paramagnetic agent compartment reduces the water relaxation rate for the paramagnetic agent compartment. This effect depends on the properties of compartment boundary. With water permeable membrane as the boundary, the effective diffusion distance is defined as for three-dimensional diffusion, where De is the effective diffusion constant, and tm is the diffusion time window. For a membrane of δ thickness, the water permeability Pd is expressed as Pd = De/δ. The time window for the diffusion-exchange, tm, is determined by the off-resonance pulse duration τ, tm ∼ τ. Since the water diffusion-exchange between compartments dilutes the apparent concentration of the paramagnetic agents in the paramagnetic agent compartment, the water relaxation rate for the paramagnetic agent compartment is expected to be reduced after a sufficiently long RF pulse is applied. A typical 25ms - 500ms pulse corresponds to a x̄ of 10-50 μm at De = 10−5 cm2/s. For paramagnetic agents with compartment dimension l around a few millimeters, the water diffusion-exchange should not cause any serious problems because l >> x̄. For cell clusters, the compartment dimension may be comparable to the x̄ since the size of cell is about 10-100 μm. Thus, the water diffusion-exchange is expected to affect the detection of paramagnetic agent labeled cell clusters. If the labeled cell clusters can be detected at a size smaller than 1 mm, most cancers then can be screened out at an early curable stage [8]. Therefore, the water diffusion-exchange effect for paramagnetic agents located in sub-millimeter compartments is extremely important for early detection of cancers. Here we are interested in how the NMR signal intensity for the paramagnetic agent compartment is altered by the diffusion-exchange effect, especially at low paramagnetic agent concentration with sub-millimeter compartment dimension.
Due to the effect of water diffusion-exchange, the NMR signal from paramagnetic agent compartment is mixed with those from other compartments. Extensive studies for a variety of situations have been carried out in the laboratory frame for T1, T2 weighted imaging, as shown in the comprehensive reviews elsewhere [9-14]. Theories based on the diffusion-Bloch equation were used to develop various models such as spatial distributions [10], two-site exchange [9-12, 14], three sites exchange [12], and general moment expansion [13]. These studies used T1 type paramagnetic agents [14-17] in order to evaluate blood volumes, blood vessel permeability, and perfusion in vivo [18-22]. The related parameters include the relaxation rate constant, the exchange rate constant and the population fraction for each compartment. Here we only review the parameters and equations that are relevant to the models used in this paper. The compartment with T1-type paramagnetic agents has a relaxation rate constant R1c, and the compartment without paramagnetic agents has a relaxation rate constant R1nc. Depending on the water exchange rate 1/τe and the relaxation rate constant difference R1c—R1nc, there are three regions for the exchange kinetics: the fast exchange (1/τe >> R1c—R1nc), the intermediate exchange (1/τe ≈ R1c—R1nc), and the slow exchange (1/τe << R1c—R1nc). For the membrane-separated compartments, 1/τe is a function of water permeability Pd, membrane surface area S, and compartment volume V,1/τe = PdS/V [11-12,17]. The fast or intermediate exchange kinetics will mix the NMR signals from different compartments, but the slow exchange will have a much less effect on the NMR signals. For the vasculatures in vivo, the intra-cellular/extra-cellular compartments of red blood cells are considered as one compartment due to the fast exchange kinetics. The red blood cells and plasma together form the intravascular compartment. The parenchymal cells with the interstitium form the extra-vascular compartment. The intravascular/extra-vascular compartments are considered as two compartments due to the slow exchange kinetics [11]. Thus, the diffusion-exchange affects the detection of paramagnetic tracer in dynamic contrast-enhanced T1 -weighted MRI [18-22]. The effect of water diffusion-exchange can be suppressed by using a short diffusion time window. As shown in the inversion-recovery experiment, the time window for diffusion-exchange is controlled by the delay between the inversion pulse and the 90° reading pulse TI. When TI << tm, the effect of diffusion-exchange on NMR signal is largely reduced [11].
In the off-resonance rotating frame, water diffusion-exchange will also affect the NMR signals. However, the influence is different from that in the laboratory frame. This is attributed to that the relaxation mechanism in the paramagnetic agent compartment is different from that in the tissue compartment (no paramagnetic agents) in the off-resonance rotating frame. In the paramagnetic agent compartment, water molecules relaxed through the paramagnetic relaxation pathway with a rate constant of R1ρ,Gd. In the tissue compartment, water molecules relaxed through magnetic transfer pathway with a rate constant of RMT. The measured z-magnetization of each pathway depends on the RF parameters of the long pulse, explicitly, the RF amplitude (ω1), the frequency offset (Δ), the pulse duration (τ), and the pulse recycle delay (TR) [7]. Applying a long pulse with high amplitude or at low frequency offset often generates a large relaxation rate constant of water in the paramagnetic agent compartment and strong magnetization saturation for the tissue compartment. A long pulse or a short pulse recycle delay may not affect the magnetization for the paramagnetic agent compartment due to the relaxation enhancement effect, but it can reduce the magnetization for the tissue compartment substantially due to the magnetization transfer and spin saturation effect. Studies on the exchange kinetics in the off-resonance rotating frame have been reported for spins in aqueous media [23-25], but no appropriate mathematic model has been established for the water diffusion-exchange between dynamically heterogeneous compartments yet.
Here, we assume that water molecules are in exchange between the paramagnetic agent compartment with finite volume Vc and the tissue compartment. By combining the rotating frame magnetization formalisms [7] with the exchange theory in the laboratory frame [12], a pair of coupled equations for the residual z-magnetization of water in the rotating frame can be written as follows,
| [1a] |
| [1b] |
Where, Ei is a factor accounted for the pulse recycle delay effect, Ei = 1—exp(—Ri·TR), i=Gd, MT [7]. τ−1e is the exchange rate constant defined in the previous text, τ−1e = PdS/V and Pd = De/δ. fc is the volumetric frame of paramagnetic agent, fc = Vc/V. Vc,V is the volume for the paramagnetic agent compartment and the total volume respectively. ΔMi is the change of residual z-magnetization with respect to their equilibrium values in the rotating frame, i=Gd, MT. The general expressions of ΔMi can be derived from the equations shown in the previous paper [7]. Qualitatively, Eq.1 states that the amount of the water to be mixed is a complex function of the RF parameters (ω1, Δ,τ,TR) in addition to the intrinsic relaxation properties (R1ρ,Gd,RMT, R1,Gd,R1,a), the exchange kinetic parameter (τ−1e or De) and the volumetric fraction of paramagnetic agent (fc). The paramagnetic agent concentration is included in the paramagnetic agent relaxation rate constants R1ρ,Gd and R1,Gd. Due to the relation of , the ΔMi inherently is a spatially dependent function of the pulse duration τ. Thus, analytical derivation of the residual z-magnetization from Eq.1 becomes a challenge.
In this initial study, instead, we will explore the various dependences of the residual z-magnetization predicted by the Eq.1 experimentally through well-designed in vitro/in vivo models. This will provide protocols for the designing of in vivo imaging experiments and experimental basis for the theoretical analysis in the future. There are several correlations we will explore qualitatively via the in vitro/in vivo models, including (1) the residual z-magnetization of paramagnetic agent compartment as a function of pulse duration τ , water diffusion coefficient De, paramagnetic agent volumetric fraction fc, and paramagnetic agent concentration cc; (2) the imaging contrast as a function of paramagnetic agent volumetric fraction fc, paramagnetic agent concentration cc and RF pulse parameters.
In consistent with our previous studies [1, 2, 7], the imaging sequence used in this study contains a long off-resonance pulse in the preparation, followed by a routine spin echo imaging sequence for the spatial encoding. The RF amplitude (ω1) and the frequency offset (Δ) for this long pulse are sufficiently large to overcome the magnetization dephase induced by B0 inhomogeneities (Δω0). With typical values of ω1 ≥ 2kHz and Δ =5 -15 kHz, the effective field strength of the rotating frame , ranged from 5.4 to 15.1 kHz, is much larger than the Bo inhomogeneities, which typically is about a few hundred Hz. At these conditions, the spins in the liquid pool are aligned with the effective field during the long pulse. As demonstrated in our previous papers [2, 7], the large ω1 benefits the paramagnetic enhancement and the large Δ is required to differentiate the dynamics of paramagnetic agents. Thus, this pulse scheme allows us to generate the effective field of rotating frame efficiently and to explore the spin relaxation properties with the established theories and methods conveniently. There are several other imaging sequences that are also based on the spin relaxations in the off-resonance rotating frame [26, 27], namely off-resonance rotating frame spin-locking. This type of sequences is an extension of the on-resonance spin-locking [28], in which the magnetization is prepared and the RF is subsequently phase and frequency shifted to align with the effective field of the rotating frame. Using the off-resonance condition instead of the on-resonance condition permits to maintain the same ωe with smaller ω1 (lower RF power) than that in the on-resonance version. With typical parameters of ω1,Δ< 1 kHz used in the off-resonance spin locking, the B0 inhomogeneities (∼ a few hundred Hz) induced magnetization dephase can not be avoided [26]. Thus, the spin locking pulse was used to align the spin in phase. Since the detected signal contains the T1ρ dependence, the magnetization obtained from this off-resonance spin locking sequence also can be used to obtain the information about the paramagnetic agents if large ω1 and Δ are applied. However, the analytical formalism is complicated by other contributions, such as T2ρ [29].
Another issue related to this long off-resonance pulse is the distribution of RF amplitude ω1 in various RF coils. The distribution of RF amplitude can cause inhomogeneous dephasing of the nutation. This dephasing effect can mitigate the contribution from T2ρ and is very effective at short pulse duration. Nevertheless, we are interested in the magnetization along the effective field with pulse duration of a few hundred milliseconds. At this condition, all the components transversed to the effective field are dephased, which are irrelevant to the magnetization to be measured in this study. The components along the effective field are determined by T1ρ and T1 only, and read out as the residual z-magnetization. Since the effective field strength ωe is dominated by the frequency offset Δ at Δ> ω1, spins are aligned to the effective field with slightly different ωe, which generates a inhomogeneous distribution of residual z-magnetization Iz. If the ω1 homogeneity varies in the range of ±10%, the deviation of residual z-magnetization Iz is estimated to be negligible based on our previous studies [2, 7].
In this work, we present an experimental investigation of the water diffusion-exchange effect on the paramagnetic relaxation enhancement for in vitro/in vivo models where the size of the paramagnetic agent compartment is comparable to the mean diffusion displacement of water molecules during the long RF pulse. In vitro, the dialysis membrane tubes and hollow fibers were used to isolate (Gd-DTPA)30-BSA from 7% cross-linked bovine albumin (BSA) gels. The influence of water diffusion-exchange rate was explored by varying the molecular cutoff (MWCO) of the dialysis tubes. Very small paramagnetic agent volumetric fractions were obtained by using the hollow fibers with a sub-millimeter diameter. This hollow fiber sample also allows us to examine the influence of low paramagnetic agent concentrations on the paramagnetic relaxation enhancement. The in vivo analogue to the dialysis hollow fibers is the cerebral vasculature of the rat brain. The intravascular agents (Gd-DTPA)30-BSA were administrated into the compartment via bolus injection. In these in vitro/in vivo models, all paramagnetic agents were located in the fluid compartments, where the contribution from the magnetization transfer pathway was negligible. This study quantifies the residual z-magnetization as a function of the diffusion coefficient and the RF pulse parameters. The imaging contrast for the paramagnetic agent compartment is evaluated in vitro/in vivo as a function of the paramagnetic agent volumetric fraction, the paramagnetic agent concentration, and the RF parameters. This study may provide guidance in detecting labeled cell clusters/tissue compartments at a sub-millimeter scale in vivo.
2. Experimental
2.1 In vitro phantoms
Dialysis tube phantoms: 7% bovine albumin (BSA) solution was cross-linked with 25% glutaraldehyde [30] to form gels inside a 1 ml dialysis tube that was made from regenerated cellulose esters by Spectrum Laboratories Inc (Rancho Dominquwz, CA). The MWCO of the membrane of the dialysis tube was 0.1, 2, 10 and 15 kDa respectively. Following the formation of the gels, the dialysis tube was placed into a 10 mm glass tube containing aqueous (Gd-DTPA)30-BSA (Mw∼85 kDa) at 1 mM Gd(III), which was synthesized as reported elsewhere [1].
Hollow fiber phantoms: aqueous (Gd-DTPA)30-BSA at 0.1 mM Gd(III) were filled into a single hollow fiber made by Spectrum Laboratories Inc (Rancho Dominquwz, CA). The hollow fibers with 150 μm diameter and ∼10 μm wall thickness were made from regenerated cellulose esters with 13 kDa MWCO, the hollow fibers with 500 μm diameter and ∼10 μm wall thickness made from polysulfone with 10 kDa MWCO. The hollow fiber was placed inside a 10 mm glass tube. 7% bovine albumin (BSA) solution was added in and cross-linked with 25% glutaraldehyde to form gels. In order to evaluate the NMR signal loss for the hollow fiber compartment, a 1.5 mm diameter glass capillary filled with the same contrast agent solution was used as a reference. This sample did not have the water diffusion-exchange across the boundary or a NMR signal loss due to the water diffusion-exchange effect.
2.2 In vivo animal preparations
Paramagnetic agent concentration in rat blood plasma: (Gd-DTPA)30-BSA/0.9% NaCl solution was filtered through a 0.2 μm sterilized filter before injecting it into rats. Eight 240 - 270g female rats (Sprague Dawley, Harlean, IN) were anesthetized with pentobarbital (40mg/kg, i.p) and intubated. The rats were maintained under anesthesia with 0.5% isoflurane in 50%/50% O2/air, and their respiration rate was maintained with a UGO BASIL rodent ventilator. The femoral artery and the femoral vein were catheterized to sample blood and inject contrast agents respectively. Immediately after the bolus injection of Gd-DTPA)30-BSA, 0.2ml blood was drawn from the femoral artery every 5 minutes. A total 13 samplings were collected in 60 minutes. 0.8 ml of 1:1 of concentrated sulfuric acid and concentrated nitric acid was added into each blood sample in an ice bath and allowed to digest at room temperature overnight. The digested sample was diluted with deionized water to 2 ml, and filtered through a 0.2 μm filter. Atomic emission spectroscopy (AES) analysis demonstrated that the gadolinium concentration was nearly constant for ∼40 minutes after the injection, which was 1.3 mM Gd(III) for the 0.1 mmol Gd/kg dosage and 0.13 mM Gd(III) for the 0.01 mmol Gd/kg dosage.
Rat in vivo experiments: All animal experiments were carried out under IACUC approved protocols. Eight 240-270g female rats (Sprague Dawley, Harlan, IN) were anesthetized with pentobarbital (30mg/kg, i.p) and the femoral vein was catheterized to inject (Gd-DTPA)30-BSA/0.9% NaCl solution. During the MRI experiments, the rats were maintained under anesthesia with 0.5% isoflurane in 50%/50% O2/air. The respiration rate of the animals was monitored with the Biopac MP150, and the body temperature was maintained by a water bag. The (Gd-DTPA)30-BSA/0.9% NaCl solution was I.V. injected into rats at 0.01 mmol/kg or 0.1 mmol Gd/kg dosage.
2.3 In vitro MRI experiments
All in vitro MRI experiments were carried out with volume coils on a 9.4 T Bruker Avance microimaging spectrometer. For the T1ρ -weighed imaging, a 500 ms RF pulse with 2 kHz RF amplitude and 10 kHz frequency offset was used. In order to evaluate the enhancement in the imaging contrast, additional T1 -weighted images were required for the hollow fiber phantoms. Other imaging parameters were: 1.28 cm FOV, 2 mm slice thickness, 2 ms sinc3 pulse, 9.13ms TE, and a 50 ×50 μm2 in-plane resolution. TR was 0.75s for those images in which the slices were parallel to the orientation of the hollow fibers and 3s for all others.
2.4 In vivo MRI experiments
All in vivo MRI experiments were carried out on a 4.7T Bruker Biospec imaging spectrometer. Images were acquired with a single loop coil wrapped on the surface of an acrylic tube with 4.5cm O.D. The loop was made from an 8mm wide cupper foil orientated at 45 ° with respect to the magnet z-axis. Six ATC 100C series chip capacitors from American Technical Ceramics (Huntington Station, NY) were distributed in the loop and two high voltages variable capacitors (NMRAJ40HV) from Voltronics (Daenville, NJ) were used to match and tune the coil respectively. This coil provided 90% homogeneity for three 2-mm coronal slices. The distribution of the RF amplitude B1 along the normal of the loop was calibrated with a modified version of the reported sequence [31].
Anatomical images were collected with standard RARE sequence. Double spin echoes were acquired for T1, T1ρ, and MTC-weighted images. For the T1ρ -weighted imaging, a 500 ms hard pulse with 0.7 - 2 kHz RF amplitude and 5-15 kHz frequency offset was applied. MTC-weighted images were acquired at the same RF parameters except for 0.3 kHz RF amplitude and 5 kHz offset. Other imaging parameters were: 5.0 cm FOV, 2 mm slice thickness, 1.5 ms sinc3 pulse, TE/TR 6.8ms/1s, 80 kHz bandwidth, 195×195 μm2 in-plane resolution and 4 min 18 second per image.
The images were acquired for each rat in the following order: control images → injection of (Gd-DTPA)30-BSA at 0.01mmol Gd/kg dosage → imaging for the dosage 1→ injection of (Gd-DTPA)30-BSA at 0.1 mmol Gd/kg dosage → imaging for the dosage 2. All T1, T1ρ and MTC-weighted images were collected within the 40 minute post injection, during which the paramagnetic agent concentration was nearly constant. All imaging data were processed off-line with Bruker ParaVison software.
3. Results and discussions
3.1 Dialysis tube phantoms
Fig.1(A) shows the schematics of a membrane boundary between two compartments. The water compartment contains aqueous paramagnetic agents, and the gel compartment contains cross-linked protein gels. Assuming the MWCO of the membrane is much smaller than the molecular weight of the paramagnetic agents, only water molecules can penetrate through the membrane. There are three environments for water molecules: the aqueous paramagnetic agent compartment, the membrane, and the gel compartment. The water diffusion coefficient for each environment is denoted as Dw, Dm, and Dg respectively. The porous size of the membrane determines Dm, which is characterized by the MWCO. If the membrane thickness is comparable to the effective diffusion distance x̄, there exist two water exchange processes: (1) the water exchange between the membrane and the paramagnetic agent compartment, and (2) the water exchange between the membrane and the gel compartment. Because the gel compartment has much lower diffusion coefficient than the paramagnetic agent compartment, the exchange between the membrane and the paramagnetic agent compartment (the second process) is expected to occur at longer pulse duration. In this study, the membranes with MWCO of 0.1, 2, 10 and 15 kDa were chosen to control the translational diffusion coefficient of the membrane water so as the water exchange rate between the paramagnetic agent compartment and the gel compartment. Since the RF amplitude (ω1), frequency offset (Δ) and pulse recycle delay TR are fixed, the signal alterations for the membrane of different MWCO are related to the change of the pulse duration τ.
Figure 1.

Water diffuses across a membrane that separates two compartments. (A) Schematic illustration of a phantom consists of a water compartment and a protein gel compartment. The water compartment contains the macromolecule attached paramagnetic ion chelates (the open ellipses) that cannot pass through the membrane. The water molecules (the solid dots) can diffuse into three environments with the effective diffusion coefficients denoted as Dw for the water compartment, Dm for the porous membrane, and Dg for the gel compartment. The diffusion coefficient Dm and the membrane thickness δ limit the water transfer from the water compartment to the gel compartment and vice versa. (B) Intensity profile of T1ρ -weighted imaging at τ =0 for membrane of 0.1 kDa MWCO. The water compartment (w) contained aqueous (Gd-DTPA)30-BSA at 1 mM Gd(III). The gel compartment (g) was made from 7% cross-lined BSA gel. (C) T1ρ -weighted imaging intensity Iw, Ig and Im as a function of pulse duration τ for the membrane of 0.1 kDa MWCO. (D) Normalized T1ρ -weighted imaging intensity Im as a function of pulse duration τ for various membranes. The MWCO of these membranes is 0.1, 2, 10 and 15 kDa respectively. All T1ρ -weighted images were at 50 ×50μm2 in-plane resolution, and the off-resonance pulse was irradiated at 10 kHz offset with 2 kHz RF amplitude.
Fig.1(B) shows the T1ρ -weighted imaging intensity profile at pulse duration τ=0 for a dialysis tube phantom, in which two compartments were separated by a membrane with 0.1 kDa MWCO. The inner compartment contained 7% cross-linked BSA gel, and the outer compartment contained (Gd-DTPA)30-BSA (Mw∼85 kDa) at 1 mM Gd(III). This intensity profile corresponds to one line in the coronal image; its amplitude reflects the water diffusion-exchange across the membrane boundary between the two compartments. The membrane thickness δ is ∼ 50 μm, corresponding to 1 pixel point in the distance axis. Both the paramagnetic agent compartment and the gel compartment have dimension (d∼ 4 mm) much larger than the membrane thickness (δ∼ 50 μm). Thus, the water pool of the two compartments is considered to be infinitely large compared with that of the membrane. This experiment was used to obtain the initial reference for the residual z-magnetization at different pulse duration τ. Since there is no diffusion-exchange at τ=0, the water in the three environments was well distinguished by their imaging intensity. The water in the paramagnetic agent compartment was fully relaxed at 3s TR, but neither the water in the gel compartment nor the water in the membrane boundary was fully relaxed. The imaging intensity appears in the order of Iw > Ig > Im, where the subscript w, g, m denotes the water compartment, the gel compartment, and the membrane respectively. Thus, the paramagnetic agent compartment has the largest initial residual z-magnetization among all the compartments.
Fig.1(C) shows the T1ρ -weighted imaging intensity as a function of the pulse duration τ for the water in the three environments. The resultant imaging intensity is in the order of Iw > Ig > Im for 0 ≤ τ ≤ 1s. The same phantom shown in the Fig.1(B) was used in this experiment. The pulse with 2 kHz RF amplitude was irradiated at 10 kHz offset with the duration τ ranging from 0 to 1s. Since this membrane has the lowest MWCO, the phantom is referred as the slowest water diffusion-exchange in the series. Assuming the magnetization alterations induced by the two water exchange processes are negligible in the paramagnetic agent compartment and the gel compartment, the residual z-magnetization for each compartment the reflects the intrinsic relaxation rate of water molecules in that compartment. The water in the paramagnetic agent compartment is relaxed through the paramagnetic relaxation pathway. The intensity Iw deceases as the pulse duration τ increases and gradually approaches to a constant when τ is longer than 500ms. The water in the gel compartment is relaxed via the magnetization transfer pathway and its intensity Ig decreases rapidly as the pulse duration τ increases. Since volume of the membrane is much smaller than the two compartments, a small quantity of water exchange from any processes may cause a substantial alteration in Im. The plot in Fig. 2(C) suggests that the relaxation mechanism of the membrane water varies as the pulse duration τ increases. This arises from the fact that the membrane is very thin, the water from both the paramagnetic agent compartment and the tissue compartment can enter easily. Depending on the pulse duration, the magnetization of the membrane water may behave more like that of the paramagnetic agent compartment or that of the gel compartment. At τ < 400ms, the water relaxation rate is predominated by the intrinsic magnetization transfer pathway of the membrane. As the pulse duration becomes longer than 400 ms, the contribution of the water molecules in exchange with the paramagnetic agent compartment increases. Although water can diffuse in/out from both compartments, the paramagnetic agent compartment has higher initial residual z-magnetization, larger relaxation rate constant and larger diffusion coefficient than the gel compartment. Thus, the relaxation of the membrane water exhibits more similarity to that of the paramagnetic agent compartment than that of the gel compartment. The intensity Im decreases as τ increases but the decrement becomes smaller at τ > 400ms. This result indicates that the water exchange will increase the effective volume of paramagnetic agent, but this process depends on the pulse duration τ and the diffusion coefficient De.
Figure 2.

Water diffusion-exchange in hollow fibers embedded in cross-linked protein gels. (A) Schematic illustration of a phantom contained hollow fibers (h), glass capillary (c) and protein gels (g). (B) Intensity profiles of T1ρ -weighted images. The hollow fiber was made from polysulfone with 10 kDa MWCO and a 500 μm diameter. The glass capillary tube had a 1.5 mm diameter. Both were filled with aqueous (Gd-DTPA)30-BSA at 0.1 mM Gd(III). The protein gels were made from 7% cross-lined BSA. (C) Intensity profiles of T1ρ -weighted images. All compartments are the same as those shown in (B) except that the hollow fiber was made from regenerated cellulose esters with 13 kDa MWCO and a 150μm diameter. All T1ρ -weighed images were at 50 ×50 μm2 in-plane resolution, and the off-resonance pulse was irradiated at 10 kHz offset with 2 kHz RF amplitude. The slices were perpendicular to the longitudinal direction of the fibers and the capillary. Other imaging parameters are discussed in the text.
Fig.1(D) compares the normalized T1ρ -weighted imaging intensity as a function of pulse duration τ for the membrane water. In this experiment, the MWCO of the membranes was 0.1, 2, 10 and 15 kDa, respectively, and the RF parameters were the same as those used for the Fig.1(C). The increase of the MWCO leads to the increase of diffusion coefficient for the membrane water. Since the membrane boundary serves as mixing chamber for the water in/out from the two compartments, the imaging intensity Im reflects the degree of water exchange with the two compartments. In this experiment, two independent variables, the pulse duration and the diffusion coefficient, were used to correlate with the change of the imaging intensity Im. As shown in the figure, the diffusion-exchange effect is negligible at pulses shorter than 300 ms, where Im is similar for all MWCOs. As the pulse duration increases, the effect of the water diffusion-exchange on the NMR signal becomes apparent. At low MWCO, the imaging intensity Im is affected by the first exchange process, which is the membrane water in exchange with the water in the paramagnetic agent compartment. However, the contribution of the second exchange process, which is the membrane water in exchange with the water from the gel compartment, increases as the MWCO of the membrane becomes larger and the pulse duration τ gets longer. As shown in the Fig.1(D), the intensity at τ > 400 ms is in the order of Im(0.1kDa) < Im(15kDa) < Im(2kDa) < Im(10kDa). This order demonstrates that the water in exchange with the paramagnetic agent compartment increases the imaging intensity Im for MWCO < 10 kDa; and the water in exchange with the gel compartment dilutes the paramagnetic relaxation enhancement for MWCO >15 kDa. In both case, the applicable pulse duration τ ranges from 400 ms to 1s. Since the water in exchange with the gel compartment has less intensity enhancement than that with the paramagnetic agent compartment, the imaging intensity Im(15kDa) is still larger than the least exchange reference Im(0.1kDa). Thus, paramagnetic agents that are located in a compartment with a larger diffusion coefficient are more ready to be diluted and the application of a longer pulse duration will accelerate this dilution. On the other hand, if paramagnetic agents with high relaxation enhancement efficiency are used, sufficient relaxation enhancement can be achieved with a very short pulse [2, 7]. For these agents, applying short pulse allows us to suppress the magnetization transfer effect [7] and reduce the water exchange simultaneously.
In summary, the dependence of the residual z-magnetization on the water exchange between the paramagnetic agent compartment and tissue compartment is a function of several parameters, including the diffusion coefficient, the intrinsic relaxation rate constant and the initial residual z-magnetization of each compartment, the rate of water exchange between compartments, the pulse duration and pulse recycle delay. By using efficient paramagnetic agents, the water diffusion-exchange induced concentration dilution for the paramagnetic agent compartment can be reduced significantly with short pulse duration and short pulse recycle delay. The experimental results shown in this section reflect the effect of water diffusion-exchange for two compartments with comparable dimensions. The results presented below for the hollow fiber phantoms are for the situation where the paramagnetic agent compartment (d ∼ 0.15 -0.5 mm) is much smaller than the gel compartment (d ∼ 8mm). Thus, the residual z-magnetization for the paramagnetic agent compartment reflects the influence of the water exchange between a finite pool with an infinitely large reservoir, which determines the detecting sensitivity for paramagnetic agents at very low volumetric fraction.
3.2 Dialysis hollow fiber phantoms
Fig. 2(A) shows the setup for the hollow fiber phantom. The hollow fiber, denoted as h, was parallel to the glass capillary, denoted as c, inside a 10 mm tube. Both the hollow fiber and the glass capillary were filled with (Gd-DTPA)30-BSA at 0.1 mM Gd(III) and surrounded by the 7% cross-linked BSA gels. Here the glass capillary serves as the paramagnetic agent compartment that does not have any water diffusion-exchange across the boundary or any NMR signal loss due to the water diffusion-exchange effect. Because the diameter of the hollow fiber (0.15 -0.5 mm) is much smaller than that of the gel compartment (d∼8 mm), the water pool for the paramagnetic agent compartment is finitely small compared with the water reservoir in the gel. With a 10 μm membrane thickness and a 500ms pulse duration, the exchange of membrane water with the paramagnetic agent compartment and the gel compartment can be simplified as the water exchange between the paramagnetic agent compartment and the gel compartment, but the pore size of the membrane controls the exchange rate. In this study, two orientations were chosen for the imaging slice: (1) the slice was perpendicular to the fiber and (2) the slice was parallel to the fiber. For the perpendicular orientation, ∼100 % volumetric fraction were obtained for the paramagnetic agent compartment. For the parallel orientation, a series of volumetric fractions were achieved by selecting different slice thickness.
Fig.2 (B &C) demonstrates the T1ρ -weighted imaging intensity profiles for hollow fiber phantoms with a 500 μm diameter fiber (Fig. 2(B)) or a 150 μm diameter fiber (Fig. 2(C)). These hollow fibers provided compartments for paramagnetic agents at sub-millimeter scale in the radial direction and the images slices were perpendicular to the fiber. The illustrated intensity profiles correspond to one line from the coronal image. The 500 μm diameter hollow fiber was made from polysulfone with 10 kDa MWCO and the 150 μm diameters hollow fiber was made from regenerated cellulose esters with MWCO of 13 kDa. The glass capillary has diameter ∼ 1.5 mm. Since the in-plane resolution is 50 μm and the thickness of both membranes is ∼ 10 μm, the highest image intensity point corresponds to 100% of the volumetric fraction fc for the paramagnetic agents in the hollow fibers or capillary. Thus, the ratio of the intensity for the hollow fiber Ih verses the intensity for the capillary Ic reflects the influence of water diffusion-exchange across the hollow fiber membrane.
The T1ρ -weighted images were acquired at the same RF condition as those for the Fig. 1(D) except that the pulse duration was 500ms. Both hollow fibers have significant water diffusion-exchange because their MWCO ≥ 10 kDa. This experiment was used to evaluate the signal loss due to the diffusion-exchange effect and compare the loss at two different surface/volume ratios (S/V). The thinner hollow fiber has the larger S/V so as its exchange rate since τ−1e = PdS/V. As shown in the figure, Ih / Ic is 0.80∼0.9 and Ih / Ig > 3, suggesting that the water diffusion-exchange between the hollow fiber compartment and the gel compartment is very slow. From the 500 μm fiber to the 150 μm fiber, the S/V or the exchange rate 1/τe increases ∼ 3 time. As shown in the figure, the Ih / Ic decreases from ∼0.9 for the 500 μm fiber (Fig.2(B)) to ∼0.80 for the 150 μm fiber (Fig.2(C)).
Table 1 lists Ih / Ic for the 150 μm fiber by varying the pulse recycle delay TR or the paramagnetic agent concentration. At 0.5s TR, Ih / Ic increases 5-8% compared with that at 3s TR. This increment also depends on the paramagnetic agent concentration. The higher concentration has the larger increment. The use of shorter TR saturates the water protons in the gel compartment more than that those in the paramagnetic agent compartment, because the water molecules in each compartment have different Ei factor, Ei = 1—exp(—Ri·TR), i=Gd, MT. The increase of the paramagnetic agent concentration by 10 times only increases 5-8% of Ih / Ic The effect of paramagnetic agent concentration is expressed in the formalism of R1ρ,Gd. Although R1ρ,Gd ∼ cGd, the measured residual z-magnetization is a more complex function of R1ρ,Gd [7] and there is no linear relationship between MGd and cGd. The maximum Ih / Ic obtained with a 500ms pulse is 0.93 for (Gd-DTPA)30-BSA at 1 mM Gd(III) and 0.85 for (Gd-DTPA)30-BSA at 0.1 mM Gd(III). Thus, a much higher Ih / Ic is expected for pulses much shorter than 500ms.
Table 1.
Image intensity ratio of fiber* compartment verse capillary compartment (Ih/Ic)
| CGd | Ih/Ic (0.5s TR)** | Ih/Ic (1s TR)** | Ih/Ic (3s TR)** |
|---|---|---|---|
| 1.0 mM | 93±1% | 86±1% | 85±1% |
| 0.1mM | 85±1% | 81±1% | 80±1% |
Fiber I.D. = 150μm.
Pulse duration τ=500ms, RF amplitude ω1=2 kHz.
Fig.3 (A) compares T1-weighted and T1ρ -weighted images for a 150 μm hollow fiber filled with (Gd-DTPA)30-BSA at 0.1 mM Gd(III). These images slices were parallel to the fibers, which allow for the selection of a paramagnetic agent volumetric fraction arbitrarily by varying the slice thickness. This set of experiments was used to compare the two imaging contrast methods for paramagnetic agents at low concentrations and at low different volumetric fractions in vitro. The T1ρ -weighted images were collected at the same RF condition as those for the Fig.2 (B&C) except that the TR is 0.75s. For the purpose of comparison, the T1-weighted images were also acquired with 0.75s TR. When the hollow fiber is used as the paramagnetic agent compartment, it shows a brightened line in the images, which gradually fades away at the upper of the images. This is because the fiber was tilted away from the slice plane. However, this does not affect the comparison of the two imaging contrast methods. The slice thickness was chosen as 0.5 mm and 1 mm, corresponding to the paramagnetic agent volumetric fraction fc of 0.3 and 0.15 respectively. For both slice thickness, the imaging contrast in the T1ρ -weighted images appears to be much higher than that in the T1 -weighted images. This is because the off-resonance pulse in the T1>ρ -weighted image suppresses the signal of the gel compartment but maintains the signal of the paramagnetic agent compartment.
Figure 3.


T1 and T1ρ -weighed images for hollow fibers embedded in cross-linked protein gels. (A) The images at 50 ×50 μm2 in-plane resolution are for the slices that are parallel to the longitudinal direction of the fiber. The slice thickness is 0.5 mm and 1 mm, corresponding to the volumetric fraction of 15% and 30% respectively. The hollow fibers were made from regenerated cellulose esters with 13 kDa MWCO and a 150 μm diameter, and is filled with aqueous (Gd-DTPA)30-BSA at 0.1 mM Gd(III) concentration. The gels were made from 7% cross-linked BSA. A 500 ms RF pulse with 2 kHz RF amplitude and 10 kHz frequency offset was applied in the T1ρ -weighed imaging. (B) The imaging intensity profiles at the arrow marked locations. Other imaging parameters are discussed in the text.
Fig.3(B) compares the imaging intensity profiles selected from the arrow marked locations in the Fig. 3(A). Here, the image contrast is quantitatively defined as the relative intensity change of the hollow fiber verses the intensity of the gels (Ih—Ig) / Ig. This change is 35% for the 0.5 mm slice and 26% for the 1 mm slice in the T1-weighted images, but 180% and 77% in the T1ρ -weighted images. Thus, even with a significant water diffusion-exchange, the T1ρ - weighted images still show a much higher sensitivity to detect the paramagnetic agents than the T1-weighted images. Since the 150 μm diameter of this hollow fiber is comparable to the cell size (10-100μm), and the concentration of the paramagnetic agents is as low as 0.1 mM Gd(III), this result suggests that T1ρ -weighted imaging can be used to detect labeled cells clusters at a sub-millimeter scale.
3.3 Rat Cerebral Vasculature
Fig. 4 compares T1 and T1ρ -weighted brain images of rats injected with intravascular contrast agents (Gd-DTPA)30-BSA. This 2 mm coronal slice was located at an interaural of ∼5 mm. The distribution of vasculatures in the slice has been well characterized by the pathological methods [32] and was further verified in this study by the difference of the T1-weighted images before and after injecting high doses of (Gd-DTPA)30-BSA (Data are not shown). Three types of blood vasculatures were selected for having different paramagnetic agent volumetric fraction fc. Their locations are marked with arrows and numbers in the T1ρ -weighted images. Label 1 denoted the type-1 vasculature that contains a large rhinal vessel perpendicular to the slice. This blood vessel has ∼0.2 mm diameter, corresponding to fc ∼ 100% with 195 ×195 μm2 in-plane resolution. Label 2 denotes the type-2 vasculature that has longitudinal hippocampal vessels parallel or buried in the slice. Its fc is estimated ≤10% for a 2 mm slice. Label 3, 4 denotes the type-3 vasculature that contains blood capillaries in the cortex or subcortex; their fc is ∼ 2% in general. (Gd-DTPA)30-BSA was injected I.V. at two boluses; 0.01 mmol Gd/kg dosage was followed by 0.1 mmol Gd/kg about 40 minutes later. These injections provided 0.13 mM and 1.3 mM Gd in blood plasma, respectively, which are very similar to those used in the hollow fiber phantoms shown in Fig.2 & Fig.3. This model was used to examine the in vivo paramagnetic relaxation enhancement at low paramagnetic agent volumetric fractions, low paramagnetic agent concentrations and various RF conditions.
Figure 4.

T1 and T1ρ -weighed brain images of rats injected with intravascular contrast agents (Gd-DTPA)30-BSA. A 500 ms RF pulse with 2 kHz RF amplitude and 10 kHz frequency offset was applied in the T1ρ -weighed imaging. All images have 2 mm slice thickness and 195 ×195 μm2 in-plane resolution. The 0.01 mmol Gd/kg and 0.1 mmol Gd/kg dosage corresponds to the 1.3 mM and 0.13 mM Gd(III) in the blood plasma. Label 1, 2 denotes the type-1, 2 cerebral vasculature; labels 3, 4 denote the type-3 cerebral vasculatures. Their volumetric coefficients are estimated to be ∼100%, ∼10% and ∼2% respectively. Other imaging parameters are discussed in the text.
Compared to the 150μm hollow fiber, the blood vessels are much less permeable. The vessel membrane has a water diffusion coefficient of Dm ∼10−10 cm2/s. Thus, the water permeability Pd is estimated as 10−4 cm/s for capillaries (r∼ 0.0025 mm, δ∼0.01 μm), 5×10⁻⁵cm/s for arterioles (r∼ 0.025 mm, δ∼0.02 μm), and 10−5 cm/s for arteries (r∼ 0.25mm, δ∼0.1 μm) [12], where r is the diameter and δ is the wall thickness. Their exchange rate constant 1/τe (1/τe = PdS/V) is small, which is estimated to be ∼ 0.8 s−1 for the capillaries, 0.04 s−1 for the arterioles, and 0.0008 s−1 for the arteries. The time required for water molecules in capillaries, arterioles and arteries to diffuse across the membrane is about 1.7ms, 6.8ms and 160ms respectively. Some water diffusion-exchanges can occur during the pulse duration of 500 ms. It is expected that the water diffusion-exchange will affect the capillaries more than the arterioles or the arteries due to their exchange rate constant. Quesson has reported that the apparent relaxation rate constant RobsA (the RMT in our previous paper [7]) of rat brain is ∼ 0.85 s−1 [33], which is relatively small compared to the rotating frame relaxation rate constant R1ρ (θ) for (Gd-DTPA)30-BSA at 1 mM Gd(III) [2] or 0.1 mM Gd(III). Thus, the water diffusions of the arterioles and arteries are in the slow exchange limit.
The T1 and T1ρ -weighted images were collected at the same RF condition as those shown in Fig.3(C) except for the longer TR (1s), shorter TE (6.8ms), and double spin echoes. Assuming arterial blood flow rate is ∼1 cm/s [34], the flow-induced phase encoding error is negligible for a 2 mm slice with 6.8ms TE. In the T1ρ -weighted images, the non-selective off-resonance pulse irradiates the spins in a much larger volume than that in the imaging slice. The 500 ms pulse duration is much longer than that is needed for the arterial blood to flow through a 2mm distance (∼200 ms). Thus, the detected residual z-magnetization reflects the spins under the off-resonance irradiation regardless of the blood flow effect.
Fig.4 demonstrates that the T1ρ -weighted image has substantially higher sensitivity for detecting the paramagnetic agents than the T1-weighted images even though there are some water diffusion-exchange effects. In the T1-weighted images, the type-1 vasculature shows hypointense imaging contrast before the bolus injection. The vasculature is indistinguishable at 0.01 mmol Gd/kg dose but becomes clearly defined at 0.1 mmol Gd/kg dose. The type-2 vasculature is barely distinguishable at 0.1 mmol Gd/kg dose. In the T1ρ -weighted images, both type-1 and type-2 vasculatures are easily identified at all dosages, and the imaging contrast increases as the gadolinium dosage increases. Note that the blood vessels in the T1ρ -weighted images can be easily identified even without the injection of the intravascular agents. This is due to the relaxation enhancement effect of the hemoglobin in the blood, which behaves as a weak T2-type paramagnetic agent. Here the T1ρ -weighted imaging shows the hyperintense imaging contrast for the T2 -type agents, which are hypointense in the T2 -weighted images. This brightness transition can significantly increase the detection sensitivity for theT2 -type paramagnetic agents. This in vivo finding confirmed our previous in vitro studies on the MIONs [35], suggesting that T1ρ -weighted imaging provides a promising method to overcome the “black holes” effect caused by the super-paramagnetic iron oxide (SPIO) in following the cellular or molecular events [36]. This result also highlights a possibility of acquiring angiography images without using paramagnetic agents.
Fig. 5(A) plots the T1ρ -weighted image intensity for the three types of vasculatures as a function of frequency offset for a 500ms pulse with 2 kHz RF amplitude. The imaging intensities used in this plot are from a single pixel for the type-1 vasculature, 6-pixel average for the type-2 vasculature, and 36-pixel average for the type-3 vasculature. The dosage of the (Gd-DTPA)30-BSA is 0.0, 0.01 and 0.1 mmol Gd/kg respectively. In consistent with the volumetric fractions, the intensity magnitude is in the order of I 0.1 >> I 0.01 > I 0.0, where the subscript denotes the dosage of Gd-DTPA)30-BSA in mmol Gd/kg. For the type-1 vasculature, the image intensity increases substantially as the dosages increase, 17-22% from 0.0 to 0.01 mmol Gd/kg and 18-27% from 0.01 to 0.1 mmol Gd/kg. Using lower frequency offsets for the RF pulse can provide larger increase in the imaging intensity. This is because the lower frequency offset corresponds to the larger effective θ angle or the higher paramagnetic relaxation enhancement [1, 2]. For the type-2 vasculature, the increase of the imaging intensity is 7-8% from 0.0 to 0.01 mmol Gd/kg and 5-7% from 0.01 to 0.1 mmol Gd/kg. For the type-3 vasculature, the increase is 5-6% from 0.0 to 0.01 mmol Gd/kg and 2-4% from 0.01 to 0.1 mmol Gd/kg. Thus, all three types of vasculatures have increased residual z-magnetizations in response to the injection of intravascular agents. The percentage of increase is proportional to their volumetric fraction.
Figure 5.


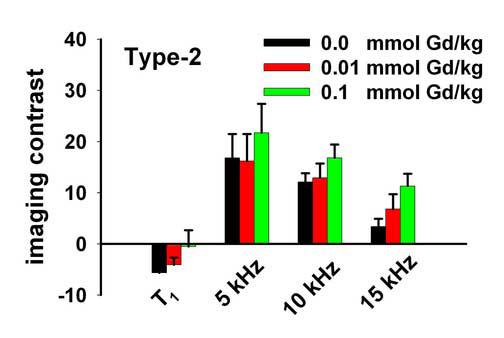
Imaging intensity and imaging contrast as a function of frequency offset for a 500ms pulse with 2 kHz RF amplitude. (A) T1ρ -weighted imaging intensity for the three type vasculatures. (B) T1 and T1ρ -weighted imaging contrasts for the type-1 vasculature. (C) T1 and T1ρ -weighted imaging contrasts for the type-2 vasculature. All imaging parameters are the same as those for Fig. 4.
Fig. 5(B & C) shows the imaging contrast calculated from the data shown in Fig. 5(A) and from the T1-weighted images. Here the imaging contrast is defined quantitatively as the relative imaging intensity change of the type-1 or the type-2 vasculature verses the type-3 vasculature. For the type-1 vasculature, the imaging contrast ranges from −15% to +50% in the T1-weighted images, but is +47% to +140% in the T1ρ -weighted images, depending on the dosage of the intravascular agents and the frequency offset of the long pulse. The hemoglobin in the blood contributes to the paramagnetic relaxation enhancement at zero dosage, and the enhancement efficiency at 0.01 mmol Gd/kg dosage is higher than that of the hemoglobin. For the type-2 vasculature, the imaging contrast ranges from −5.6% to −0.5% in the T1-weighted images, but is +3.4% to 21.7% in the T1ρ -weighted images. This type of vasculature has volumetric fraction ∼ 10%; only the T1ρ -weighted imaging is sensitive enough to detect paramagnetic agents. Thus, this experiment demonstrates that T1ρ -weighted images have a much higher sensitivity than T1-weighted images in detecting the paramagnetic agents at low concentrations or the low volumetric fractions.
Fig. 6(A) plots the T1ρ -weighted image intensity for the three types of vasculatures as a function of RF amplitude for a 500ms pulse irradiated at 5 kHz offset. The RF amplitude is represented as the B1 attenuation in dB. The zero attenuation corresponds to a 2 kHz RF amplitude, and the 9db attenuation corresponds to a 0.7 kHz RF amplitude that only needs ∼0.2 Watt RF power. The MTC-weighted images were acquired at the 16db attenuation that provided 0.3 kHz RF amplitude. Again, Fig.6 shows the imaging intensity from 1 pixel for the type-1 vasculature, 6-pixel average for the type-2 vasculature and 36-pixel average for the type-3 vasculature. The intensities are plotted for the (Gd-DTPA)30-BSA at dosage of 0.0, 0.01 and 0.1 mmol Gd/kg respectively; the intensity magnitude is in the order of I0.1 >> I0.01 > I0.0. For the type-1 vasculature, the imaging intensity increases substantially as the dosage increases, 16-20% from 0.0 to 0.01 mmol Gd/kg and 19-27% from 0.01 to 0.1 mmol Gd/kg with the RF amplitude larger than 0.7 kHz. For the type-2 vasculature, the increase is 6-9% from 0.0 to 0.01 mmol Gd/kg and 6-7% from 0.01 to 0.1 mmol Gd/kg. For the type-3 vasculature, the increase is 2-4% from 0.0 to 0.01 mmol Gd/kg or from 0.01 to 0.1 mmol Gd/kg. These increments are very similar to those shown in the Fig.5(A), suggesting that the paramagnetic relaxation enhancement can be achieved at a low RF power. The intensity for the type-1 vasculature increases as the attenuation increases (the RF amplitude decreases) at ∼ 4×10⁴ a.u./db. Beginning at the 9 db attenuation (0.7 kHz RF amplitude), the intensity reaches a plateau. At this condition, the spin relaxation is dominated by the magnetization transfer effect, and the increase of imaging intensity as a function of the paramagnetic agent dosage reduces to ∼7%. However, the imaging intensity for the type-2 and the type-3 vasculatures increases linearly as the B1 attenuation increases at ∼3×10⁴ a.u./db. This suggests that the magnetization transfer pathway dominates the spin relaxation process at these anatomical locations.
Figure 6.


Imaging intensity and imaging contrast as a function of RF amplitude for a 500ms pulse irradiated at 5 kHz offset. (A) T1ρ and MTC-weighted imaging intensities for the three type vasculatures, where 0db B1 attenuation corresponds to 2 kHz RF amplitude. (B) T1, T1ρ and MTC-weighted imaging contrasts for the type-1 vasculature. (C) T1, T1ρ and MTC -weighted imaging contrasts for the type-2 vasculature. All imaging parameters are the same as those for Fig. 4. The magnetization transfer contrast (MTC) images were acquired at the off-resonance pulses set at the same parameters as the T1ρ -weighed images, except for the 0.3 kHz RF amplitude.
Fig. 6(B & C) shows the imaging contrast calculated from the data shown in the Fig. 6(A) and from the T1-weighted images. Depending on the RF amplitude, the contrast of the T1ρ - weighted image extends from +49 % to +140% for the type-1 vasculatures. These values are higher than that of the MTC-weighted images, which ranges from +33 to +46%. For the type-2 vasculatures, the contrast is from +13 % to +25% in the T1ρ -weighted images, and −1% to 2.1% in the MTC-weighted images. These results suggest that the RF power deposition in vivo should not be a problem since high imaging contrasts are obtainable at low RF amplitudes. Thus, it is possible to apply the T1ρ -weighted imaging in clinics to detect the presence of the paramagnetic agents with low RF power depositions.
4. Conclusions
An experimental investigation of the diffusion-exchange effect on the paramagnetic relaxation enhancement is presented for in vitro/in vivo models where the size of the paramagnetic agent compartment is comparable to the mean diffusion displacement of water molecules during the long RF pulse. Water permeable dialysis membranes with MWCO ranging from 0.1 kDa to 15 kDa were used to separate the aqueous (Gd-DTPA)30-BSA compartment from the cross-linked bovine albumin compartment. T1ρ -weighted images with 0.1 - 1s off-resonance pulses were acquired at 9.4T. The results demonstrate that using a 300ms or shorter off-resonance pulses can substantially suppress the diffusion-exchange effect. Water permeable hollow fibers with MWCO ∼10 kDa were used to provide sub-millimeter compartments for the aqueous (Gd-DTPA)30-BSA. T1ρ -weighted images acquired with a 500ms pulse at 9.4T. Even at 0.1 mM Gd(III), the signal intensity can be 80-90% of the intensity for the glass capillary where the signal is not affected by the water diffusion-exchange effect. The use of short pulse duration, high paramagnetic agent concentration and large exchange rate constant can increase the signal intensity for the paramagnetic agents in the hollow fiber compartment. The imaging contrast of the T1ρ -weighted images at different paramagnetic agent volumetric fractions fc was compared with that of the T1-weighted images. For fc equals to 0.15 or 0.3, the T1ρ -weighted images have substantially higher sensitivity to detect paramagnetic agents than theT1-weighted images, even though the water diffusion-exchange induced dilution. The in vivo tests were carried out for the cerebral vasculatures of rat brains at 4.7T, in which three types of vasculatures provided the volumetric fraction of ∼100%, ∼ 10% and ∼2%. The intravascular agents (Gd-DTPA)30-BSA were administrated via I.V. bolus at the dosage of 0.01 and 0.1 mmol Gd/kg, which corresponded to the 0.13 mM or 1.3 mM Gd(III) in the blood plasma. The in vivo paramagnetic relaxation enhancement was evaluated as a function of RF pulse parameters and paramagnetic agent dosages for the three types of vasculatures. In consistent with the in vitro results, the in vivo findings confirm that the T1ρ -weighted imaging has a substantially higher sensitivity than the conventional T1 -weighted images to detect paramagnetic agents, especially at low concentrations, low volumetric fractions and low RF powers. For example, high imaging contrast was achieved at 5 kHz offset with RF amplitudes as low as 0.7 kHz, which highlights the potential clinic applications for detecting the presence of paramagnetic agents at low RF power depositions. This study paves the way for the design of off-resonance rotating experiments to detect labeled cell clusters/tissues in vivo at a sub-millimeter scale.
Acknowledgements
This work was supported by grant to H.Z. from the National Institutes of Health (EB02912).
Footnotes
Publisher's Disclaimer: This is a PDF file of an unedited manuscript that has been accepted for publication. As a service to our customers we are providing this early version of the manuscript. The manuscript will undergo copyediting, typesetting, and review of the resulting proof before it is published in its final citable form. Please note that during the production process errors may be discovered which could affect the content, and all legal disclaimers that apply to the journal pertain.
References
- 1.Zhang H, Xie Y. Efficiency of paramagnetic relaxation enhancement in off-resonance rotating frame. J. Magn. Reson. 2006;181:212–222. doi: 10.1016/j.jmr.2006.05.005. [DOI] [PubMed] [Google Scholar]
- 2.Zhang H, Xie Y. Dynamics of paramagnetic agents by off-resonance rotating frame technique. J. Magn. Reson. 2006;183:213–227. doi: 10.1016/j.jmr.2006.08.008. [DOI] [PubMed] [Google Scholar]
- 3.Louie AY, Huber MM, Ahrens ET, Rothbacher U, Moats R, Jacobs RE, Fraser SE, Meade TJ. In vivo visualization of gene expression using magnetic resonance imaging. Nat. Biotechnol. 2000;18:321–325. doi: 10.1038/73780. [DOI] [PubMed] [Google Scholar]
- 4.Aime S, Fassno M, Terreno E. Lanthanide (III) chelates doe NMR biomedical applications. Chem. Soc. Rev. 1998;27:19–29. [Google Scholar]
- 5.Artemov D. Molecular magnetic resonance imaging with targeted contrast agents. J. Cellular Biochem. 2003;90:518–524. doi: 10.1002/jcb.10660. [DOI] [PubMed] [Google Scholar]
- 6.Josephson L, Perez JM, Weissleder R. Magnetic nanosensors for the detection of oligonucleotide sequences. Angew. Chem. Int. Ed. Engl. 2001;40:3204–3206. doi: 10.1002/1521-3773(20010903)40:17<3204::AID-ANIE3204>3.0.CO;2-H. [DOI] [PubMed] [Google Scholar]
- 7.Zhang H, Xie Y. Dynamics of paramagnetic agents by off-resonance rotating frame technique in the presence of magnetization transfer effect. J. Magn. Reson. 2007;184:275–291. doi: 10.1016/j.jmr.2006.11.004. [DOI] [PMC free article] [PubMed] [Google Scholar]
- 8.Weissleder R. Molecular imaging in cancer. Science. 2006;312:1168–1171. doi: 10.1126/science.1125949. [DOI] [PubMed] [Google Scholar]
- 9.Hazlewood C, Chang D, Nichols B, Woessner D. Nuclear magnetic resonance transverse relaxation times of water protons in skeletal muscle. Biophys J. 1974;14:583–605. doi: 10.1016/S0006-3495(74)85937-0. [DOI] [PMC free article] [PubMed] [Google Scholar]
- 10.Bauer WR, Schulten K. Theory of contrast agents in magnetic resonance imaging: coupling of spin relaxation and transport. Magn. Reson. Med. 1992;26:16–39. doi: 10.1002/mrm.1910260104. [DOI] [PubMed] [Google Scholar]
- 11.Donahue KM, Weisskoff RM, Burstein D. Water diffusion and exchange as they influence contrast enhancement. J. Magn. Reson. Imag. 1997;7:102–110. doi: 10.1002/jmri.1880070114. [DOI] [PubMed] [Google Scholar]
- 12.Barsky D, Oütz B, Schulten K. Theory of heterogeneous relaxation in compartmentalized tissues. Magn. Reson. Med. 1997;37:666–675. doi: 10.1002/mrm.1910370507. [DOI] [PubMed] [Google Scholar]
- 13.Li X, Rooney WD, Springer CS., Jr A unified magnetic resonance imaging pharmacokinetic theory: intravascular and extravascular contrast reagents. Magn. Reson. Med. 2005;54:1351–1359. doi: 10.1002/mrm.20684. [DOI] [PubMed] [Google Scholar]
- 14.Donahue KM, Burstein D, Manning WJ, Gray ML. Studies of Gd-DTPA and proton exchange rates in tissues. Magn. Reson. Med. 1994;32:66–76. doi: 10.1002/mrm.1910320110. [DOI] [PubMed] [Google Scholar]
- 15.Judd RM, Atalay MK, Rottman GA, Zerhouni EA. Effects of myocardial water exchange on T1 enhancement during bolus administration of MR contrast agents. Magn. Reson. Med. 1995;33:215–223. doi: 10.1002/mrm.1910330211. [DOI] [PubMed] [Google Scholar]
- 16.Bronskill MJ, Santyr GE, Walters B, Henkelman RM. Analysis of discrete T2 components of NMR relaxation for aqueous solutions in hollow fiber capillaries. Magn. Reson. Med. 1994;31:611–618. doi: 10.1002/mrm.1910310606. [DOI] [PubMed] [Google Scholar]
- 17.Seo Y, Takamata A, Ogino T, Morita H, Nakamura S, Murakami M. Water permeability of capillaries in the subfornical organ of rats determined by Gd-DTPA2- enhanced 1H magnetic resonance imaging. J Physiol. 2002;545:217–228. doi: 10.1113/jphysiol.2002.027227. [DOI] [PMC free article] [PubMed] [Google Scholar]
- 18.Tofts PS, Brix G, Buckley DL, Evelhoch JL, Henderson E, Knopp MV, Larsson HBW, Lee T-Y, Mayr NA, Parker GJM, Port RE, Taylor J, Weisskoff RM. Estimating kinetic parameters from dynamic contrast-enhanced T1-weighted MRI of a diffusible tracer: standardized quantities and symbols. J. Magn. Reson. Imag. 1999;10:223–232. doi: 10.1002/(sici)1522-2586(199909)10:3<223::aid-jmri2>3.0.co;2-s. [DOI] [PubMed] [Google Scholar]
- 19.Tofts PS, Kermode AG. Measurement of the blood-brain barrier permeability and leakage space using dynamic MR imaging. 1. Fundamental concepts. Magn. Reson. Med. 1991;17:357–367. doi: 10.1002/mrm.1910170208. [DOI] [PubMed] [Google Scholar]
- 20.Moran GR, Prato FS. Modeling 1H exchange: an estimate of error induced in MRI by assuming the fast exchange limit in bolus tracking. Magn. Reson. Med. 2004;51:816–827. doi: 10.1002/mrm.20002. [DOI] [PubMed] [Google Scholar]
- 21.Lawrence St KS, Frank JA, MaLaughlin AC. Effect of restricted water exchange on cerebral blood flow values calculated with arterial spin tagging: a theoretical investigation. Magn. Reson. Med. 2000;44:440–449. doi: 10.1002/1522-2594(200009)44:3<440::aid-mrm15>3.0.co;2-6. [DOI] [PubMed] [Google Scholar]
- 22.Zhou J, Wulson DA, Ulatowski JA, Traystman RJ, van Zijl PCM. Two-compartment exchange model for perfusion quantification using arterial spin tagging. J. Cereb. Blood flow Metab. 2001;21:440–455. doi: 10.1097/00004647-200104000-00013. [DOI] [PubMed] [Google Scholar]
- 23.Davis DG, Perlman ME, London RE. Direct measurements of the dissociation-rate constant for inhibitor-enzyme complexes via the T1ρ and T2 (CPMG) methods. J. Magn. Reson. B. 1994;104:266–275. doi: 10.1006/jmrb.1994.1084. [DOI] [PubMed] [Google Scholar]
- 24.Miloushev VZ, Palmer AG., III R1ρ relaxation for two-site chemical exchange: general approximation and some exact solutions. J. Magn. Reson. 2005;177:221–227. doi: 10.1016/j.jmr.2005.07.023. [DOI] [PubMed] [Google Scholar]
- 25.Trott O, Palmer AG., III Theoretical studuy of R1ρ rotating-frame and R2 free-procession relaxation in the presence of N-site chemical exchange. J. Magn. Reson. 2004;170:104–112. doi: 10.1016/j.jmr.2004.06.005. [DOI] [PubMed] [Google Scholar]
- 26.Fairnabks EJ, Santyr GE, Sorenson JA. One-shot measurement of spin-lattice relaxation times in the off-resonance rotating frame using MR imaging, with application to breast. J. Magn. Reson B. 1995;106:279–283. doi: 10.1006/jmrb.1995.1044. [DOI] [PubMed] [Google Scholar]
- 27.Witschey WRT, Borthakur A, Elliott MA, Mellon E, Niyogi S, Wang C, Reddy R. Comparison for spin-lock artifact using an off-resonance rotary echo in T1ρoff-weighted imaging. Mang. Reson. Med. 2007;57:2–7. doi: 10.1002/mrm.21134. [DOI] [PMC free article] [PubMed] [Google Scholar]
- 28.Santyr GE, Henkelman RM, Bronskill MJ. Spin locking for magnetic resonance imaging with application to human breast. Magn. Reson. Med. 1989;12:25–37. doi: 10.1002/mrm.1910120104. [DOI] [PubMed] [Google Scholar]
- 29.Charagundla SR, Borthakur A, Leigh JS, Teddy R. J. Magn. Reson. 2003;162:113–121. doi: 10.1016/s1090-7807(02)00197-0. [DOI] [PubMed] [Google Scholar]
- 30.Peters K, Richards FM. Chemical cross-linking: reagents and problems in studies of membrane structure. Ann. Rev. Biochem. 1977;146:523–551. doi: 10.1146/annurev.bi.46.070177.002515. [DOI] [PubMed] [Google Scholar]
- 31.Murphy-Boesch J, So GJ, James TL. Precision mapping of the B1 field using the rotating frame experiment. J. Magn. Reson. 1987;73:293–303. [Google Scholar]
- 32.Scremin OU. Cerebral Vascular system. In: Paxions G, editor. The Rat nervous System. Academic Press Inc; 1995. p. 2. [Google Scholar]
- 33.Quesson B, Thiaudiere E, Delalande C, Chateil J-F, Moonen CTW, Canioni P. Magnetization transfer imaging for rat brain under non-steady-sate conditions. Contrast prediction using a binary spin-bath model and super-Lorentzian lineshape. J. Magn. Reson. 1998;130:321–328. doi: 10.1006/jmre.1997.1326. [DOI] [PubMed] [Google Scholar]
- 34.Zhang W, Silva AC, Williams DS, Koretsky AP. NMR measurement of perfusion using arterial spin labeling without saturation macromolecular spins. Magn. Reson. Med. 1995;33:370–376. doi: 10.1002/mrm.1910330310. [DOI] [PubMed] [Google Scholar]
- 35.Zhang H, Wyrwicz AM. Paramagnetic relaxation enhancement in off-resonance rotating frame: from Gd-DTPA to MION. Intel. Soc. Magn. Reson. Med. 2000;8:2061. [Google Scholar]
- 36.Bulte JWM, Kraitchman DL. Iron oxide MR contrast agents for molecular and cellular imaging. NMR in Biomedicine. 2004;17:484–499. doi: 10.1002/nbm.924. [DOI] [PubMed] [Google Scholar]