

Abstract
After administration of gadolinium, infarcted myocardium exhibits delayed hyperenhancement and can be imaged using an inversion recovery (IR) sequence. The performance of such a method when using magnitude-reconstructed images is highly sensitive to the inversion recovery time (TI) selected. Using phase-sensitive reconstruction, it is possible to use a nominal value of TI, eliminate several breath-holds otherwise needed to find the precise null time for normal myocardium, and achieve a consistent contrast. Phase-sensitive detection is used to remove the background phase while preserving the sign of the desired magnetization during IR. Experimental results are presented which demonstrate the benefits of both phase-sensitive IR image reconstruction and surface coil intensity normalization for detecting myocardial infarction (MI). The phase-sensitive reconstruction method reduces the variation in apparent infarct size that is observed in the magnitude images as TI is changed. Phase-sensitive detection also has the advantage of decreasing the sensitivity to changes in tissue T1 with increasing delay from contrast agent injection.
Keywords: phase-sensitive reconstruction, inversion recovery, myocardial infarction, delayed hyperenhancement, intensity correction, cardiac imaging
Infarcted myocardium exhibits gadolinium-delayed hyperenhancement (1-6), and may be imaged using an inversion recovery (IR) sequence, typically 10-30 min after administration of the contrast agent. The inversion recovery time (TI) is typically set to null the normal myocardium signal, in order to maximize the contrast (ratio) between the normal and infarcted myocardium. Using magnitude reconstructed images, the performance of IR delayed hyperenhancement is highly sensitive to the TI selected. An error in selecting the optimum null time leads to a reduction in contrast, and may change the image appearance as well as introduce artifacts due to the loss of polarity information. We present experimental results that demonstrate the benefits of both phase-sensitive IR image reconstruction and surface coil intensity normalization for detecting myocardial infarction (MI).
Phase-sensitive detection can be used to remove the background phase while preserving the sign of the desired magnetization during IR (7-13). In this context, the term “background phase” includes effects due to off-resonance, surface coils, and receivers. Plots of signal intensity vs. TI for magnitude and phase-sensitive detection are shown in Fig. 1 for MI, blood, and normal myocardium. These curves and corresponding short-axis cardiac images illustrate the loss of polarity and reduction of contrast (Fig. 1a) for acquiring images earlier than the null time for normal myocardium. The use of phase-sensitive detection (Fig. 1b) avoids the need to precisely null the normal tissue, as is common practice with IR using magnitude detection (5). Rather, a “nominal” or “default” value of TI may be used, which is found empirically to null the normal myocardium at a given time from dose for a set of patients who have differing rates of contrast-agent washout (i.e., an average null time). This obviates the need to make additional breath-hold measurements to determine the precise null time for normal myocardium, which varies from patient to patient.
FIG. 1.
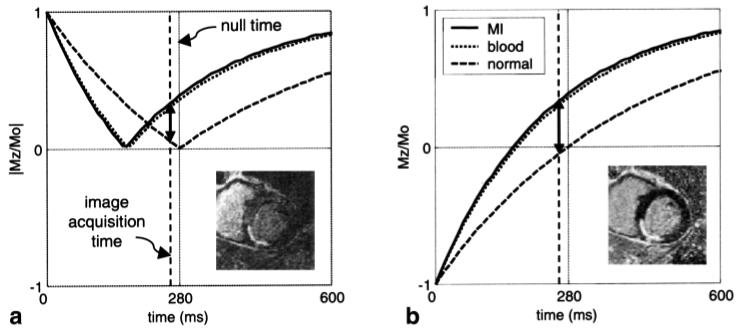
Plots of signal intensity vs. TI for (a) magnitude and (b) phase-sensitive detection for MI (solid), blood (dotted), and normal myocardium (dashed), using nominal values of T1 at 15 min following a double dose of contrast agent. Example images correspond to acquiring images earlier than the null time for normal myocardium. The solid lines with double arrows depict the contrast between the MI and the normal myocardium.
The contrast agent washes out of the normal and infarcted tissues at different rates, giving rise to the difference in tissue T1 values and observed delayed hyperenhancement. The T1 increases as the contrast agent washes out of the tissue. Conventional magnitude detection suffers a loss in contrast when the TI is smaller than the null time for normal tissue, since negative regions appear bright. In this case, using a fixed TI that nulls the normal myocardium at the start of a multislice acquisition (e.g., a short-axis stack) degrades the contrast at the final slice, which is acquired several minutes later, due to the increasing T1. Phase-sensitive detection achieves consistently good contrast during multislice imaging by decreasing the sensitivity to changes in the value of tissue T1 with increasing delay from contrast agent injection. Phase-sensitive detection has the additional benefit of background noise reduction (13,14), which leads to an improved contrast-to-noise ratio (CNR) between areas of high signal intensity, such as blood and infarcted myocardium, and regions of low signal intensity, such as nulled myocardium.
Surface coil intensity normalization (15-20) removes the large variation in image intensity due to the rapid fall-off in the surface coil field, thereby greatly improving the visualization of local tissue contrast. By using intensity normalization with phase-sensitive reconstruction, the image intensity window and level may be adjusted to maximize the contrast ratio (21), effectively shifting the null point without reacquiring additional images at various inversion times. In this manner, small differences in tissue intensity are not masked by the severe surface coil shading. Since contrast between blood and infarcted tissue is typically low, intensity normalization is particularly important in visualizing subendocardial infarcts.
The benefits of phase-sensitive reconstruction for application to IR have been well recognized (7-13). Nevertheless, the application of phase-sensitive reconstruction has been limited due to the challenge of obtaining a background phase reference. Most of the published works on phase-sensitive IR methods have pertained to brain imaging, in which there is minimal motion and the background phase due to field inhomogeneity has a relatively low spatial variation. In these cases, it is possible to obtain an estimate of the background phase either by a separate image acquisition without IR (12,13) or by estimating the phase from local statistics by a variety of methods (10,11). Multiple-image acquisitions using several TIs have been used to restore the signal polarity and estimate T1 by means of curve fitting (8).
Cardiac imaging poses unique challenges due to the combination of field inhomogeneity, motion, and low SNR, which makes it difficult to use these methods directly. Relatively large, local field inhomogeneity (22) leads to a rapid spatial variation in background phase. In this situation, methods that estimate the background phase by using the complex pixel values in a local region suffer phase errors due to the background variation. In addition, these rapid spatial variations force one to use a smaller region for background phase estimates, which limits the effective smoothing and leads to a noisy estimate. Indeed, in normal myocardium, the IR signal is nulled and as such the pixel values contain essentially noise.
Methods that require separate breath-hold image acquisitions to obtain a background phase reference are also problematic due to variability in slice position caused by respiratory motion. Due to the rapid spatial variation of the background, even small misregistration between the desired and background images may cause significant phase errors. Phase errors will degrade the SNR, may introduce artifacts, and may also alter the apparent infarct size.
Surface coil intensity normalization also has unique challenges in cardiac imaging due to motion, low SNR, and image contrast. Techniques that require separate acquisition of surface and body coil are subject to motion-related errors, and require additional breath-hold image acquisitions. Methods have been described that use only surface coil data and suppress image features by spatial blurring (15-17). Image features that are not suppressed will somewhat alter the contrast between tissue types. The noise will be greatly amplified in regions where the tissue is approximately nulled, such as normal myocardium.
The approach we have taken to solve these problems is to obtain a background reference at the same cardiac phase, during the same breath-hold acquisition. Using Gd-DTPA, the IR acquisition sequence requires two heartbeats for almost full magnetization recovery. Therefore, it is possible to acquire the reference image during alternate heartbeats without increasing the breath-hold duration. This type of acquisition provides a reference image with the full spatial resolution and eliminates misregistration errors due to motion. The reference image is used to estimate both the background phase and surface coil field maps. The SNR of the reference image is adequate, since the magnetization has almost fully recovered. An optimum B1-weighted combination of the individual phased-array coil images (23) is used to maximize the SNR of both the T1-weighted IR and the reference images. This improves the quality of the background phase estimate. Estimates of the relative B1 field maps are obtained from the reference coil images. The reference image has low tissue contrast, as desired for surface coil intensity normalization, and thus does not significantly alter the contrast of the normalized image.
Results are presented which demonstrate the benefits of this method, and quantitatively validate its performance. These include images from patients with MI at varied null times and elapsed times from contrast agent administration. SNR performance is characterized using phantom data.
METHODS
Pulse Sequence
The pulse sequence is diagrammed in Fig. 2. For each slice, imaging was performed in mid-diastole using a prospectively gated segmented acquisition of k-space over several heartbeats during a single breath-hold. IR pulses were applied every other heartbeat to permit full recovery of magnetization in the presence of Gd-DTPA. This minimizes any disruption of the steady state due to heart rate variability. A reference phase map was acquired during the same breath-hold and cardiac phase in alternate heartbeats using a reduced flip angle readout. In this manner, both the IR and reference image are spatially registered, avoiding errors due to respiratory and cardiac motion. Also note that the overall imaging time was not increased by the reference acquisition, and that the reference acquisition with reduced flip angle readout resulted in only a small loss of magnetization to the IR image.
FIG. 2.

Pulse sequence diagram for gated, segmented k-space acquisition of IR and reference images using low flip-angle readouts. Data for IR and reference images are collected alternately every other heartbeat.
A fast gradient-recalled echo pulse sequence was used with interleaved phase-encode ordering. The inversion was performed via a nonselective, adiabatic pulse. The T1-weighted IR image was acquired using multiple 20°flip angle pulses, while the reference used 5° flip angle pulses. The reference image was acquired after the magnetization had virtually recovered. The use of a 5° flip angle for the reference image reduces the T1 contrast of this image, and minimizes relaxation effects on the primary T1-weighted IR image.
Parameters were as follows: bandwidth =±31.25 kHz, TE = 3.4 ms, TR = 7.8 ms. The typical FOV was 360 mm × 270 mm, with an image matrix of 256 × 96; thus the in-plane spatial resolution was approximately 1.4 mm × 2.8 mm for both the IR and the reference images (final images were interpolated to 256 × 192, 1.4 mm2). The slice thickness was 8 mm. The 96 phase encodes were acquired in 12 heartbeats by collecting 16 lines of k-space per heartbeat, with two R-R intervals between inversion pulses. The acquisition time (segment duration) was 124.8 ms per R-R interval, acquired during diastasis, which is a period of relatively little motion.
Phase-Sensitive Reconstruction
The phase-sensitive reconstruction method is diagrammed in Fig. 3. Thumbnail images are shown for illustration purposes. To improve the SNR of the image, as well as the accuracy of the background phase estimate, the complex images for each coil were optimally combined (weighted sum) (23) prior to phase-sensitive detection. The phase of the reference image was removed from the T1-weighted IR image on a pixel-by-pixel basis, and, as a result, the real part of the resultant image preserved the polarity of the IR signal. The spatial resolution was the same for both the reference and T1-weighted IR image, as previously described.
FIG. 3.
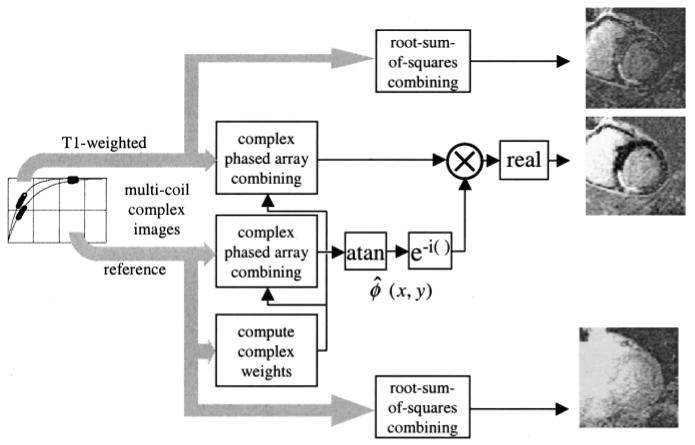
Block diagram showing the phased-array phase-sensitive reconstruction of IR image using a separate reference image acquired after magnetization recovery.
The complex weights used for phased array combining were the complex conjugates of the estimates of relative coil sensitivities, which were normalized by the noise variance for each coil. The use of relative, rather than absolute, coil sensitivities (B1-maps) alleviated the need for separate acquisition of body coil images. The relative, complex coil sensitivities were estimated using the individual complex reference coil images, using a procedure similar to that used for adaptive phased array combining (24), extended here to the case of phase-sensitive detection with a separate reference image. By applying the same B1-weighted complex combining to both the T1-weighted IR and the reference image, any phase error in the B1-maps was canceled in the phase-sensitive (homodyne) image.
The method for estimating the complex weights is diagrammed in Fig. 4. A sample correlation matrix Rij(x,y) for each pixel (x,y) is calculated from the individual complex coil reference images, (i.e., , where fi(x,y) is the complex reference image for the i-th coil, and * denotes complex conjugate), and then spatial smoothing is applied to reduce the noise. The spatial smoothing uses a5 × 5 pixel (after interpolation to 1.4 mm2 pixels) spatial low-pass kernel, corresponding to a 7 mm × 7 mm region. The coil sensitivity profile in the heart region does not vary significantly over the width of the smoothing kernel. The sample correlation removes the image phase while preserving the relative phase between coils, which is essential for optimum coherent combining. The estimate of the relative complex coil sensitivities is derived from the smoothed correlation values by calculating the dominant eigenvector for each pixel (eigenvector corresponding to the maximum eigenvalue). Normalization may be implemented before or after the sample correlation; however, since the reference image has low image contrast, it was deemed advantageous to normalize after smoothing due to the moderately low SNR of the reference. The phased array combining weight vector for optimum SNR is calculated by multiplying the inverse noise covariance matrix times the complex conjugate of the sensitivity estimate. The noise covariance estimate is simplified by ignoring the noise correlation between coils (off diagonal elements) and simply normalizing the sensitivity vector by the noise variances measured prior to image acquisition. The eigen-vectors are calculated to have unit norm, and thus the weights result in a uniform noise image (23) with root-sum-of-squares magnitude weighting (prior to intensity normalization, described next).
FIG. 4.

Method for adaptively estimating phased-array combiner coefficients using the multicoil complex reference images.
Intensity Normalization
Intensity normalization was performed to remove the large variation in signal level due to the surface coils. The phase-sensitive image was normalized by dividing on a pixel-by-pixel basis by the reference magnitude image after it had been spatially smoothed to reduce the noise, as shown in Fig. 5. Spatial smoothing used a 2D median filter typically over a 7 × 7 pixel (after interpolation to 1.4 mm2 pixels) region (25). The edge preserving median filter avoids altering the contrast, particularly at the boundaries (such as the myocardial-lung boundary). The effectiveness of surface coil intensity normalization was validated by comparing the ratio of intensities in right ventricle (RV) and left ventricle (LV) blood pool regions for both unnormalized and normalized images, for 10 patients. The reference image was acquired with a low flip angle readout (5°) after almost complete IR to reduce the T1-weighting, which is undesirable for surface coil intensity normalization. The small residual contrast between the myocardium and LV blood pool in the reference image was measured for 10 patients; this contrast is from a variety of mechanisms (see the Discussion section). To measure the contrast between myocardium and blood in the presence of large surface coil variations, the profile from RV to mid-LV through the mid-septal wall was plotted, and a linear curve (1-2 cm) was fit between RV and LV intensities adjacent to the myocardium. The ratio of blood-to-myocardium was then estimated at mid-wall.
FIG. 5.
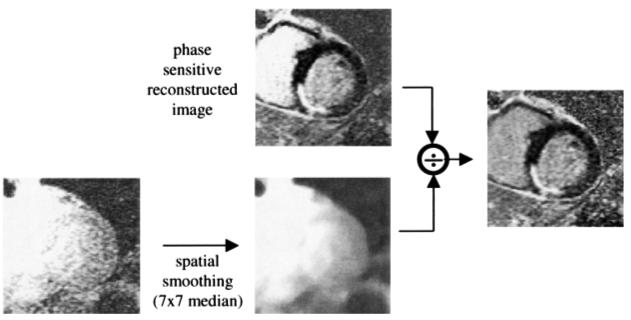
Surface coil intensity normalization.
SNR Measurement
SNR measurements were performed to validate the expected SNR improvement of phase-sensitive reconstruction (13,14) and to assess any SNR losses that may have been incurred due to a noisy reference. A complete characterization was performed with both experimental phantom data and simulated datasets. Typical SNR values for the operating regime were established by measurements of SNR in selected patient images for both the reference and T1-weighted IR images. CNR measurements comparing LV blood pool to normal myocardium were measured in a set of 20 patients using both magnitude and phase-sensitive reconstructions.
The use of a noise-only region-of-interest (ROI) to measure noise statistics free of signal (26,27) is well established for measuring the SNR of magnitude images, since it overcomes the difficulty encountered due to nonuniform image intensity. The measurement of SNR for intensity normalized phase-sensitive images with optimum B1-weighted combining is further complicated since, in this case, the noise-only regions are no longer valid for estimating the background noise. This is because there was no estimate of the B1-map in regions without tissue. An alternative method was used to measure the noise variance, which used a spatial filter to remove low spatial frequency signal components (28).
To validate that phase-sensitive reconstruction and intensity normalization performed as expected despite the low SNR of the reference image, a number of controlled measurements were made. Data were acquired for several phantom experiments at a range of SNRs for both the reference and T1-weighted IR images. These measurements could be compared directly with simulation results. SNR for phantom images was measured using the spatial filtering method (28) for both magnitude and phase-sensitive images. The SNR of the magnitude images was also measured using the more conventional noise-only ROI method as a check that the spatial filter method was adequately suppressing the low-frequency signal fluctuation.
Measurements were made from patient datasets to determine the range of typical SNRs for both T1-weighted IR and reference images. This was done to support conclusions regarding the SNR operating regime. Secondly, measurements of CNR were made to compare the magnitude and phase-sensitive reconstruction methods. For the latter case, the spatial filtering method was used to remove the low-frequency signal variations. This method was restricted to measuring the noise variance in the LV blood pool region, which had ROIs of over 100 independent pixels. CNR measurements were made with the TI set to null the normal myocardium in order to optimize the CNR for the magnitude images. For determining the typical SNR regime, it was possible to use the magnitude images alone, and use the simpler noise-only ROI method. When using the noise-only ROI method with magnitude-detected images, the standard deviation (SD) of the noise-only region and the mean value for signal-plus-noise region were corrected for the effects of magnitude detection (27). Following this approach, an equivalent input SNR was then calculated, which is equivalent to the SNR of a linear detector (such as the phase-sensitive detector). The equivalent input SNR = An/σ is defined as the ratio of An, the root-sum-of-squared magnitudes of the signal components for individual phased-array coils (for n coils), and σ, the SD of the Gaussian noise which is additive to the real and imaginary components of the complex signal for each coil. Procedurally (27), the noise mean (μ0) and SD (σ0) are estimated for a noise-only ROI (root-sum-of squares magnitude image), and the value of σ is estimated as . The mean signal component An is estimated from the signal-plus-noise combined magnitude Mn by removing the noise bias (look-up table procedure).
Figure 6 illustrates probability distributions for signal plus noise at varying input SNRs. Figure 6a curves are calculated using the noncentral chi distribution corresponding to magnitude detection (root sum of squares) with four coils (27), and Fig. 6b curves are calculated as Gaussian distributions corresponding to phase-sensitive real images. The increased sensitivity of phase-sensitive images at low SNR is readily evident (13,14) from the distributions. While the most meaningful comparison of these methods, which have different distributions, is based on detection statistics (i.e., sensitivity and specificity for discriminating two tissue types based on thresholding), the simplest means is to compare an output SNR statistic, such as SNRo = (μ - μo)/σ (13), where μ and μo are the means for signal plus noise and noise only, respectively, and σ is the SD for signal plus noise. SNRo was measured for a phantom at several TIs, using several values of the reference readout flip angle to acquire a set of images with varying SNR as well as varying reference SNR.
FIG. 6.
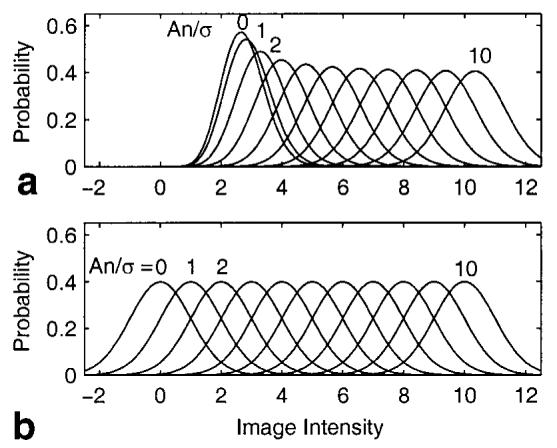
Probability distributions of signal-plus-noise for (a) magnitude and (b) phase-sensitive detection for phased array with four coils.
Simulations were performed to quantify the effect of errors in the background phase estimate, as well as the effect of SNR of the surface coil intensity reference image on the resultant SNR and CNR of the normalized phase-sensitive reconstructed image. These simulations consisted of calculating sample statistics in a Monte Carlo fashion using 32000 noise samples per resultant output.
Experimental Parameters
Images were acquired from patients with suspected coronary disease under two clinical research protocols approved by the Institutional Review Board of the National Heart, Lung, and Blood Institute, with prior informed consent. A stack of short-axis slices (typically eight slices) was acquired on all patients. In a number of patients, a single short-axis slice was imaged repetitively (at approximately 1-min intervals) using a sequence of TI values (typically with a step of 25 ms, in the range of 125-325 ms). Images were acquired 10-30 min after administration of a double dose (0.2 mmol/kg) of contrast agent (gadopentetate dime-glumine, Berlex Magnevist). The majority of the patients were imaged following a single dose (0.1 mmol/kg) first-pass rest perfusion study, with the second single dose (0.1 mmol/kg) administered immediately after the first-pass imaging. All experiments were conducted using a GE Signa CV/i 1.5T MRI system. Images were acquired using a GE four-element cardiac phased array, consisting of two pairs of overlapped, rectangular coils (19 cm × 11.5 cm with the long dimension oriented along the superior-inferior direction, and 2-cm overlap in the left-right direction), with one pair positioned on the chest and the second pair positioned on the back of the patient.
The size of hyperenhanced myocardium (estimate of infarcted region) was measured with computer-assisted planimetry by two trained observers on images using magnitude and normalized phase-sensitive reconstruction. Measurements were made with the TI set to null the normal myocardium (within approximately 10 ms), and for TI set 75 ms less. Infarct sizes for nine patients measured using both methods and values of TI were compared using a paired t-test.
A number of experiments were conducted using phantoms to measure SNR. This was to characterize the behavior of phase-sensitive image reconstruction and intensity normalization based on a low SNR reference. The phantom data were acquired and reconstructed using parameters typical for a cardiac exam. The TI and reference image RF readout flip angle were varied to obtain images at a range of SNRs typically observed in patients. The phantom was a 17.5-cm-diameter sphere with T1 ≈ 333 ms, with cardiac coils spaced approximately 20 cm apart (placed on top and bottom). For the SNR tests, images were acquired with TIs in the range of 65-400 ms. Measurements were taken every 10 ms in the range of 200-300 ms bracketing the null point. The RF flip angle for the T1-weighted IR image was 20°, and the reference flip angle was varied using values of 1.25°, 2.5°, and 5° to test the effect of varying reference image SNR. Other imaging parameters were the same as described for cardiac imaging. The acquisition was triggered using a simulated ECG signal at a rate of 60 bpm. The ROI size used was approximately 900 statistically independent samples (pixels prior to interpolation to final image size) for both signal-plus-noise and noise-only regions.
Magnitude, phase-sensitive, and surface coil intensity normalized phase-sensitive IR images were reconstructed for all studies. Magnitude reference images were reconstructed as well.
RESULTS
Patient Images
Single-slice, short-axis images of the heart reconstructed using both magnitude (top row) and normalized phase-sensitive (bottom row) detection are shown in Fig. 7 for a patient with MI, with varying TIs for columns from left to right. The images in Fig. 7 correspond to a patient with an inferior MI. In Fig. 7, the images for columns from left to right were acquired at TI = 175, 200, 225, 250, 275, and 300 ms, respectively. Both magnitude and phase-sensitive images were acquired using the same breath-hold data, as previously described. In this case, the normal myocardium is nulled at approximately 300 ms, as may be observed in the upper right magnitude image (Fig. 7f). A myocardial infarct along the inferior wall is clearly hyperenhanced in this image. With TI = 175 ms, the infarct is approximately nulled, and the normal myocardium is negative, which appears bright in the magnitude image (Fig. 7a). At a TI of 250 ms, the normal myocardium is still negative, while the blood and the infarct are positive, resulting in similar magnitudes with virtually no contrast between normal and infarcted tissue (Fig. 7d). Phase-sensitive reconstructed images (Fig. 7g-l), which preserve the signal polarity and appearance of image, maintain excellent contrast over a wide range of TIs. The images were acquired approximately 30 min after administration of a double dose of Gd-DTPA.
FIG. 7.
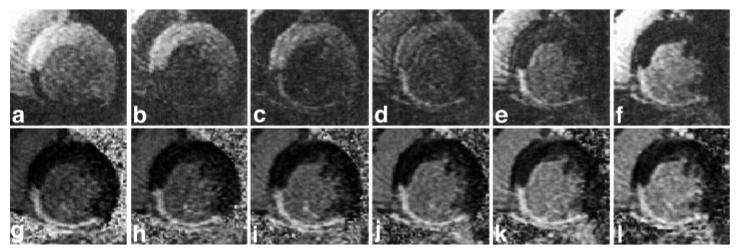
Short-axis images at varied TIs for a patient with inferior MI. Magnitude (top row) and normalized phase-sensitive (bottom row) detection for TI = 175, 200, 225, 250, 275, and 300 ms from left to right. The appearance and contrast are variable for the magnitude-reconstructed images, while they are consistent for the normalized phase-sensitive reconstruction.
A short-axis stack of images from another patient with a large MI in the inferior wall is shown in Fig. 8. Each slice was acquired in a separate breath-hold, approximately 45 s apart over a total duration of 4 min. These images were acquired 22-26 min following contrast agent injection, using a fixed TI of 300 ms. The magnitude (top row) and phase-sensitive (bottom row) images for each slice were acquired in the same breath-hold. The normal myocardium is approximately nulled for the middle slices (Fig. 8c, d, i, and j); however, a slight degradation in contrast is seen in the magnitude images of the first slices (Fig. 8a and b), for which the TI is too short, and toward the end (Fig. 8f). The phase-sensitive images (Fig. 8g-l) achieve uniform contrast.
FIG. 8.
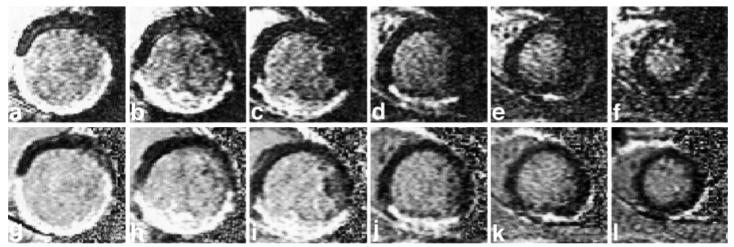
Short-axis stack images for another patient with inferior MI, comparing magnitude (top row) and normalized phase-sensitive (bottom row) detection for six slices, acquired over approximately 4 min for columns from left to right (basal to apical). A slight degradation in contrast is seen in the magnitude images for the (a and b) basal slices, for which the TI is slightly less than the null time for the normal myocardium, while a uniform contrast is achieved in the (g-l) phase-sensitive images acquired simultaneously.
Figure 9 compares unnormalized and surface coil intensity normalized images at various image intensity window and level display settings. The use of surface coil intensity normalization allows the adjustment of displayed image intensity window and level to shift the “null” to improve the contrast ratio of the MI with either normal myocardium or blood. In the case of the unnormalized images in Fig. 9a-c, the surface coil intensity varies considerably across the large infarcted region. Also note that as the window level is adjusted to null the blood, thereby increasing the apparent MI-to-blood contrast (ratio), a portion of the MI (indicated by arrow) is lost in the unnormalized image of Fig. 9c. The normalized images in Fig. 9d-f have a more uniform intensity across the MI, and may be adjusted to improve the contrast displayed.
FIG. 9.
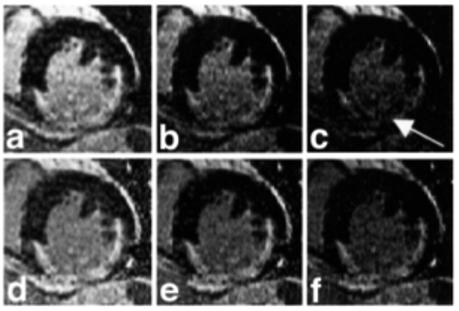
Example short-axis images shown at different display signal intensity levels (window and level) illustrate the uniformity across the MI region (a-c) before and (d-f) after surface coil intensity correction.
Performance Data
The apparent infarct size for magnitude images appears smaller for images acquired with TI less than the null time for normal myocardium, while the infarct size for phase-sensitive reconstructed images appears consistently the same size. This may be seen by visual comparison of the infarct in magnitude images of Fig. 7c and f, and phase-sensitive reconstructed images of Fig. 7i and l, acquired 75 ms earlier than the null and at the approximate null time, respectively. The apparent infarct size measurements correlated well between the two observers for both magnitude reconstruction (y = 1.00x + 6.4, mm2, R = 0.90) and for phase-sensitive reconstruction (y = 0.92x + 11.9, mm2, R = 0.93). There was no significant bias between observers on Bland-Altman analysis.
On average, the apparent infarct size when comparing magnitude and phase-sensitive reconstruction methods obtained at the TI for nulling the normal myocardium was similar. The ratio of infarct size for the two methods (phase-sensitive and magnitude) was 1.07 ± 0.09 (mean ± SD, P = 0.05, N = 9). Apparent infarct size decreased significantly on magnitude reconstruction images obtained at 75 ms less than the TI null (224 ± 143 mm2 vs. 387 ± 181 mm2, P < 0.001). The ratio of infarct size at 75 ms early to the size at optimum null time was 0.54 ± 0.17 (mean ± SD). The same raw data reconstructed with phase-sensitive methods showed no significant change in infarct size on images obtained at a TI 75 ms less than the TI null (433 ± 239 mm2 vs. 421 ± 212 mm2, P = 0.45). The ratio of infarct size at 75 ms early to the size at optimum null time was 1.00 ± 0.10 (mean ± SD). Thus, even severe errors in setting the TI do not affect apparent infarct size when using phase-sensitive reconstruction, but would lead to clinically large errors with the magnitude reconstruction method.
SNR measurements were made on a series of 10 patients to establish the typical ranges of SNR for further analysis. The SNR in the “nulled” normal myocardium region for the IR image was 2.6 ± 1.8 (mean ± SD) in the septal region, and 1.8 ± 0.8 in the posterior region. These values reflect those of several patients for whom the normal myocardium was not precisely nulled. The corresponding SNR for the normal myocardium for the reference image was 11.1 ± 3.3 in the septal region and 6.9 ± 2.2 in the posterior region. The measured SNR in the LV blood pool for the IR image was 12.4 ± 5.1. In the LV blood pool region, the ratio of the SNR of the reference to the SNR of the IR image for a given patient was 0.95 ± 0.33.
The output SNR of the phantom images for both magnitude and phase-sensitive reconstruction methods is plotted in Fig. 10a for three values of reference flip angles equal to 1.25°, 2.5°, and 5°. The corrected input SNR (An/σ) for the reference image was estimated from output SNR measurements to be approximately 4, 8, and 16 for these flip angles. The RF readout flip angle for the IR image was maintained constant at 20°. The measured output SNR is plotted vs. the magnetization |Mz/Mo| = |1 - 2 exp(-TI/T1)|, for direct comparison with simulations shown in Fig. 10b, which plots output SNR vs. input SNR = An/σ.
FIG. 10.

Output SNR for magnitude and normalized phase-sensitive images for (a) measured phantom data SNR vs. |Mz/Mo| for three values of reference image SNR, and (b) Monte Carlo simulation of output SNR vs. input SNR for approximately the same three values of reference SNR plus ideal noise-free reference. The bold lines correspond to magnitude detection. The reference SNR for phase detection is 4, 8, and 16, for diamond, circle, and squares, respectively. The simulated ideal noiseless reference case shown in b is plotted using triangles. The gray shaded region in b corresponds to typical SNR values for LV blood pool or MI, for which the reference SNR is greater than or equal to the SNR of the IR image.
Figure 10b shows the results of simulations that were performed for the same values of reference SNR, plus the additional case of an ideal noise-free reference. Fortunately, in cardiac imaging applications the reference SNR will depend on the input SNR of the IR image. In the nulled myocardium region, where there is low SNR, there is essentially no SNR loss due to the noisy reference because the reference SNR is greater than that of the IR image. In the higher-SNR regions of LV blood pool and MI, the SNR loss is minor. This is indicated by the shaded region in Fig. 10b, which corresponds to SNR values for which the reference SNR is greater than or equal to the SNR of the IR image.
Figure 11 shows the CNR between the LV blood pool and normal myocardium measured for 20 patients using both magnitude and phase-sensitive reconstruction methods. The mean (± SD) CNR was 7.8 ± 2.7 and 8.7 ± 2.2 for magnitude and phase-sensitive methods, respectively. The measured CNR for the phase-sensitive method was generally greater than that for the magnitude method, as seen in Fig. 11, where most of the data points are above the dotted line corresponding to CNRphase = CNRmag.
FIG. 11.
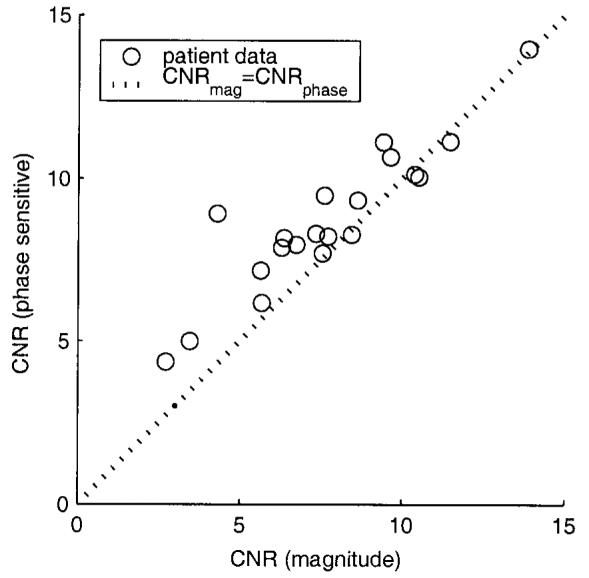
CNR between LV blood pool and normal myocardium for both magnitude and phase-sensitive reconstruction methods measured for 20 patients.
The measured variation of signal intensity (ratio of RV to LV) due to surface coil sensitivity variation was reduced from a mean of 1.86 (σ= 0.38) before normalization, to 1.05 (σ= 0.1) after normalization (N = 10, paired t-test P < 0.001), demonstrating the effectiveness of surface coil intensity normalization. Despite the use of a low flip angle reference, the reference image exhibited some contrast between the blood and normal myocardium. The ratio of LV blood pool to normal myocardium signal intensity had a mean of 1.23 (σ= 0.14, N = 10).
The signal intensity of the IR image for the phantom was measured as a function of the reference flip angle. A plot of IR image signal intensity vs. TI is shown in Fig. 12 for reference image RF readout flip angle values of 1.25°, 2.5°, and 5°. The signal intensities were within 5% across a wide range of TIs, thereby validating that there is minimal signal loss due to the reference image acquisition.
FIG. 12.
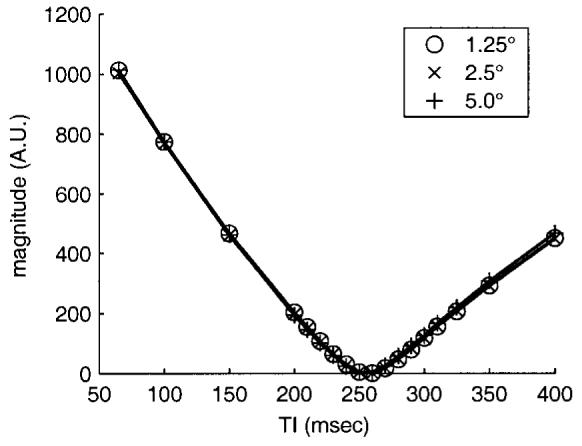
Signal intensity of phantom IR image vs. TI for several values of reference image RF readout flip angle, validating minimal loss in the IR image due to reference image acquisition.
DISCUSSION
The accuracy of setting the null TI in a clinical setting depends on operator expertise, contrast agent clearance rate, and patient tolerance to additional breath-hold acquisitions. This exhibits a wide variability in practice. Using phase-sensitive reconstruction in IR delayed hyperenhancement studies, it is possible to use a nominal value of TI, eliminate several breath-holds otherwise needed to find the optimal TI, and achieve a consistent contrast. The phase-sensitive reconstructed images have polarity restored, and after the window and level are adjusted a consistent contrast is achieved over a wide range of TIs, without artifacts due to incorrect polarity. As a result of surface coil intensity normalization, the window and level of displayed intensities may be adjusted after the fact to null infarct, blood, or normal myocardium across the entire heart.
The phase-sensitive reconstruction method dramatically reduces the variation in apparent infarct size (and appearance) that is observed in the magnitude images as TI is changed. This is believed to be a result of partial volume effects, which have a manifestly different appearance for the two methods, and which alter the apparent position of the infarct boundary in magnitude images. For the magnitude images, the profile of the infarcted region is also altered to a slight degree by the noise bias, whereas the phase-sensitive images are unbiased. A typical eight-slice, short-axis stack acquisition may take as long as 5-7 min, during which time the optimum null time will typically increase by approximately 15-25 ms (at a nominal 15 min from a double dose of contrast agent). The loss in CNR (MI-to-normal myocardium) for conventional magnitude detection with a TI set 15 ms earlier than the null TI is approximately 25%. With phase-sensitive reconstruction the polarity is restored, avoiding this severe loss. Loss in contrast due to loss of polarity in magnitude images was verified by acquiring patient data at various TIs and times from dose (Fig. 7).
For the purpose of detecting and sizing regions of MI, the contrast and CNRs between the MI and normal myocardium, and between MI and blood are the most relevant metrics. The contrast of the MI to blood and normal myocardium is affected by a number of variables, such as the TI, pulse sequence parameters (5), and clearance rate of the contrast agent, which depends on the specific patient and elapsed time from dose. Generally, the CNR between MI and normal myocardium is much greater than that between the MI and blood, as seen in Fig. 1 by noting the difference between the Mz values for a given TI. The low CNR between MI and blood, particularly at a short elapsed time from dose, makes it difficult to accurately detect and size subendocardial infarcts. With TI set to null the normal myocardium, the MI and blood have a fairly high SNR; thus, the MI-blood CNR is approximately the same for both magnitude and phase-sensitive images, as may be seen by the distributions (Fig. 6). In situations where the MI and blood have lower SNR, such as setting TI for infarct nulling (6), the improved SNR using the phase-sensitive method leads directly to an improved CNR. The SNR advantage of the phase-sensitive method may also be more pronounced at lower dosages of contrast agent, or after stress studies that have a more rapid washout of contrast agent.
The accuracy of CNR measurements is limited by small ROI sizes and inhomogeneous intensity. Therefore, the SNR performance of this method was validated using phantom data and corresponding simulations. The intent in this work was to characterize any significant alteration (gain or loss) in contrast due to phase-sensitive image reconstruction and/or surface coil intensity normalization, rather than to characterize the contrast or contrast mechanisms in delayed hyperenhancement imaging. Due to the low SNR regime of the reference, particularly in the inferior region of the myocardium, the B1-weighted phased array combining, which was performed prior to the phase-sensitive detection, provided an advantage over performing phase-sensitive detection on a coil-by-coil basis prior to array combining. It was found that despite the low SNR of the reference image, errors in the background phase estimate contributed negligibly to SNR loss. The phantom experiment reasonably emulated the characteristics that are important for validating the SNR of the phase-sensitive reconstruction method. The SNR values of the phantom image bracketed the SNR values for the cardiac application, and the T1 was a mid-range value between that of blood and normal myocardium tissue at 15 min after administration of a double dose of contrast agent. The anterior and posterior RF receive coils were spaced somewhat closer than the human torso; however, this did not affect the significance of the results.
The most significant loss in SNR was due to surface coil intensity normalization. Nevertheless, the SNR of the intensity normalized phase-sensitive images exceeded the SNR of the corresponding magnitude image under most circumstances. It is noted that while the noise component due to intensity normalization is correlated over a small region (due to spatial smoothing of the reference image), the CNR of regions spaced greater than approximately 7 pixels incur this loss. However, most importantly, there is negligible loss in contrast between blood and MI. The loss in SNR due to a noisy reference image is reduced by means of smoothing the reference image. The degree of smoothing was limited to avoid significantly altering the image. Breath-hold registration is less critical for intensity normalization than for background phase, since the surface coil sensitivity varies relatively smoothly across the heart region while strong susceptibility-induced gradients cause rapid phase variation. It may be possible to use additional reference data acquired separately to further improve the intensity normalization; however, it was deemed that the improvement would be slight, with a moderately large increase in complexity.
The contrast (average value of 23% between blood and myocardium) of the reference image, due to several mechanisms, slightly reduced the image contrast between MI and normal myocardium of the normalized image. The contrast mechanisms included proton density, T1-weighting, , and inflow. The contrast due to T1-weighting was observed primarily at increased heart rates. At an increased heart rate the magnetization may not be fully recovered even after two heartbeats, thereby causing additional T1-weighting of the reference and a slight shift in the null time for normal myocardium in the IR image. Inflow effects may contribute to the contrast, particularly when there are timing errors caused by heart rate changes. These result in acquisition at cardiac phases where there is increased flow. The CNR between blood and myocardium is typically quite high (5-15). Furthermore, there is already a CNR gain due to phase-sensitive detection (10-20%). Therefore, loss in contrast due to surface coil intensity correction is traded for improved display characteristics.
For magnitude images, there is little to no contrast between the nulled normal myocardial and the lung, with the exception of instances in which there is a layer of fat, fluid, or fibrous tissue. However, the myocardium-lung boundary is fairly well defined in the reference image. As a result, the intensity normalized phase-sensitive images have better definition of the lung tissue boundary, since the lung is much noisier relative to the myocardium. This can be observed by comparing Fig. 7e and f (magnitude) with Fig. 7k and l (phase-sensitive). Improved contrast between the epicardium and lung should facilitate determining the transmural extent of anterior, anterolateral, and posterior infarcts. This may also be realized by measurements using both IR and reference magnitude images.
Using the method described here, the conventional magnitude image, as well as the phase-sensitive and reference images, is produced for each breath-hold acquisition. This is useful for comparison purposes. In a few cases for which there were severe microvascular obstructions, leading to a dark core in the MI of the magnitude image, the reference image had a corresponding T1-weighted dark area. In these cases, the reference is useful as an aid to interpreting the resultant magnitude image, and if the obstruction is so severe as to cause a sign error in the phase-sensitive image (which is rarely observed), the reference image may easily be used to resolve the ambiguity. This has only been observed in one out of 25 cases studied.
It is worth noting the difference between the point-spread functions for magnitude and phase-sensitive detection methods. The IR (combined with a multishot readout) leads to a nonuniform k-space weighting, which can give rise to image artifacts. The k-space weighting is nonuniform, since each inversion (heartbeat segment) has 16 phase-encodes with the pulse sequence parameters used. The phase-encode order is interleaved such that the overall weighting is generally increasing in a smooth manner. Note that the variation from segment to segment is quite low, since the magnetization has almost fully recovered after two heartbeats. The asymmetrical weighting leads to a complex point spread function, for which the primary distortion is an artifact caused by the imaginary component. The artifact appears as spatial differentiation along the phase-encode direction, which enhances the edges and causes ringing at regions with rapid amplitude or phase changes in the complex image. For phase-sensitive detection, the imaginary component is discarded, thus eliminating the edge artifact, provided that the background phase estimate is reasonably accurate. Using magnitude detection (root sum of squares), the quadrature component (imaginary point spread function) is suppressed such that the artifact is generally in the noise. In practice, it has been found that there is little artifact at boundaries such as the myocardium and LV blood pool, because the slope of the IR is quite similar despite the difference in values of T1. There may be circumstances, such as longer segment duration, in which the artifact is not sufficiently suppressed by magnitude detection. In these cases the real point spread function of the phase-sensitive method may have an advantage. Experimentally, there were no image artifacts attributed to the nonuniform k-space weighting.
Finally, since the gated, segmented acquisition uses two heartbeats between inversion pulses for nearly complete magnetization recovery, the acquisition of the additional reference image during alternate beats does not increase the overall breath-hold duration.
CONCLUSIONS
A method for phase-sensitive IR for detecting MI using Gd-DTPA-delayed hyperenhancement has been presented, and the results demonstrate several benefits of this approach. The use of phase-sensitive detection avoids the need to precisely null the normal tissue, as is common practice with IR using normal magnitude detection. The phase-sensitive approach restores the signal polarity, thus avoiding loss of contrast and providing a consistent image appearance without polarity artifacts for cases where TI is set too early. The phase-sensitive reconstruction method dramatically reduces the variation in apparent infarct size which is observed in the magnitude images as TI is changed. Nominal values of TI may be used, thus obviating the need to perform additional breath-hold scans to accurately determine the null point for normal myocardium. This also decreases the dependence of contrast on changes in the tissue T1 value with increasing delay from injection, which will occur during multislice imaging. This increased tolerance has value in a clinical environment, where a stack of eight short-axis slices may take 5 min to acquire. The same uniformly good contrast was achieved using phase-sensitive reconstruction at a nominal value of TI over a wide range of delays from initial injection. Phase-sensitive detection has the additional benefit of a reduction of background noise (13,14), which leads to an improved CNR between bright areas, such as blood and infarct regions, and regions with low signal intensity, such as the nulled myocardium. The use of surface coil intensity correction greatly improves the ability to display small changes in local tissue contrast. This is particularly important in visualizing subendocardial infarcts, which have a low contrast between blood and infarcted tissue.
Further clinical evaluation of this method is being performed on a larger patient population.
ACKNOWLEDGMENTS
The authors gratefully acknowledge the support of Raymond Kwong, M.D., Suresh Rejhraj, M.D., Kwabena Agyeman, M.D., and Steve Liao for their invaluable assistance with patient data.
REFERENCES
- 1.Kim RJ, Fieno DS, Parrish TB, Harris K, Chen EL, Simonetti O, Bundy J, Finn JP, Klocke FJ, Judd RM. Relationship of MRI delayed contrast enhancement to irreversible injury, infarct age, and contractile function. Circulation. 1999;100:1992–2002. doi: 10.1161/01.cir.100.19.1992. [DOI] [PubMed] [Google Scholar]
- 2.Kim RJ, Wu E, Rafael A, Chen EL, Parker MA, Simonetti O, Klocke FJ, Bonow RO, Judd RM. The use of contrast-enhanced magnetic resonance imaging to identify reversible myocardial dysfunction. N Engl J Med. 2000;343:1445–1453. doi: 10.1056/NEJM200011163432003. [DOI] [PubMed] [Google Scholar]
- 3.Kim RJ, Hillenbrand HB, Judd RM. Evaluation of myocardial viability by MRI. Herz. 2000;25:417–430. doi: 10.1007/s000590050034. [DOI] [PubMed] [Google Scholar]
- 4.Wu KC, Rochitte CE, Lima JA. Magnetic resonance imaging in acute myocardial infarction. Curr Opin Cardiol. 1999;14:480–484. doi: 10.1097/00001573-199911000-00005. [DOI] [PubMed] [Google Scholar]
- 5.Simonetti OP, Kim RJ, Fieno DS, Hillenbrand HB, Wu E, Bundy JM, Finn JP, Judd RM. An improved MR imaging technique for the visualization of myocardial infarction. Radiology. 2001;218:215–223. doi: 10.1148/radiology.218.1.r01ja50215. [DOI] [PubMed] [Google Scholar]
- 6.Schussheim AE, Aletras AH, Kwong RY, Balaban RS, Arai AE. Quantitative MRI analysis of human myocardial infarction suggests benefits of infarct-nulling contrast. AHA Scientific Sessions; New Orleans: 2000. p. 251. [Google Scholar]
- 7.Young IR, Bailes DR, Bydder GM. Apparent changes of appearance of inversion-recovery images. Magn Reson Med. 1985;2:81–85. doi: 10.1002/mrm.1910020110. [DOI] [PubMed] [Google Scholar]
- 8.Gowland PA, Leach MO. A simple method for the restoration of signal polarity in multi-image inversion recovery sequences for measuring T1. Magn Reson Med. 1991;18:224–231. doi: 10.1002/mrm.1910180123. [DOI] [PubMed] [Google Scholar]
- 9.Ahn CB, Cho ZH. A new phase correction method in NMR imaging based on autocorrelation and histogram analysis. IEEE Trans Med Imaging. 1987;6:32–36. doi: 10.1109/TMI.1987.4307795. [DOI] [PubMed] [Google Scholar]
- 10.Borrello JA, Chenevert TL, Aisen AM. Regional phase correction of inversion-recovery MR images. Magn Reson Med. 1990;14:56–67. doi: 10.1002/mrm.1910140107. [DOI] [PubMed] [Google Scholar]
- 11.Xiang QS. Inversion recovery image reconstruction with multiseed region-growing spin reversal. J Magn Reson Imaging. 1996;6:775–782. doi: 10.1002/jmri.1880060511. [DOI] [PubMed] [Google Scholar]
- 12.Park HW, Cho MH, Cho ZH. Real-value representation in inversion-recovery NMR imaging by use of a phase-correction method. Magn Reson Med. 1986;3:15–23. doi: 10.1002/mrm.1910030104. [DOI] [PubMed] [Google Scholar]
- 13.Noll DC, Nishimura DG, Macovski A. Homodyne detection in magnetic-resonance-imaging. IEEE Trans Med Imaging. 1991;10:154–163. doi: 10.1109/42.79473. [DOI] [PubMed] [Google Scholar]
- 14.Bernstein MA, Thomasson DM, Perman WH. Improved detectability in low signal-to-noise ratio magnetic resonance images by means of a phase-corrected real reconstruction. Med Phys. 1989;16:813–817. doi: 10.1118/1.596304. [DOI] [PubMed] [Google Scholar]
- 15.Axel L, Constantini J, Listerud J. Intensity correction in phased array surface coil imaging. Am J Roentgenol. 1987;148:418–420. doi: 10.2214/ajr.148.2.418. [DOI] [PubMed] [Google Scholar]
- 16.Listerud J, Lenkinski RE, Kressel HY, Axel L. The correction of non-uniform signal intensity profiles in magnetic resonance imaging. J Digit Imaging. 1989;2:2–8. doi: 10.1007/BF03168007. [DOI] [PubMed] [Google Scholar]
- 17.Murakami JW, Hayes CE, Weinberger E. Intensity correction of phased-array surface coil images. Magn Reson Med. 1996;35:585–590. doi: 10.1002/mrm.1910350419. [DOI] [PubMed] [Google Scholar]
- 18.Wallner BK, Edelman RR, Bajakian RL, Kleefield J, Atkinson DJ, Mattle HP. Signal normalization in surface-coil MR imaging. Am J Neuroradiol. 1990;11:1271–1272. [PMC free article] [PubMed] [Google Scholar]
- 19.Narayana PA, Brey WW, Kulkarni MV, Sievenpiper CL. Compensation for surface coil sensitivity variation in magnetic resonance imaging. Magn Reson Imaging. 1988;6:271–274. doi: 10.1016/0730-725x(88)90401-8. [DOI] [PubMed] [Google Scholar]
- 20.McVeigh ER, Bronskill MJ, Henkelman RM. Phase and sensitivity of receiver coils in magnetic resonance imaging. Med Phys. 1986;13:806–814. doi: 10.1118/1.595967. [DOI] [PMC free article] [PubMed] [Google Scholar]
- 21.Wolff SD, Balaban RS. Assessing contrast on MR images. Radiology. 1997;202:25–29. doi: 10.1148/radiology.202.1.8988186. [DOI] [PubMed] [Google Scholar]
- 22.Reeder SB, Faranesh AZ, Boxerman JL, McVeigh ER. In vivo measurement of T*2 and field inhomogeneity maps in the human heart at 1.5 T. Magn Reson Med. 1998;39:988–998. doi: 10.1002/mrm.1910390617. [DOI] [PMC free article] [PubMed] [Google Scholar]
- 23.Roemer PB, Edelstein WA, Hayes CE, Souza SP, Mueller OM. The NMR phased array. Magn Reson Med. 1990;16:192–225. doi: 10.1002/mrm.1910160203. [DOI] [PubMed] [Google Scholar]
- 24.Walsh DO, Gmitro AF, Marcellin MW. Adaptive reconstruction of phased array MR imagery. Magn Reson Med. 2000;43:682–690. doi: 10.1002/(sici)1522-2594(200005)43:5<682::aid-mrm10>3.0.co;2-g. [DOI] [PubMed] [Google Scholar]
- 25.Pratt WK. Digital image processing. John Wiley & Sons; New York: 1978. pp. 330–333. [Google Scholar]
- 26.Henkelman RM.Measurement of signal intensities in the presence of noise in MR images [Published erratum in Med Phys 1986;13:544] Med Phys 198512232–233. [DOI] [PubMed] [Google Scholar]
- 27.Constantinides CD, Atalar E, McVeigh ER. Signal-to-noise measurements in magnitude images from NMR phased arrays. Magn Reson Med. 1997;38:852–857. doi: 10.1002/mrm.1910380524. [DOI] [PMC free article] [PubMed] [Google Scholar]
- 28.De Wilde JP, Lunt JA, Straughan K. Information in magnetic resonance images: evaluation of signal, noise and contrast. Med Biol Eng Comput. 1997;35:259–265. doi: 10.1007/BF02530047. [DOI] [PubMed] [Google Scholar]