

Abstract
PURPOSE
To determine whether myocardial arterial perfusion and oxygen concentration can be quantified simultaneously from the same images by using spin labeling and the blood oxygenation level-dependent (BOLD) effect with fast spin-echo (SE) imaging.
MATERIALS AND METHODS
A T2-weighted fast SE pulse sequence was written to image isolated, arrested, blood-perfused rabbit hearts (n = 6) at 4.7 T. Perfusion images with intensity in units of milliliters per minute per gram that covered the entire left ventricle with 0.39 × 0.39 × 3.00-mm resolution were obtained in less than 15 minutes with a 32-fold reduction in imaging time from that of a previous study. Estimates of oxygen concentration were made from the same images acquired for calculation of perfusion images.
RESULTS
Estimates of regional myocardial oxygen content could be made from the perfusion images; this demonstrated the feasibility of three-dimensional calculation of regional oxygen consumption, which requires concomitant measurement of both oxygen content and flow. Fast SE imaging was shown to bas sensitive to hemoglobin desaturation as standard SE imaging. Perfusion abnormalities and oxygen deficits were easily identified and verified qualitatively with gadopentetate dimeglumine on both perfusion and BOLD images obtained after coronary arterial ligation.
CONCLUSION
T2-weighted fast SE imaging combined with perfusion-sensitive spin labeling can be used to measure myocardial arterial perfusion and oxygen concentration. This provides the groundwork for calculation of regional myocardial oxygen consumption.
Cardiovascular disease remains the leading cause of death in the United States (1). In vivo measurement of regional myocardial oxygen consumption remains an important goal toward the assessment of myocardial viability, since cardiac function is critically dependent on the ability of the myocardium to consume oxygen. Traditionally, total organ oxygen consumption has been estimated from total flow through the organ and from arteriovenous differences in blood oxygen levels. This method, however, does not account for tissue heterogeneity in either oxygen delivery or metabolic activity.
Current methods for determining regional oxygen consumption and perfusion that are compatible with clinical application include phosphorus 31 or carbon 13 nuclear magnetic resonance (MR) spectroscopy (2-6); positron emission tomography with carbon 1 to carbon 11, nitrogen 14, oxygen 17, rubidium 82, or fluorine 18 isotopes (7-11); and single photon emission computed tomography (CT) with thallium 201 or technetium 99 (12). These techniques, although they are valuable, require ionizing radiation and are limited by poor spatial and temporal resolution. Coronary catheterization techniques with radiopaque dyes can provide information about flow, but they are projection techniques that offer no depth information.
In recent years, developments in cardiac MR imaging (7,9,13) and CT (7,14-16) have relied on the use of exogenous contrast agents. Their mechanisms of signal modulation in vivo are poorly understood, however, which makes perfusion quantification difficult.
More recently, several noninvasive MR spin-labeling methods to estimate tissue perfusion have been introduced. These methods are used to detect flow enhancement by using selective radio-frequency pulses to alter the magnetization of flowing or static spins. The adiabatic fast-passage spin-labeling method proposed by Williams et al (17) has been demonstrated to estimate arterial myocardial perfusion quantitatively. This technique, however, has been demonstrated only at superphysiologic perfusion (5–22 mL/min/g) and requires a long inflow track that precludes in vivo application. The echo-planar MR imaging and signal targeting with alternating radio-frequency, or EPISTAR, method has been applied to measure perfusion qualitatively in the brain (18) and is related to time-of-flight MR angiography (19). Kwong et al (20,21) and Kim (22) applied a nonselective/selective inversion method in the brain, although no distinction can be made between arterial and venous flows, and perfusion estimates obtained by using this method are qualitative. We recently introduced a spin-labeling method that provides noninvasive quantitative estimates of myocardial arterial perfusion (23) and avoids many of the problems of the above techniques.
We previously exploited the blood oxygenation level–dependent (BOLD) effect with T2-weighted spin-echo (SE) imaging to estimate regional oxygen content in both arrested and beating, isolated, blood-perfused rabbit hearts (24-26). Wendland et al (27) observed decreases in image intensity from in vivo rat myocardium during episodes of apnea by using T2*-weighted echo-planar imaging. In addition, Niemi et al (28) used echo-planar imaging to measure enhancement of signal intensity from human myocardium during infusion with dipyridamole. Dipyridamole decreases the concentration of deoxyhemoglobin through increases in perfusion caused by coronary vasodilation. Other groups have also done similar work with animal models (29,30) and in vivo (31).
Measurement of regional oxygen consumption in tissue can be determined by measuring regional oxygen content and tissue perfusion. In this work, we determine the feasibility of combining spin labeling and T2-weighted BOLD imaging to measure arterial perfusion and oxygen content simultaneously from the same images.
MATERIALS AND METHODS
Perfusion Imaging with MR Spin Labeling: T1 Weighting
We developed a noninvasive spin labeling method that provides quantitative estimates of coronary arterial perfusion as previously described (23). This technique relies on the unique geometry of the coronary vasculature in which arterial blood flows predominantly from the base to the apex (32,33). Coronary arteries descend from the root of the aorta along the epicardial surface and then dive into the myocardium toward the endocardium, while venous drainage runs parallel with the arteries, but flow is in the opposite direction.
Selective inversion of the magnetization in the short-axis section of interest along with all myocardium on its apical side renders any flow-induced enhancement of signal intensity insensitive to venous flow, ensuring that only unlabeled arterial spins can act to enhance tissue signal intensity. The behavior of longitudinal magnetization after selective preinversion in the myocardium and in regions of low and high flow is shown in Figure 1. Calculation of perfusion images is described in the Appendix.
Figure 1.

Diagram depicts pulse sequence timing. Fast SE imaging is preceded by slab inversion and a delay τ. The inversion radio-frequency sinc spans 8π radians to create a selective inversion with a sharp transition and high inversion efficiency. Two T1 recovery curves show the differential enhancement seen between regions of high and low arterial perfusion. M0 = without preinversion, τopt = optimal time between refocusing pulses.
BOLD Imaging: T2 Weighting
The BOLD effect has been used extensively in the evaluation of oxygenation in the brain (34-36) and myocardium (24-28). The approach relies on the fact that deoxyhemoglobin unlike oxyhemoglobin is paramagnetic (37). Hemoglobin is concentrated in erythrocytes, which are in turn confined to the intravascular space. This compartmentalization in concert with the paramagnetism of deoxyhemoglobin generates spatially dependent susceptibility gradients when oxygen tension is low. These gradients enhance transverse magnetization dephasing (T2*), which manifests as reduced signal intensity on gradient-echo T2*-weighted images.
Although SE imaging will refocus static inhomogeneities generated by deoxyhemoglobin, it remains sensitive to the dephasing of spins caused by the diffusion of spins through these local gradients. Also, Boxerman et al (38) have shown that SE imaging is most sensitive to compartmentalization of deoxyhemoglobin in capillary-sized vessels, implying that T2-weighted SE imaging is sensitive to the oxygen tension in myocardial capillary beds. Last, a linear relationship between normalized signal intensity and hemoglobin saturation has been demonstrated previously at SE imaging in rabbit myocardium (26).
The modulation of T2 with hemoglobin saturation is strongly dependent on the time between refocusing pulses (τ180). According to the measurements by Wright et al (39) and the numeric predictions by Bandettini et al (40), however, the modulation of T2 should be only moderately affected for the τ180 used with the fast SE sequence in these experiments (8.4 msec, see Discussion). The Appendix contains further elaboration on this subject and also include a discussion of the construction of calibration curves for calculation of tissue oxygenation from signal intensities.
Isolation and Perfusion of the Rabbit Heart
Isolation, attachment, and perfusion of hearts from New Zealand White male rabbits (2–4 kg, n = 6) has been previously described in detail (23-26). In all hearts, a snare occluder was placed on the left anterior descending coronary artery for ligation near the conclusion of the experiment, as previously described (23,26).
The height of a perfusate reservoir was varied to adjust coronary flow that was measured from a cannula in the pulmonary artery by using an MR-compatible flow meter (Transonics, Ithaca, NY). Heart preparations that failed to maintain stable coronary flow were not used. The heart preparations that failed to used. The heart preparations were maintained at 39°C, as previously described (23), since T1 is temperature dependent (41).
Perfusate Composition
A modified Krebs-Henseleit buffer was used as the initial perfusate during the attachment of the heart to the Langendorff apparatus. This buffer contained the following: NaCl, 118.0 mmol/L; KH2PO4, 1.2 mmol/L; MgSO4, 1.0 mmol/L; NaHCO3, 25.0 mmol/L; KCl, 4.8 mmol/L; CaCl2, 2.5 mmol/L; and dextrose, 5.0 mmol/L. The buffer was not recirculated and was saturated with 95% O2 and 5% CO2 (39°C, pH 7.4) with a low-volume membrane oxygenator (42). Bovine serum albumin (3% weight by volume) was added to prevent formation of edema in the myocardium. Bovine serum albumin was dialyzed for 24 hours (10,000–molecular weight dialysis tubing; Sigma Chemical, St Louis, Mo) against 20 volumes of a NaCl (118 mmol/L) and CaCl2 (2.5 mmol/L) solution to remove low-molecular-weight contaminants. Dialysis also saturated the albumin calcium binding sites to help maintain a physiologic concentration of calcium in the final perfusate.
After attachment, the perfusate was switched to a cardioplegic solution (modified St Thomas Hospital solution [43]) containing the following; NaCl, 110.0 mmol/L; NaHCO3, 10.0 mmol/L; KCl, 16.0 mmol/L; MgCl2, 16.0 mmol/L; CaCl2, 1.2 mmol/L; and dextrose, 5.0 mmol/L. Bovine serum albumin (3% weight by volume) was added to prevent tissue edema (see previous paragraph). Washed sheep red blood cells (HemoStat Laboratories, Dixon, Calif) obtained 1 day after venipuncture and processing were resuspended in the cardioplegic solution to a final hematocrit level of 32%–36%. The red blood cell perfusate was oxygenated with the same membrane oxygenator described previously. (Throughout the remainder of the article, “blood” will be used in place of “red blood cell perfusate.” The authors acknowledge the blood and the perfusate used in these experiments).
Two gas lines—one carrying 95% O2 and 5% CO2 and the second carrying 95% N2 and 5% CO2—were connected to the oxygenator. The relative flows of the two lines were changed to vary the partial pressure of the oxygen in the perfusate and hence the hemoglobin saturation. Leukocyte adhesion filters (Pall filters; KOL Biomedical Instruments, Chantilly, Va) were used to prevent coronary embolization caused by particulate matter and/or microaggregates in the red blood cell perfusate. This perfusate was recirculated.
Animal Care Guidelines
All animals in this study received humane care in compliance with the guidelines set forth in “Principles of Laboratory Animal Care” formulated by the National Society for Medical Research and the “Guide for the Care and Use of Laboratory Animals” prepared by the Institute of Laboratory Animal Resources, Commission on Life Sciences, National Research Council and published by the National Academy of Sciences for the National Institutes of Health (44).
Imaging Examinations
All imaging was performed on an Omega CSI 4.7-T nuclear MR spectrometer (GE Medical Systems, Milwaukee, Wis) equipped with shielded gradients (S-150 Accustar). This gradient set has maximum gradient strengths of approximately 19 G/cm (0.19 T/m) and slew rates of 27 G/cm/msec (270 T/m/sec). A homebuilt loop-gap radio-frequency coil (31-mm diameter) tuned to 200.08 MHz (proton resonance) was used for imaging. The coil was wrapped around a closed-end, cylindric, acrylic bathing chamber in which the heart was suspended.
Interleaved fast SE (45) and standard SE sequences were used for all imaging; the fast SE sequence is shown in Figure 1. The echo train length was 32; conventional phase encoding was used for fast SE, in which the phase-encoding gradient was rewound after each readout gradient (45,46). T2 weighting was achieved by means of encoding central lines of k space at later echoes in the echo train (46). A 90° phase shift between the initial 90° excitation and subsequent 180° refocusing pulses was used to align all SEs. This 90x:180y:180y:180y … scheme gave constructive alignment of SEs and stimulated echoes, as described by Plewes and Bishop (47). Small hardware phase errors can necessitate the need for phase correction algorithms (48), although such algorithms were not found to be necessary with these experiments, as ghost artifacts were negligible.
Inversion of myocardial water spins in the imaging section along with all myocardium on its apical side was achieved with a 2-msec selective 180° pulse (Fig 1). High uniformity of the inversion slab was achieved by using a symmetric sinc radiofrequency pulse spanning 8π radians. The large number of sinc lobes created a sharp transition between the inverted and noninverted myocardium, reduced side-lode excitation, and improved inversion efficiency.
Experimental Protocol and Data Acquisition
Following isolation and attachment of the heart, the apparatus was inserted into the magnet and a stack of six to eight left ventricular short-axis images was prescribed from SE scout images. The inversion slab was prescribed and its shape and tip angle were optimized by using a long-axis profile that contained mostly myocardium. This procedure was performed in all hearts studied (n = 6).
In all hearts, two images were acquired sequentially from each section. The first was a four-short fast SE image (echo-train length, 32) preceded by one shot that was discarded to ensure that magnetization was in a steady state (49). Each shot was preceded with a selective inversion pulse and a 2.1-second delay and was followed by a 10-second delay for T1 recovery (repetition time, 12,100 msec; τ180 8.4 msec). Section thickness was 3 mm, field of view was 50 mm, and pixel resolution was 128 × 128, which gave voxel dimensions of 0.39 × 0.39 × 3.00 mm. Bandwidth was ±50 kHz. The central line of k space was positioned at the fifth echo, producing an effective echo time of 42 msec. The second image was an additional fast SE image, identical to the first, but obtained without the preinversion pulse and the 2.1-second delay.
Last, in four of the six hearts, an additional standard T2-weighted SE image was acquired with the same imaging parameters as for the previous fast SE image, but the repetition time for this image was 1,000 msec. Each T2-weighted SE image was acquired immediately after each fast SE image without preinversion to ensure that the tissue oxygenation status was identical in the event of fluctuations in oxygen content. No averaging was performed for any image, and 12–20 sets of images were acquired in this manner for each heart at different flows and oxygen concentrations.
The total imaging time for each fast SE image was approximately 1 minute, and the imaging time for T2-weighted SE images was 2 minutes. With eight sections and including the images reconstruction time, the total imaging time for all sections for one oxygenation and flow level was approximately 30 minutes. When only fast SE images were acquired, total imaging time was reduced to approximately 15 minutes. This represents a 32-fold reduction in imaging time from that of previous perfusion imaging with SE pulse sequences (23).
Experiments were conducted within 3 hours to ensure myocardial viability, although it has been shown that this preparation can remain viable for as long as 6 hours (50). This allowed the procedure described previously to be repeated at three to five oxygenation levels and two to four coronary flow rates. Following each change in oxygenation, 15 minutes was allowed for equilibration prior to imaging. Oxygenation measurements were taken after each section was acquired by withdrawing blood samples from the pulmonary arterial cannula. Hemoglobin saturation was calculated by using an algorithm for sheep hemoglobin based on blood gases and by using pH (51) measured with a blood-gas analyzer (ABL-3; Radiometer, Copenhagen, Denmark).
In all experiments, the left anterior descending coronary artery was occluded following acquisition of data sets at different oxygenation levels. Fast SE images with or without preinversion were acquired immediately after ligation, with no change in perfusion pressure.
Finally, a series of 16-shot fast SE images (repetition time, 400 msec; echo time, 42 msec) were acquired over all section after administration of a 25-mL bolus injection of 20 mmol/L gadopentetate dimeglumine into the perfusate line. These images were used to delineate qualitatively regions of perfusion deficit. The images were acquired sequentially from base to apex, and imaging was repeated for several minutes.
RESULTS
Perfusion Images
A panel of 18 images is shown in Figure 2. Values for inversion efficiency and T1 were taken as the measured values of 0.81 and 2.25 seconds, which were typical and highly reproducible (23). No masking was performed in these calculations since perfusion images delineated the heart anatomy as well as and sometimes better than the fast SE images. The septum in these images appeared collapsed because the left ventricle was vented to atmospheric pressure, whereas right ventricular circulation remained closed as the perfusate in the right ventricle exited through the pulmonary arterial cannula.
Figure 2.

Typical fast SE images acquired in six of eight sections covering the left ventricle include images acquired without preinversion (M0), images with preinversion (Mτ), and perfusion (f) images calculated (Eq [A1]) on a pixel-by-pixel basis from the images with and without preinversion. Image signal intensity of perfusion images is in units of milliliter per minute per gram, and an intensity scale is shown to map pixel intensity to perfusion values. LV = left ventricular, PM = papillary muscle, RV = right ventricle, Septum = interventricular septem.
Mean pixel intensities in septal and free wall regions in different sections in the perfusion images in Figure 2 were approximately 2.0 mL/min/g, with notable and expected heterogeneity, as observed by King et al (52) and predicted by Bassingthwaighte et al (53). The total coronary flow from this 10.0-g heart was 18 mL/min (measured from a pulmonary arterial cannula with a flow meter), which made the mean perfusion through the myocardium 1.8 mL/min/g, which was in close agreement with that seen in the perfusion images. Bright regions in the right and left ventricular cavities were due to the movement of bulk flow in the perfusion chamber down through the imaging section.
Perfusion images were calculated in all hearts (n = 6) at different flow levels. Figure 3 is a plot of the coronary flow (in milliliter per minute per gram) estimated from perfusion images against the mean total coronary flow, which was determined by dividing the total coronary flow measured from the pulmonary arterial cannula by the wet weight of the heart. Estimates of mean coronary flow were made from images by averaging pixel intensities in regions of interest confined to the left ventricular wall. The right ventricular wall was excluded from these estimates because of concern for partial voluming effects. Exclusion of the right ventricular wall from mean perfusion estimates was expected to introduce little error, however, since the proportion of total flow to the right ventricular wall is small, and the mean coronary perfusion of left and right ventricular myocardia is similar (54-56).
Figure 3.

Plot of estimated perfusion from images (fimages) against mean total coronary perfusion (favg) from six hearts at different flows. Mean total coronary flow was determined by dividing the total coronary flow (in milliliters per minute) measured from the pulmonary arterial cannula by the wet weight of the heart (in grams).
A strong correlation (r = 0.97, n = 6) was found between the estimated mean perfusion (measured from images) and the total mean coronary flow (measured from the pulmonary arterial cannula). The slope and intercept of a liner least-squares fit of these data were 1.11 ± 0.03 (mean ± SD) and −0.43 ± 0.08, respectively. The deviation from a slope of 1.0 and an intercept of 0.0 was consistent with thebesian venous losses not measured at the pulmonary arterial cannula.
Typical signal-to-noise ratios in images with preinversion were 25–35, and signal-to-noise ratios in images without preinversion were greater than 60. According to previous analysis (23), the minimum perfusion difference Δf that can be detected with 95% certainly, or perfusion resolution, is
| (1) |
where λ is the blood-tissue water partition coefficient in units of milliliters of water per gram of myocardium, τ is the inversion delay, T1 is the spin-lattice relaxation time, W is the inversion efficiency, SNR is the signal-to-noise ratio, and N is the number of pixels averaged in a region. For an SNR of 30, a T1 of 2.25 seconds, a τ of 2.1 seconds, a W of 0.81, and a 10 × 10 region of interest, minimum perfusion differences of 0.2 mL/min/g were discernible.
Figure 4 shows calculated perfusion images from three of eight sections in a different heart from that shown in Figure 3 that were acquired immediately before and after occlusion, of the left anterior descending coronary artery. Mean total coronary perfusion was 1.6 mL/min/g before occlusion and the perfusion pressure was held constant. After occlusion, the total mean perfusion decreased to 1.1 mL/min/g. The mean total perfusion determined from perfusion images across the left ventricular wall in all sections was 1.8 mL/min/g before the occlusion and 1.2 mL/min/g after the occlusion, which was in close agreement with the mean total perfusion.
Figure 4.

Perfusion images calculated before (Pre-Occlusion) and after (Post-Occlusion) occlusion in three of eight sections spanning the entire left ventricle. Regions of perfusion deficit are visible in the left ventricular free wall (arrows) and are also delineated on early and late gadolinium-enhanced images (Early Gd. [Low Conc.] and Late Gd. [High Conc.]). Flow in the occluded region was approximately 0 mL/min/g. Scale for image intensity in late images is not the same as that for early images.
Regions of perfusion deficit in the region of the left ventricular free wall were seen easily and were verified qualitatively with early and late gadolinium-enhanced images. Early gadolinium-enhanced images were acquired with low concentrations of gadopentetate dimeglumine, and enhancement was governed primarily by changes in T1. Late gadolinium-enhanced images were acquired at relatively high concentrations of gadopentetate dimeglumine, and normal regions were heavily T2 weighted.
Perfusion measured in the occluded region of the perfusion images, delineated by the gadolinium-enhanced images, was approximately 0 mL/min/g. A scale is shown to map signal intensity to perfusion values (Fig 4).
Oxygenation Measurements
A marked decrease in signal intensity was observed on T2-weighted fast SE images as hemoglobin saturation decreased. Figure 5 shows three T2-weighted fast SE images without preinversion pulses. Hemoglobin saturations of the images in Figure 5a and 5b are 50.5% and 100%, respectively, which resulted in a 31% difference in signal intensity averaged over the entire left ventricular wall. Figure 5c was acquired 14 minutes after ligation of the left anterior descending coronary artery, with 100%-saturated arterial blood. The occluded region was expected to be at 0% Saturation since 14 minutes is sufficient time to allow complete desaturation of occluded regions in arrested hearts (26). The mean signal intensity in the occluded region was 52% lower than in that in the septum.
Figure 5.
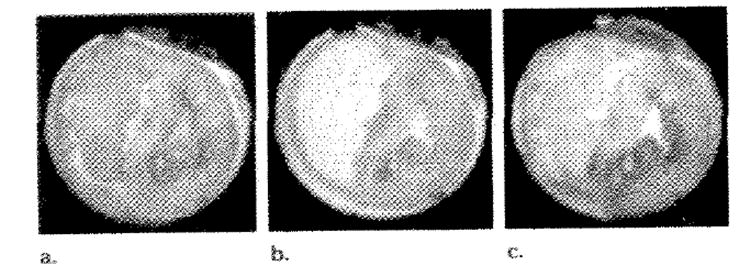
Three T2-weighted fast SE images without preinversion acquired at (a) 50.5% (b) 100%, (c) 100% hemoglobin saturation. c was acquired 14 minutes after occlusion of the left anterior descending coronary artery. These images demonstrate the BOLD signal intensity modulation as oxygenation levels in the myocardium are adjusted and were also used in the generation of the perfusion images in Figure 4 (third section).
These images are the same images (with out preinversion) used to calculate the perfusion images shown in Figure 4 (third section). The occluded region in Figure 4 overlaps substantially with the region of oxygen deficit seen in Figure 5c.
In four of the six hearts studied, standard T2-weighted SE images were acquired in addition to the two fast SE images needed for perfusion measurements. For images acquired at different oxygenation levels, Figure 6 is a plot of the signal intensity of SE images against the signal intensity of the fast SE image acquired immediately after this image and at the same section location. For each SE-fast SE image pair, a region of interest was chosen to include all of the left ventricular myocardium. Values from SE images were normalized to the intensity of the left ventricular wall from the 100% oxygen-saturated SE images, and, similarly, values from fast SE images were normalized to the 100% oxygen-saturated fast SE images to remove the effects of gain and T1 saturation of SE images. The effects of T1 saturation will be removed since T1 does not depend on blood oxygenation (25). The relationship between these values was found to be highly linear, with a correlation coefficient r of 0.93. The linear equation describing this line was as follows: SSE = (1.15 ± 0.08)SFSE − (0.16 ± 0.06), where SSE is the SE image signal intensity and SFSE is the fast SE image intensity.
Figure 6.

Plot of normalized SE image signal intensity against normalized fast SE (FSE) image signal intensity from images acquired in four hearts at the same section location, temporally adjacent, and at different hemoglobin saturations. Regions of interest covered the entire myocardium of the left ventricle and the same region of interest was used for an SE-fast SE image pair. arb. = arbitrary.
Figure 7 is a plot of the normalized T2-weighted fast SE signal intensity against hemoglobin saturation from one heart preparation. Least-squares linear regression yielded the following relationship: SFSE = (8.3 ± 0.6) × 10−3 (hemoglobin saturation) + (1.6 ± 0.5) × 10−1, r of 0.99. This graph demonstrates how signal intensity can then be used to map signal intensity to oxygenation levels in the tissue for a given heart. Similar work has been done previously by Atalay et al with T2*-weighted gradient-echo imaging (24) and T2-weighted SE imagine (26).
Figure 7.

Plot of normalized T2-weighted SE image signal intensity against hemoglobin (Hb) saturation at four oxygenation levels is an example of an oxygenation calibration curve from a typical heart preparation.
DISCUSSION
Summary of Results
A method for simultaneous noninvasive measurement of myocardial arterial perfusion and myocardial oxygen content has been presented in the isolated, blood-perfused, arrested rabbit heart. By using a previously verified method of spin labeling and the principles of BOLD imaging, concomitant measurement of perfusion and oxygen content was performed in six to eight sections covering the entire left ventricle in less than 15 minutes. The primary advantages of simultaneous acquisition of perfusion and oxygenation information is a reduction in the total acquisition time and improved image registration between oxygen concentration images and perfusion images.
Myocardial perfusion measurements were performed by using a selective slab that inverted all spins in the imaging section and those apical to that section and by relying on the unique geometry of the coronary vasculature to ensure that enhancement of signal intensity resulted from arterial perfusion. Acquisition of a second image without preinversion enabled the calculation of a perfusion image whose signal intensity was a direct measure of arterial perfusion in units of milliliters per minute per gram.
Excellent registration between images with or without preinversion resulting from reduced imaging times of the fast SE sequence permitted direct calculation of perfusion images on a pixel-by-pixel basis.
Perfusion defects created by ligation of the left anterior descending coronary artery were easily detected with this method and were highly correlated with images acquired after bolus injection of gadopentetate dimeglumine. Signal intensities measured in the core of perfusion deficit regions were found to be approximately 0 mL/min/g. The low perfusion measurements could not be a result of decreased T2 or spin density, since these effects are identical on the images with and without inversion and cancel out in the perfusion calculation (Eq [A1]).
The implementation of fast SE in conjunction with the spin-labeling method provided a 32-fold reduction in imaging time by increasing the number of ky lines acquired during one excitation from one to 32. This permitted an improvement in image resolution from previous work (23) and complete coverage of the entire left ventricle with six to eight sections.
All images required for perfusion calculations were also T2-weighted. This meant that the images acquired without selective preinversion could be used also for estimation of oxygen content. The signal intensities from these images were found to have excellent liner correlation with those of the standard SE images acquired in the same locations and at the same oxygen tension (r = 0.093). Since we have previously shown that signal intensity on T2-weighted SE images obeys a liner relationship with hemoglobin saturation (26), these results demonstrate that normalized fast SE signal intensity also demonstrates a liner relationship with hemoglobin saturation and therefore can be used in the determination of oxygen content. The equation describing the relationship between SE and fast SE image signal intensity is as follows: SSE = (1.15 ± 0308)SFSE−(0.16±0.06). The slope of this relationship is not significantly different from 1, which implies that fast SE imaging is equally sensitive to hemoglobin saturation as SE imaging is equally sensitive as SE imaging.
It may have been expected that SE imaging would be slightly more sensitive than fast SE to hemoglobin saturation since the observed T2 depend on τ180. This dependence has been measured be Wright et al (39) and has been predicted by Bandettini et al (40). Their results shown that the observed T2 decreases with increasing τ180 at lower hemoglobin saturations, while the T2 at 100% saturation is unaffected by τ180.
Construction of calibration curves for normalized signal intensity with changes in hemoglobin saturation must be performed for a particular τ180 since there is a strong dependence of observed T2 on τ180. Normalization to the 100% hemoglobin saturation for the calibration curve is also important to remove the effects of regional differences in blood volume (24). Similarly, good image registration would, in principle, allow for calculation of calibration images. Blood volume, oxygen consumption, and perfusion are the relevant parameters affected most under pathologic conditions.
An advantage of the perfusion imaging scheme described previously is that information about both perfusion and oxygen content can be collected simultaneously by T2 weighting both images acquired for estimates of perfusion (Mτ, M0). The perfusion information is T1 encoded and oxygen content is T2 encoded; these effects are separable. Since the same T2 weighting exists in both images, this effect is exactly canceled on division as part of the perfusion image calculation (Eq [A1]).
Although T2 weighting the perfusion images allows for simultaneous acquisition of perfusion and oxygen content information, it has drawbacks. The primary disadvantage is that the image signal-to-noise ratio will decrease, which reduces perfusion resolution (23), especially in regions of oxygen deficit. As was seen in Figure 5, for example, signal intensity can decrease by as much as 50% in ischemic regions, which reduces the perfusion resolution by 50%. This is because the images acquired with preinversion must also be T2-weighted to cancel the T2 weighting of the image acquired without perfusion in the perfusion calculation.
Clearly, optimization of the imaging parameters can be performed to enhance our ability to measure regional perfusion and oxygen content simultaneously at MR imaging. We have previously described methods for optimizing echo time for T2-weighted SE imagine in the estimation of oxygen content (25). An optimization for T2-weighted fast SE imaging for measuring oxygen content also of τ180. Also, the optimum echo time for measuring oxygen content may be suboptimal for perfusion sensitivity, which decreases in regions with low oxygen content.
Toward Combination of Perfusion and Oxygen Content into Regional Oxygen Consumption Measurements
All measurements necessary for oxygen consumption were available for the hearts studied. Oxygen consumption was not calculated in these experiments, however, because of the low metabolic rate that accompanies cardioplegic arrest. As a result, there were no detectable differences in transcoronary hemoglobin saturation under these conditions. In situations in which oxygen consumption is appreciable, oxygen consumption can be calculated as follows.
By using the perfusion image f and the oxygen content image [O2]tiss, oxygen consumption MVO2 can be calculated as the product of the oxygen extraction (arterial oxygen concentration minus the tissue oxygen concentration) and the arterial perfusion as follows: MVO2 = ([O2]art − [O2]tiss) × f, where [O2]art is the oxygen concentration measured at the arterial input line and [O2]tiss is oxygen concentration determined from T2-weighted fast SE images, a fast SE image at 100% oxygen saturation, and a calibration curve.
A method for noninvasively measuring regional myocardial perfusion and regional myocardial oxygen content by using arterial spin labeling and the BOLD effect has been presented. This provides a foundation for laboratory and clinical measurement of regional myocardial oxygen consumption.
Practical applications
The advent of imaging techniques that can be used to measure metabolic processes, if they are successful, promises to revolutionize diagnostic and prognostic procedures that are currently in practice. The ability to estimate noninvasively the rate of oxygen consumption in the heart would provide the clinician with a tool to examine basic energy metabolism and the relationship of oxygen consumption to mechanical function. Conceivably, increased sensitivity to detection of mild ischemia, reversibly damaged myocardium, and perfused and viable but noncontracting tissue may have a profound influence on future therapeutic interventions and treatments.
The additional information available with the successful clinical implementation of these techniques includes estimations of regional flow with high spatial and/or temporal resolution, regional oxygen extraction, and regional oxygen consumption. Continued improvements in fast imaging techniques and new cardiacgating strategies have provided substantial promise for the use of these tools in laboratory investigations and may provide for their eventual clinical application.
Acknowledgments
We gratefully acknowledge the assistance of Rong Xue, MS, with the experimental protocol.
- BOLD
blood oxygenation level-dependent
- SE
spin echo
- τ180
time between refocusing pulses
APPENDIX
Calculation of Perfusion Images
Arterial perfusion can be determined from two images by acquiring one image with preinversion at a fixed delay τ (Mτ) and a second image without preinversion (M0) as previously shown (23), as follows:
| (A1) |
where W is 1.0 for perfect inversion and 0.5 for 90° saturation. The value of λ is relatively constant across mammalian species and is approximately 0.78 mL/g (58). This value of λ was used for all calculations in this study.
Maximal sensitivity to perfusion is achieved when W is 1.0 and τ is optimized. The optimal time between refocusing pulses τopt is approximately the T1 of the tissue (23). During this period, inflowing arterial magnetization mixes with tissue magnetization, which enhances the apparent T1 recovery.
Equation (A1) allows direct perfusion calculations from the normalized signal intensity and can be used to construct a perfusion image in units of milliliters per minute per gram if adequate registration exists between the images with Mτ or without M0 selective preinversion.
BOLD Signal Intensity Dependence and Fast SE
The signal intensity S for a T2-weighted fast SE image is related a s follows:
| (A2) |
where TEeff is the effective echo time determined by the acquisition timing of the central lines of the space and T2(%HBO2,τ180) is the spin-spin relaxation time T2 of the tissue as a function of the oxygen status of capillary vessel beds, myocardial vascular volume, and τ180.
Thus, by constructing an oxygen calibration curve from the normalized signal intensity on images acquired at known oxygen levels, the oxygen tension in the myocardium can be determined (26). Changes in τ180 require the measurement of a new calibration curve because of its dependence on T2. With fast SE imaging, however, TEeff can be adjusted by changing the k-space ordering alone (47), unlike with SE imaging, and in this case a new calibration curve is not required. With a calibration curve, images of myocardial oxygen content [O2]tiss can be generated under a variety of conditions, such as ischemia, infarction, reperfusion, vasodilation, and inotropic stimulation.
Footnotes
J.R.F. is supported by a grant from the Whitaker Foundation. S.B.R. is supported by a Medical Scientist Training Program Fellowship.
References
- 1.American Heart Association. Heart and stroke facts. Dallas, Tex: American Heart Assoication; 1993. [Google Scholar]
- 2.Evanochko WT, Pohost GM. Frontiers in cardiovascular imaging. New York NY: Raven; 1993. Myocardial nuclear magnetic resonance spectroscopy. [Google Scholar]
- 3.Bottomley PA, Hardy CJ, Roemer PB, Mueller OM. Proton-decoupled, Overhauser enhanced, spatially localized carbon-13 spectroscopy in humans. Magn Reson Med. 1989;12:348–363. doi: 10.1002/mrm.1910120307. [DOI] [PubMed] [Google Scholar]
- 4.Weiss RG, Gloth ST, kalil-Filho R, Chacko VP, Stern MD, Gerstenblith G. Indexing tricarboxylic acid cycle flux in intact hearts by carbon-13 nuclear magnetic resonance. Circ Res. 1992;70:392–408. doi: 10.1161/01.res.70.2.392. [DOI] [PubMed] [Google Scholar]
- 5.Chatham JC, Forder JR, Glickson JD, Chance EM. Calculation of absolute metabolic flux and the elucidation of the pathways of glutamate labeling in perfused rat heart by 13C NMR spectroscopy and nonlinear least square analysis. J Biol Chem. 1995;270:7999–8008. doi: 10.1074/jbc.270.14.7999. [DOI] [PubMed] [Google Scholar]
- 6.Xu X, White LT, Daumen C, Damico IA, et al. Kinetic analysis of dynamic 13C NMR spectra: metabolic flux, regulation, and compartmentation in hearts. Biophys J. 1995;69:2090–2102. doi: 10.1016/S0006-3495(95)80080-9. [DOI] [PMC free article] [PubMed] [Google Scholar]
- 7.Marcus M, Schelbert HR, Skorton DS, Wolf GL. Cardiac imaging: a companion to Braunwald’s heart disease. Philadelphia, Pa: Saunders; 1991. pp. 634–1256. [Google Scholar]
- 8.Go RT, Maclntyre WJ, Chen EQ, Cook SA, Neumann DR, Saha GB. Current status of the clinical applications of cardiac positron emission tomography. Radiol Clin North AM. 1994;32:501–519. [PubMed] [Google Scholar]
- 9.Hartiala J, Knuuti J. Imaging of the heart by MRI and PET. Ann Med. 1995;27:35–45. doi: 10.3109/07853899509031934. [DOI] [PubMed] [Google Scholar]
- 10.Watson NE, Jr, Cowan RJ, Ball JD. Conventional radionuclide cardiac imaging. Radiol Clin North AM. 1994;32:477–500. [PubMed] [Google Scholar]
- 11.Gould KL. Frontiers in Cardiovascular imaging. New York, NY: Raven; 1993. Management of coronary artery disease with position emission tomography. [Google Scholar]
- 12.Wackers FJT. Frontiers in cardiovascular imaging. New York NY: Raven; 1993. Single photon emission computer tomography. [Google Scholar]
- 13.Robles HB, Lawson MA, Johnson LL. Role of imaging in assessment of ischemic heart disease. Curr Opin Cardiol. 1994;9:435–447. [PubMed] [Google Scholar]
- 14.Thompson BH, Stanford W. Evaluation of cardiac function with ultrafast computed tomography. Radiol Clin North Am. 1994;32:537–551. [PubMed] [Google Scholar]
- 15.McCollough CH, Morin RL. The technical design and performance of ultrafast computed tomography. Radiol Clin North Am. 1994;32:521–536. [PubMed] [Google Scholar]
- 16.Brundage BH. Frontiers in cardiovascular imaging. New York, NY: Raven; 1993. Myocardial imaging with ultrafast computed tomography; p. 80. [Google Scholar]
- 17.Williams DS, Grandis DJ, Zhang W, Koretsky AP. Magnetic resonance imaging of perfusion in the isolated rat heart using spin inversion of arterial water. Magn Reson Med. 1993;30:361–365. doi: 10.1002/mrm.1910300314. [DOI] [PubMed] [Google Scholar]
- 18.Edelman RR, Siewert B, Darby DG, et al. Qualitative mapping of cerebral blood flow and functional localization with echo-planar MR imaging and signal targeting with alternating radio frequency. Radiology. 1994;192:513–520. doi: 10.1148/radiology.192.2.8029425. [DOI] [PubMed] [Google Scholar]
- 19.Nishimura DG, Macovski A, Pauly JM, Conolly SM. MR angiography by selective inversion recovery. Magn Reson Med. 1987;4:193–202. doi: 10.1002/mrm.1910040214. [DOI] [PubMed] [Google Scholar]
- 20.Kwong KK, Chesler DA, Weisskopf BR, Rosen BR. Perfusion MR imaging. Society of Magnetic Resonance; Proceedings of the Second Meeting of the Society of Magnetic Resonance; Berkeley, Calif. 1994. p. 1005. abstr. [Google Scholar]
- 21.Kwong KK, Chesler DA, Weisskopf RM, et al. MR perfusion studies with T1-weighted echo planar imaging. Magn Reson Med. 1995;34:878–887. doi: 10.1002/mrm.1910340613. [DOI] [PubMed] [Google Scholar]
- 22.Kim SG. Qualification of relative cerebral blood flow change by flow-sensitive alternating inversion recovery. Magn Reson Med. 1995;34:293–301. doi: 10.1002/mrm.1910340303. [DOI] [PubMed] [Google Scholar]
- 23.Reeder SB, Atalay MK, McVeigh ER, Zerhouni EA, Forder JR. Quantitative cardiac perfusion: a non-invasive spin-labeling method that exploits coronary vessel geometry. Radiology. 1996;200:177–184. doi: 10.1148/radiology.200.1.8657907. [DOI] [PMC free article] [PubMed] [Google Scholar]
- 24.Atalay MK, Forder JR, Chacko VP, Kawamoto S, Zerhouni EA. Oxygenation in the rabbit myocardium: assessment with susceptibility-dependent MR imaging. Radiology. 1993;189:759–764. doi: 10.1148/radiology.189.3.8234701. [DOI] [PubMed] [Google Scholar]
- 25.Atalay MK, Reeder SB, Zerhouni EA, Forder JR. Blood oxygenation dependence of T1 and T2 in the isolated, perfused rabbit heart at 4.7T. Magn Reson Med. 1995;34:623–627. doi: 10.1002/mrm.1910340420. [DOI] [PubMed] [Google Scholar]
- 26.Atalay MK, Zerhouni EA, Forder JR. Relationship between regional oxygen content and MRI signal intensity in the perfused rabbit heart: assessment in the setting of regional ischemia. Circulation. 1994;90:I–468. abstr. [Google Scholar]
- 27.Wendland MF, Saeed M, Lauerma K, deCrespigny A, Moseley ME, Higgins CB. Endogenous susceptibility contrast in myocardium during apnea measured using gradient recalled echo planar imaging. Magn Reson Med. 1993;29:273–276. doi: 10.1002/mrm.1910290220. [DOI] [PubMed] [Google Scholar]
- 28.Niemi P, Poncelet BP, Kwong KK, et al. Myocardial intensity changes associated with flow stimulation in blood oxygenation sensitive magnetic resonance imaging. Magn Reson Med. 1996;36:78–82. doi: 10.1002/mrm.1910360114. [DOI] [PubMed] [Google Scholar]
- 29.Balaban RS, Taylor JF, Turner R. Effect of cardiac flow on gradient recalled echo images of the canine heart. NMR Biomed. 1994;7:89–95. doi: 10.1002/nbm.1940070114. [DOI] [PubMed] [Google Scholar]
- 30.Stillman AE, Wilke N, Jerosch-Herold M, et al. BOLD contrast of the heart during occulusion and reperfusion. Society of Magnetic Resonance; Proceedings of the First Meeting of the Society of Magnetic Resonance; Berkeley, Calif. 1994. p. S24. abstr. [Google Scholar]
- 31.Li D, Dhawale P, Rubin PJ, Haacke EM, Gropler RJ. Myocardial signal response to dipyridamole and dobutamine: demonstration of the BOLD effect using a double-echo gradient echo sequence. Magn Reson Med. 1996;36:16–20. doi: 10.1002/mrm.1910360105. [DOI] [PubMed] [Google Scholar]
- 32.Bassingthwaighte JB, Yipintsoi T, Harvey RB. Microvasculature of the dog left ventricular myocardium. Microvasc Res. 1974;7:229–249. doi: 10.1016/0026-2862(74)90008-9. [DOI] [PMC free article] [PubMed] [Google Scholar]
- 33.Grayson J, Davidson JW, Fitzgerald Finch A, Scott C. The functional morphology of the coronary microcirculation in the dog. Microvasc Res. 1974;8:20–43. doi: 10.1016/0026-2862(74)90061-2. [DOI] [PubMed] [Google Scholar]
- 34.Ogawa S, Tank DW, Menon R, et al. Instrinsic signal changes accompanying sensory stimulation: functional brain mapping with magnetic resonance imaging. Proc Natl Acad Sci USA. 1992;89:5951–5955. doi: 10.1073/pnas.89.13.5951. [DOI] [PMC free article] [PubMed] [Google Scholar]
- 35.Truner R, Le Bihan D, Moonen CT, Despres D, Frank J. Echo-planar time course MRI of cat brain oxygenation changes. Magn Reson Med. 1991;22:169–166. doi: 10.1002/mrm.1910220117. [DOI] [PubMed] [Google Scholar]
- 36.Kwong KK, Belliveau JW, Chesler DA, et al. Dynamic magnetic resonance imaging of human bring activity during primary sensory stimulation. Proc Natl Acad Sci USA. 1992;89:5675–5679. doi: 10.1073/pnas.89.12.5675. [DOI] [PMC free article] [PubMed] [Google Scholar]
- 37.Pauling L, Coryell C. The magnetic properties and structure of the hemochromogens and related substances. Proc Natl Acad Sci USA. 1936;22:159–163. doi: 10.1073/pnas.22.3.159. [DOI] [PMC free article] [PubMed] [Google Scholar]
- 38.Boxerman JL, Hamberg LM, Rosen BR, Weisskoff RM. MR contrast due to intravascular magnetic susceptibility perturbations. Magn Reson Med. 1995;34:555–566. doi: 10.1002/mrm.1910340412. [DOI] [PubMed] [Google Scholar]
- 39.Wright GA, Hu Bs, Macovski A. Estimating oxygen saturation of blood in vivo with MR imaging at 1.5 T. JMRI. 1991;1:275–283. doi: 10.1002/jmri.1880010303. [DOI] [PubMed] [Google Scholar]
- 40.Bandettini PA, Boxerman JL, Davis TL, Wong EC, Weisskoff RM, Rosen BR. Numerical simulations of the oxygenation dependence of the T2 ande T2* of whole blood using a deterministic diffusion model. International Society for Magnetic Resonance in Medicine; Proceedings of the Third Meeting of the International Society for Magnetic Resonance in Medicine; Berkeley, Calif. 1995. p. 456. abstr. [Google Scholar]
- 41.Glasel JA. Nuclear magnetic resonance studies on water and ice. In: Frank F, editor. His water: a comprehensive treatise. Vol 1, The physics and chemistry of water. New York NY: Plenum; 1972. p. 238. [Google Scholar]
- 42.Gamcsik MP, Forder JR, Millis KK, McGovern KA. A Versatile oxygenator and perfusion system for magnetic resonance studies. Biotechnol Bioeng. 1996;49:348–354. doi: 10.1002/bit.260490302. [DOI] [PubMed] [Google Scholar]
- 43.Yamamoto F, Braimbridge MV, Hearse DJ. Calcium and cardioplegia: the optimal calcium content for the St. Thomas’ Hospital cardioplegic solution. J Thorac Cardiovasc Surg. 1984;87:908–912. [PubMed] [Google Scholar]
- 44.Institute of Laboratory Animal Resources, Commission on Life Sciences, National Research Council. National Institutes of Health Publication. Washington, DC: U.S. National Academy of Sciences; 1996. Guide for the Care and Use of Laboratory Animals; pp. 93–23. [Google Scholar]
- 45.Henning J, Nauerth A, Friedburg H. RARE imaging: a fast imaging method for clinical MR. Mag Reson Med. 1986;3:823–833. doi: 10.1002/mrm.1910030602. [DOI] [PubMed] [Google Scholar]
- 46.Mulkern RV, Wong ST, Winalski C, Jolesz FA. Contrast manipulation and artifact assessment of 2D and 3D RARE sequences. Magn Reson Imaging. 1990;8:557–566. doi: 10.1016/0730-725x(90)90132-l. [DOI] [PubMed] [Google Scholar]
- 47.Plewes DB, Bishop H. Spin-echo MR imaging. In: Sprawls P, Bronskill MJ, editors. The physics of MRI: 1992 AAPM Summer School. Woodbury, NY: American Institute of Physics; 1993. pp. 170–171. [Google Scholar]
- 48.Hinks RS, Kohli J, Washburn S. Fast spin echo prescan for artifact reduction. International Society for Magnetic Resonance in Medicine; Proceedings of the Third Meeting of the International Society for Magnetic Resonance in Medicine; Berkeley, Calif. 1995. p. 634. abstr. [Google Scholar]
- 49.Reeder SB, McVeigh ER. Tag contrast in breathhold CINE cardiac MRI. Magn Reson Med. 1994;31:521–525. doi: 10.1002/mrm.1910310508. [DOI] [PMC free article] [PubMed] [Google Scholar]
- 50.Segel LD, Ensunsa JL, Boyle WA., III Prolonged support of working rabbit hearts using Fluosol-43 or erythrocyte media. Am J Physiol. 1987;252:H349–H359. doi: 10.1152/ajpheart.1987.252.2.H349. [DOI] [PubMed] [Google Scholar]
- 51.Sharan M, Popel AS. Algorithm for computing oxygen dissociation curve with pH, PCO2, and CO in sheep blood. J Biomed Eng. 1989;11:48–52. doi: 10.1016/0141-5425(89)90165-9. [DOI] [PubMed] [Google Scholar]
- 52.King RB, Bassingthwaighte JB, Hales JR, Rowell LB. Stability of heterogeneity of myocardial blood flow in normal awake baboons. Circ Res. 1985;57:285–295. doi: 10.1161/01.res.57.2.285. [DOI] [PMC free article] [PubMed] [Google Scholar]
- 53.Bassingthwaighte JB, King RB, Roger SA. Fractal nature of regional myocardial blood flow heterogeneity. Circ Res. 1989;65:578–590. doi: 10.1161/01.res.65.3.578. [DOI] [PMC free article] [PubMed] [Google Scholar]
- 54.Schlant RC, Sonnenblick EH, Katz AM. Normal physiology of the cardiovascular system. In: Alexander RW, Schlant RC, Fuster V, O’Rourke RA, Roberts R, Sonnenblick EH, editors. Hurst’s the heart, arteries, and veins. New York, NY: McGraw-Hill Health Professions; 1998. p. 1. [Google Scholar]
- 55.Klocke FJ, Frank MW. Principles of myocardial perfusion. In: Skorton DS, Schelbert HR, Wolf GL, Brundage BH, editors. Marcus cardiac imaging: a companion to Braunwald’s heart disease. 2. Vol. 1. Philadelphia, Pa: Saunders; 1996. pp. 8–19. [Google Scholar]
- 56.Hendry PJ, Nathan H, Rajagopalan K. Ann Thorac Surg. Vol. 61. 1996. Right Ventricular blood flow during left ventricular support in an experimental porcine model; pp. 1199–1204. [DOI] [PubMed] [Google Scholar]
- 57.Altman PL, Dittmer DS, editors. Respiration and circulation. Bethesda, Md: Federation of American Societies for Experimental Biology; 1971. p. 264. [Google Scholar]