

Abstract
In eukaryotic translation initiation, ternary complex (TC) interacts with eIF3/eIF1/eIF5 complex to form the multifactor complex (MFC), while eIF2·GDP associates with eIF2B for guanine nucleotide exchange. Gcn2p phosphorylates eIF2 to inhibit eIF2B. Here we evaluate the abundance of eIFs and their pre-initiation intermediate complexes in gcn2 deletion mutant grown under different conditions. We show that ribosomes are three times as abundant as eIF1, eIF2 and eIF5, while eIF3 is half as abundant as the latter three and hence, the limiting component in MFC formation. By quantitative immunoprecipitation, we estimate that ∼15% of the cellular eIF2 is found in TC during rapid growth in a complex rich medium. Most of the TC is found in MFC, and important, ∼40% of the total eIF2 is associated with eIF5 but lacks . When the gcn2Δ mutant grows less rapidly in a defined complete medium, TC abundance increases 3-fold without altering the abundance of each individual factor. Interestingly, the TC increase is suppressed by eIF5 overexpression and Gcn2p expression. Thus, eIF2B-catalyzed TC formation appears to be fine-tuned by eIF2 phosphorylation and the novel eIF2/eIF5 complex lacking .
Introduction
The translation initiation reaction in eukaryotes starts with the dissociation of 80S ribosome into small 40S and large 60S ribosomal subunits, mediated by eukaryotic initiation factors (eIF) 1A and 3. The sequential binding of the ternary complex (TC) and eIF4F/m7G-capped mRNA complex to the 40S subunit constitutes formation of the 43S and 48S preinitiation complexes, respectively. The multisubunit factor eIF3, eIF5 and eIF1 promote these assembly processes by binding directly or indirectly to the 40S subunit forming the 48S preinitiation complex (for reviews, see 1; 2). The 48S complex searches for the first AUG codon in the mRNA with the help of eIF1, eIF1A, the RNA helicase eIF4A and its cofactor eIF4B. Correct base pairing between the anticodon and the AUG codon triggers the hydrolysis of GTP bound to eIF2. This is stimulated by a GTPase activating protein eIF5 3 and the resulting phosphate release is coupled to eIF1 dissociation 4. These events lead to dissociation of eIF2·GDP and other pre-assembled eIFs, making it possible for the 40S initiation complex to join with the 60S subunit, through the action of a second guanine nucleotide binding (G) protein eIF5B. Polypeptide chain elongation starts from the methionine linked to the 80S initiation complex. Because only the GTP-form of eIF2 is capable of binding to form TC, GDP-bound eIF2 must be recycled to replenish eIF2·GTP by the guanine nucleotide exchange factor (GEF) eIF2B1; 2.
The reactions described above are mediated by a series of complex assembly processes. eIF2 TC interacts with eIF1, eIF3 and eIF5 to form the stoichiometric multifactor complex (MFC) 5. The C-terminal HEAT domain of eIF5, with the conserved acidic and aromatic amino acid (AA)-boxes 6; 7, serves as an important core of MFC by binding concurrently to eIF1 and the N-terminal domains (NTDs) of eIF2β and eIF3c (Reviewed in 2). The tif5-7A mutation altering the eIF5 AA-box 2 disrupts the interaction between eIF2 and eIF3 and confers temperature-sensitivity to yeast cell growth. This phenotype is suppressible by the co-overexpression of all three eIF2 subunits and 5; 8. These results demonstrate that the eIF5-CTD stabilizes a critical bridge between eIF2 and eIF3, the two major components of 43S pre-initiation complex.
The interaction between eIF2·GDP and its nucleotide exchange factor eIF2B is also complex;eIF2B is made of five subunits with stable binding sites for the α and β subunits of eIF2, located at eIF2Bα/β/δ regulator subcomplex 9 and the C-terminal end of the minimal catalytic eIF2Bε-CTD segment 10, respectively. In addition, the eIF2Bε-CTD segment interacts with eIF2γ 11. The complexity of subunit interactions is in part due to the requirement for translational control mediated by eIF2 phosphorylation. From yeast to humans, eIF2 phosphorylation converts eIF2 from a substrate into a competitive inhibitor of eIF2B, thereby decreasing TC abundance. This effect inhibits general translation and paradoxically induces translation of GCN4 (in yeast) and ATF4 (in mammals) mRNAs encoding transcription factors by a mechanism involving upstream ORFs (uORFs) present in the 5′ leader region of each mRNA 12. Third, mRNA circularization is mediated through eIF4E bound to the 5′ cap and the poly(A) binding protein (PABP) bound to the poly(A) tail. eIF4E, PABP, and eIF4A all bind to the eIF4G subunit of eIF4F and enhances recruitment of the 40S subunit 13.
Proteomic approaches using yeast S. cerevisiae as a model eukaryote have generated numerous sets of data concerning protein abundance and protein-protein interactions. In a founding study by Futcher et al., 2D gel electrophoresis was used to separate ∼1200 different yeast proteins, of which 148 were identified by mass spectrometry. This study determined that the amounts of a large ribosomal protein Rpp0, eIF3b, and eIF4A are 277 × 103, 12 × 103, and 233 × 103 copies per cell, respectively 14. In a more comprehensive study, Ghaemmaghami et al. fused 98% of the 6234 gene products in yeast with a C-terminal TAP sequence and measured the level of the fusions by anti-CBP antibodies 15. Their study indicated relative cellular abundances of 19 separate eIF polypeptides. In a further independent study, the McCarthy group measured the amount of eIF- 1, 1A, 2α, 2γ, 2Bα, 3g, 4A, 4B, 4E, and 4G1 in yeast whole cell extract (WCE) by immunoblotting with polyclonal antibodies raised against each protein and by using purified proteins as standards 16. The comparison of the data obtained from the latter two studies showed a wide variation in eIF abundance estimates. In addition, the available yeast proteome data is unlinked to ribosome levels, except via the data from Futcher et al.14. This is partly because in Ghaemmaghami's approach, the C-terminal tagging of most ribosomal proteins was lethal. Furthermore, abundance has not been determined in direct comparison with eIFs.
Another goal of proteomics is to study interactions between all the proteins in the proteome. Large-scale approaches have used systematic two-hybrid and protein array interaction assays 17 as well as mass-spectrometrical identification of proteins associated with affinity-purified TAP-tagged proteins 18; 19. A challenge in these approaches is to know how protein phosphorylation or ligand-binding regulates the formation and composition of different complexes 20; 21. The translation initiation pathway involves several well-defined protein complexes whose formation is controlled by phosphorylation, bound nucleotides or RNA components. Without precise abundance information for co-purifying partners present in multiple complexes, it is difficult to partition proportions of each factor into each of the complexes formed. Thus in this study, we have extended the proteomics data relevant to translation initiation and determined the abundances of eIF complexes with a quantitative immunoprecipitation method. For this work, we have focused on the TC made of eIF2, GTP and and the MFC containing eIF1, eIF3, eIF5, and TC. We found that only a portion of eIF2/eIF5 complexes is a part of MFC, while the majority of the rest are not bound to . We established a method to measure cellular TC abundance and observed that dynamic changes in its steady-state levels are associated with growth medium composition and Gcn2p expression. Our results extend the recently proposed role for the eIF2/eIF5 complex lacking in antagonizing the eIF2B activity 22, and suggest that alternative ways to control eIF2 TC abundance exist.
Results
The cellular level of eIFs in Saccharomyces cerevisiae
We compared the eIF levels determined previously by the whole-genome TAP-tagging approach of Ghaemmaghami et al. 15, as well as the levels determined by von der Haar et al. using immunoblotting of cell extracts with polypeptide-specific polyclonal antibodies and purified eIF samples as standards 16 (Table I, columns 3 and 4). These comparisons revealed both that large variations were apparent in the estimated abundances of the factors assessed and that neither dataset was comprehensive. We therefore decided to re-evaluate the cellular abundance of various factors and extend the analysis to include additional factors, initiator tRNA and ribosomal protein levels not included in the previous studies. For this purpose, we employed a series of yeast strains encoding FLAG- or HA-epitope tagged versions of eIFs- 1, 2β 2Bγ, 3c, 3i, 4G1, 4G2, 5 or the large ribosomal protein Rpl25p as the sole source of these factors. These strains are listed in Table II. After the early exponential growth (to A600=1.5-2.0) in the nutrient-rich medium YPD, WCEs prepared by a mild glass beads disruption were used for immunoblotting. This method of WCE preparation is routinely used to analyze protein-protein interactions (see below) and, with a minor modification, to produce a cell-free translation system 23.
Table I. Comparison of eIF levels determined in this study with those reported by Ghaemmaghami et al. 15 and Von der Haar et al. 16.
| eIF or its subunit | Gene | Ghaemmaghami copies/cella | Von der Haar copies/cellb | This study copies/cellc |
|---|---|---|---|---|
| eIF1 | SUI1/YNL244C | None | 250 000 | 81 000 |
| eIF1A | TIF11/YMR260C | 35 100 | 50 000 | |
| eIF2α | SUI2/YJR007W | 17 100 | 180 000 | |
| eIF2β | SUI3/YPL237W | None | 180 000 | 63 000 |
| eIF2γ | GCD11/YER025W | 20 800 ± 2840 | ||
| eIF2Bα | GCN3/YKR026C | 8 970 | 30 000 | |
| eIF2Bβ | GCD7/YLR291C | 6 650 ± 951 | ||
| eIF2Bγ | GCD1/YOR260W | 9 530 ± 1 760 | 5 000 | |
| eIF2Bδ | GCD2/YGR083C | 10 300 ± 1 000 | ||
| eIF2Bε | GCD6/YDR211W | 33 800 ± 6 700 | ||
| eIF3a | TIF32/YBR079c | 52 700 ± 4350 | ||
| eIF3b | PRT1/YOR361C | 47 500 ± 5600 | ||
| eIF3c | NIP1/YMR309C | 78 900 ± 6150 | 34 000 | |
| eIF3g | TIF35/YDR429C | GFP only | 100 000 | |
| eIF3i | TIF34/YMR146C | 2 400 ± 282 | 32 000 | |
| eIF3j | HCR1/YLR192C | 17 900 | ||
| Pci8p | PCI8/YIL071c | 50.4 | ||
| eIF4A1 | TIF1/YKR059W | 106 000 | 800 000 | |
| eIF4A2 | TIF2/YJL138C | # | ||
| eIF4B | TIF3/YPR163C | 24 000 | 155 000 | |
| eIF4E | TIF45/YOL139C | 14 200 | 340 000 | |
| eIF4G1 | TIF4631/YGR162W | 9 760 | 17 500 | 9 400 |
| eIF4G2 | TIF4632/YGL049C | 3 390 | 5 400 | |
| eIF5 | TIF5/YPR041W | 48 300 ± 13 300 | 67 000 | |
| L25 | RPL25/YOL127W | None | (200 000) | |
| IMT1-4 | 640 000 | |||
Ref. 15. The results based on a single experiment, unless SD is provided. None, no expression was observed.
a band detected, but not quantifiable. GFP only, detected expression in GFP microscopy, not in TAP western experiments.
Ref. 16.
Recalculated from the relative values in Fig. 1A and B, based on the ribosome abundance of 200 000 copies/cell 24, which is shown in parenthesis.
Table II. Yeast S. cerevisiae strains employed for eIF and complex level determination.
| Strain | Tagged eIF | Description | Source |
|---|---|---|---|
| KAY142 | FL-eIF1 | MATα leu2 lys11 ura3-52 trp1Δ mof2(sui1)::hisG YCpL-PGPDSUI1 [GPDSUI1-FL LEU2] | 51 |
| KAY25 | FL-eIF2β | MATα ura3-52 leu2-3,-112 ino1 sui3Δ gcn2Δ <HIS4::lacZ ura3-52> p[FL-SUI3 LEU2] | 8 |
| KAY35 | eIF5-FL | MATaura3-52 leu2-3,-112 trp1-Δ63 tif5Δ gcn2Δ YCpTIF5 [TIF5-FL LEU2] | 8 |
| HLV04-4T | FL-eIF3c | MATα ura3-52 trp1-63 leu2-3, 112 his4-303(AUU) nip1-Δ pLV04 [TRP1 FL-NIP1] | L. Valasek/A. Hinnebusch |
| KAY487 | eIF3i-FL | MATα gcn2Δ ura3-52 leu2-3,-112 tif34Δ-1 YCpTIF34-FL [LEU2 TIF34-FL] | This study |
| GP3685 | eIF2Bγ-2FL | MATaura3-52 leu2-3,-112 trp1-Δ63 gcd1::LEU2 <HIS4::lacZ ura3-52> pAV1419 [GCD1-2FL-His URA3] | 28 |
| YIT613 | Rpl25-FL | MATaade2-1 his3-11,15 leu2-3,112 trp1-1 ura3-1 pep4Δ::HIS3 prbΔ::his3 prc1Δ::hisG rpl25Δ::LEU2 p[RPL25-FH URA3] | 48 |
| KAY8 | eIF3i-3HA | MATα his1-29 gcn2-508 ura3-52 leu2-3,-112 tif34Δ-1 <HIS4::lacZ ura3-52> p[TIF34-3HA LEU2] | 47 |
| YAS1955 | HA-eIF4G2 | MATaade2-1 his3-11,15 leu2-3, ura3-1 trp1-1pep4::HIS3 tif4631::LEU2 tif4632::ura3 p[HA-TIF4632 TRP1] | 55 |
| YAS2136 | HA-eIF4G1 | MATaade2-1 his3-11,15 leu2-3, ura3-1 trp1-1pep4::HIS3 tif4631::LEU2 tif4632::ura3 p[HA-TIF4631 TRP1] | 55 |
| KAY128 | FL-eIF2β | MATa ura3-52 leu2-3,-112 trp1-Δ63 sui3Δ gcn2Δ tif5Δ p[FL- SUI3 TRP1] p[TIF5 LEU2] | 30 |
| KAY284 | FL-eIF2β | KAY128 carrying tif5-7A | 30 |
| KAY482 | FL-eIF2β | KAY128 with hc TIF5 LEU2, replacing sc TIF5 LEU2 | 22 |
As shown in Fig. 1A and B, fixed amounts of WCE from each strain were separated by SDS-PAGE and subjected to immunoblotting with anti-FLAG or anti-HA antibodies. The densities of FLAG-tagged eIF bands were quantified using NIH Image software, and presented as values relative to the level of eIF5-FL in row 1 of the tables below the immunoblotting patterns in Fig. 1A. Likewise, the densities of HA-tagged eIF bands were quantified and presented as values relative to the level of eIF3i-3HA (row 1 of the table in Fig. 1B). To normalize for any effects of epitope-tagging on the expression level of each eIF, we probed the same membrane as used for anti-FLAG or –HA with antibodies raised against the relevant unmodified protein (see Fig. S1 for a representative example) and found that the presence of the tag did not affect protein abundance (row 2 of the tables in Fig. 1A-B) for all proteins assessed except for FL-eIF1 that was expressed from a stronger GPD promoter to increase its detection (see below; all other tagged eIFs were expressed from the natural promoter except for HA-eIF4G1 in YAS2136. HA-eIF4G1 in this strain is expressed under the TIF4632 promoter, but we confirmed that its abundance is identical to that of untagged eIF4G1 in the other strains). Note that the strains expressing each tagged allele have different genetic backgrounds (Table II). This indicates that differences between strains in commonly used genetic markers and the presence or absence of GCN2 in particular, does not affect eIF protein abundance. Because amino acid composition of the measured protein may change its transfer efficiency to the blotting membrane (see Fig. 2), we then normalized the abundance values for the immuno-detection efficiency (row 3 of the table in Fig. 1A-B). After these normalizations, the cellular levels of eIFs and Rpl25p, relative to that of eIF5, were determined and these values are summarized in the bottom row of the tables in Fig. 1A and B.
Fig. 1. Determination of cellular eIF levels.
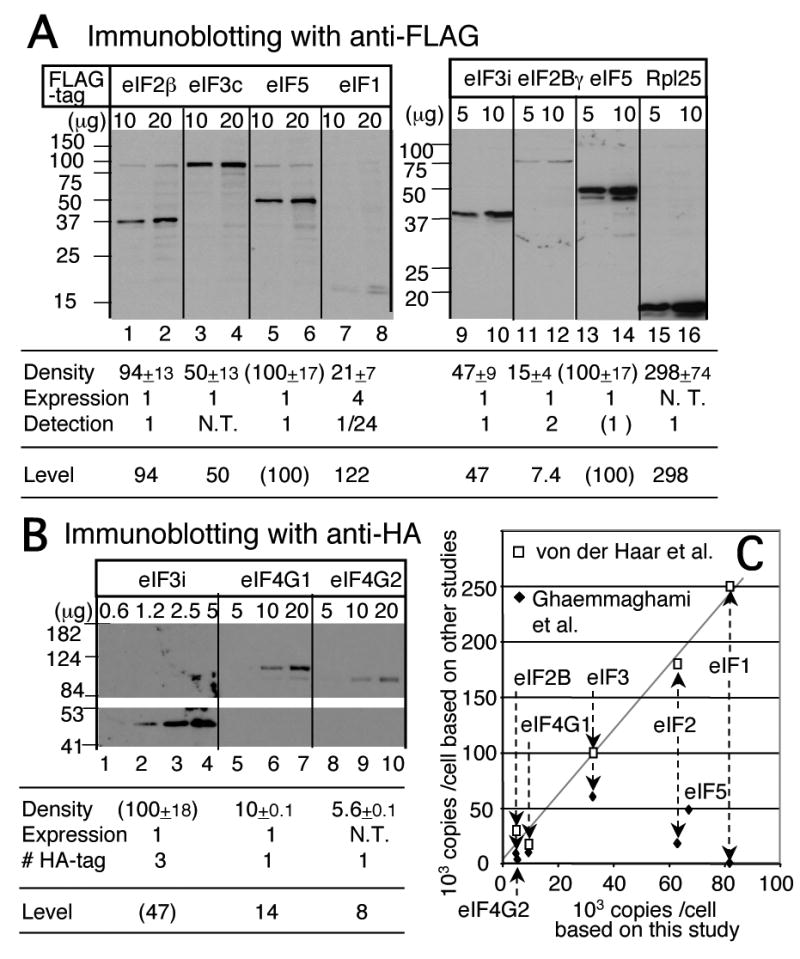
(A) Example of quantitative detection of indicated FLAG-tagged proteins in WCE from yeast strains by immunoblotting with anti-FLAG antibodies. Table summarizes densitometry analysis to determine the expression level relative to eIF5 (set to 100%). FLAG antibody signal density was controlled by the following two factors: (1) Relative expression level of the epitope-tagged protein, compared to the endogenous level of the cognate protein. This was determined by immunoblotting with antibodies raised against each protein (see Fig. S1). (2) Relative detection efficiency of the FLAG-tagged protein, compared to that of eIF5-FL, as determined by anti-FLAG antibodies. (See Fig. 2 below). N. T., not tested due to technical problems or lack of antibodies. (B) Determination of HA-tagged eIF levels. Analysis was done as in panel A but with indicated HA-tagged yeast strains and anti-HA antibodies. (C) Data from Ref. 16 and Ref. 15 plotted against data from this study as empty squares and filled diamonds, respectively. Dotted arrows indicate values for individual eIFs. Grey line indicates the linear regression with the data from 16. For the data from 15, the eIF3 and eIF2 levels were averaged from the values for the a/b/c- and α/γ– subunits, respectively. The eIF2B level was averaged from the values for α, β, γ and δ subunits.
Fig. 2. Transfer and detection efficiency of purified FLAG-eIFs.

Indicated amounts of purified proteins were subjected to SDS-PAGE, followed by Coomassie Blue staining (panel A, lanes 1-10) or immunoblotting with anti-FLAG antibodies (panel A, lanes 11-27; panel B). To increase the accuracy of measuring the intensity of anti-FLAG detection per pmol of FLAG-proteins, we ran two separate SDS-PAGE gels at the same time, one loaded with indicated amounts of purified proteins, and the other loaded with four times more of the same proteins. The former was subjected to immunoblotting as shown, and the latter was stained with Coomassie Blue to determine the protein concentrations of the samples in comparison with the amount of eIF5-FL on the same gel. The eIF5-FL sample concentration was determined by comparing to known amounts of BSA, as shown in Panel A, lanes 2-5. The results indicate that the detection efficiency for all expect eIF1 (as in C) and eIF2Bγ is identical. That for eIF2γ is 2.0, because of two copies of the FLAG epitope. (C) The density of anti-FLAG reactivity was plotted against molar amounts of FL-eIF1 or eIF5-FL in each lane.
The relative expression value indicated for eIF1 deviated most from the original density value (table in Fig. 1A). This is because: (i) FL-eIF1 expression was increased by 4-fold compared to the endogenous eIF1 due to using a stronger GPD promoter (row 2) and (ii) FL-eIF1 was detected 24 times less effectively than eIF5-FL (Fig. 1A, table row 3, and Fig. 2B-C). The second point was determined by anti-FLAG immunoblotting with known amounts of purified recombinant FL-eIF1 and eIF5-FL, as shown in Fig. 2B. In contrast, the efficiency of detection was indistinguishable between recombinant forms of FL-eIF2β, eIF3i-FL, Rpl25-FL, eIF5-FL and eIF2Bγ-2FL (the latter from eIF2B purified from yeast, Fig. 2A). Our data are in agreement with previous observations 15 that most yeast proteins visible by Coommassie Blue staining in SDS-PAGE are transferred to nylon or nitrocellulose membranes at nearly identical efficiency (data not shown). Thus, eIF1 is clearly an exception. We suspect that altered transfer or detection efficiencies for a minor subset of the proteome produce a limitation for systematically determining the levels of the proteins encoded in the genome.
Because we obtained abundance values relative to total eIF5 (Fig. 1A and B), we converted them into absolute copies per cell, by comparing our relative ribosome abundance of 298% of total eIF5 with the previously determined ribosome abundance of 200,000 copies per cell 24 (Fig. 1A). The calculated absolute abundance values are presented in Table I, column 5. To establish a limiting factor in TC formation, we also determined the cellular abundance of and directly compared it with the cellular level of eIF2. For this purpose, we used known amounts of purified eIF2 and as standards on Western and Northern blots and analyzed them side-by-side with the same from yeast WCE. We estimated that the level of is ten times higher (640,000 copies/cell) than that of eIF2 (63,000 copies/cell), indicating that eIF2 is the limiting component in forming ternary complexes in vivo.
Our data indicates that ribosomes are three times as abundant as the multi-factor complex (MFC) components eIF1, eIF2 and eIF5 (81,000, 63,000, and 67,000 copies/cell, respectively; Table I, column 5). eIF3 (32,000-34,000 copies/cell) is present at half the levels of other MFC components; thus, eIF3 is the limiting component in the formation of MFC. is in large excess over eIF2 (provided that a significant proportion of is aminoacylated; see below Fig. 3C), whereas eIF2B (5000 copies/cell) is the least abundant factor we measured. eIF2Bγ is present at only ∼7% of the level of eIF2. These observations agree with the idea that GTP binding to eIF2 is the limiting step in forming TC. When plotted against the values obtained by von der Haar et al. 16, our data of eIF abundance have almost a linear correlation with theirs, with the slope of the linear regression being 2.94 (Fig. 1C). We do not know why the values from von der Haar et al. are three times higher than those we obtained in this study (Table I, columns 4 and 5). We note, however, that the authors did not measure ribosome or ribosomal protein abundance by their methods, so their values are in theory unlinked to the ribosome level, a commonly used standard. In conclusion, our data largely confirmed the relative (but not the absolute) abundance values determined by von der Haar et al.16, and importantly, add new information about the level of eIF5 and , and the relationship between individual initiation factor abundance and ribosome abundance (see below Fig. 7).
Fig. 3. Determination of TC and eIF assembly intermediate levels in vivo and identification of a novel eIF2/eIF5 complex lacking .
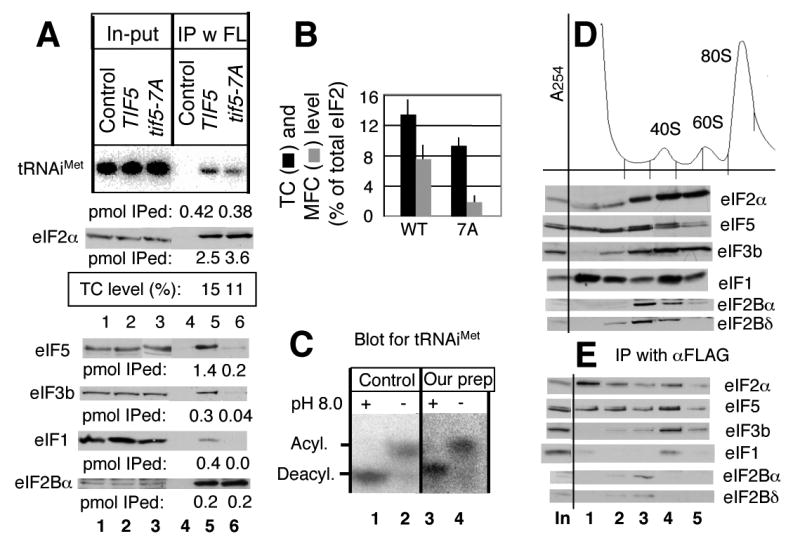
(A) 1 mg of WCE prepared from KAY17 (Control), KAY128 (TIF5), and KAY284 (tif5-7A) was used for anti-FLAG immunoprecipitation, and 80 % (top gel) and 20 % (bottom gels) of the precipitated fractions (lanes under IP) were analyzed by northern and western blotting, respectively, with 2% in-put amount (lanes under In-put) and purified and eIF2 as the standard (not shown), as described under Materials and Methods. The molar amounts (per 1 mg WCE) of precipitated components, calculated in comparison with the band densities of purified components, are listed below each panel. (B) TC and MFC levels. % of - or eIF3-bound eIF2 compared to total eIF2, observed in KAY128 (WT) and KAY284 (7A), is shown by bars with SD in lines. (C) Confirmation of intact during TC level determination. Our prep; the RNA samples were isolated from the in-put WCE sample under acidic conditions and analyzed by the acidic urea PAGE and the detection using a probe for , all as described under Materials and Methods. Control; intact aminoacyl tRNA sample was prepared directly from yeast and analyzed similarly. +; fully deacylated by incubating in 2 M Tris-HCl (pH 8.0) at 37°C, 30 min. -; no alkaline treatment. (D) and (E) Analyses of eIF complexes by sucrose gradient-velocity sedimentation. KAY25 (FL-SUI3) was grown in YPD at 30°C, treated with cycloheximide for 5 min, and then harvested for preparation of WCE, as described previously 54. 25 A260 units of the WCE were fractionated on 5-45% sucrose gradients by centrifugation at 39000 rpm for 2 h. (D) Top panel, A254 profile indicating the positions of ribosomal species. A half of the first 5 fractions was precipitated with ethanol and analyzed by SDS-PAGE and immunoblotting with antibodies indicated to the right. (E) The reminder of the fractions was incubated with anti-FLAG affinity resin (Sigma) for 30 min, followed by washing 4 times. eIFs in ethanol- or immuno-precipitated fractions were analyzed for immunoblotting together on the same gel, to know the relative amount of FL-eIF2 precipitated. In, 1% of the input amount.
Fig. 7. The abundance model of eIF2 assembly reactions in S. cerevisiae cells growing in the YPD medium.

The right column describes a sequence of eIF2 reactions from the previous round of initiation (Initiation) to the formation of 43S complex (MFC ≃ 43S) for the new round of initiation. The levels of eIF2 intermediate complexes determined in this study were translated into absolute levels, based on the ribosomal level of 200 000 copies/cell 24 and presented in italicized beside the relevant complexes. The following values were used for calculation: Total eIF2 level, 63,000 copies/cell. Total eIF2/eIF5 complex, TC and MFC level, 54%, 15%, and 7.5% of total eIF2, respectively (from Fig. 3A, Fig. 5A and other independent experiments). Total TC/eIF5 complex level, 22% of eIF2 bound to eIF5 (from Fig. 5D and other independent experiments). The left column depicts the dissociation of the ribosome. The level (italicized) and percentage (in parentheses) of the ribosome in each stage are presented. Although we reason that the eIF2/eIF5 complex lacking is bound to GDP, this needs to be demonstrated in the future.
Determination of eIF2 TC and MFC levels in vivo
Having established abundances of individual factors, we wished to determine what proportions were present in different complexes that form pre-initation factor complex intermediates. To determine TC level, we immunoprecipitated FL-eIF2 from a gcn2Δ strain KAY128 encoding FL-eIF2β as the sole source of eIF2β and determined the amount of eIF2 and coprecipitating by Western and Northern blotting, respectively. Known amounts of each purified component were included as standards (not shown in Fig. 3A). Analysis of supernatant fractions revealed that there is nearly a full recovery of FL-eIF2 in the pellet fractions, suggesting that FL-eIF2 complexes are stable during the course of these experiments (data not shown). Fig. 3A shows that 2.5 pmol FL-eIF2 coprecipitated with 0.42 pmol of , indicating that only 16% of eIF2 is tightly associated with . This is likely to be in the form of the ternary complex (TC). From this and several other independent experiments, we conclude that the cellular TC level represents 13.4% ± 2% of the total cellular eIF2 (Fig. 3B, column 1).
These data also indicate that the amounts of eIF3 (0.3 pmol), eIF1 (0.4 pmol) and (0.42 pmol) that coprecipitating with FL-eIF2 are roughly equivalent (Fig. 3A), suggesting that binding to FL-eIF2 occurs in the context of the multifactor complex under these growth conditions. Because interaction between eIF2 and eIF3 depends on an intact eIF5 C-terminal domain (CTD) 5; 25, the presence of eIF3 in complex with eIF2 is the hallmark of MFC (Fig. 3A, fourth panel). Fig. 3B shows that the level of MFC, determined by the ratio of precipitated eIF3 to eIF2, is 7.6 ± 2% of total eIF2. Together with the cellular TC levels calculated above, these results suggest that once TC is formed it is rapidly converted into MFC.
The methionyl moiety of directly binds eIF2γ and this interaction promotes TC formation 2. Thus, deacylation of during WCE preparation could potentially decrease its affinity for eIF2, and hence reduce the yield of in the FL-eIF2 complex. To assess if this was a problem with our assays, we analyzed the ratio of aminoacylated:deacylated in our WCE preparations by extracting total RNA under acidic conditions, and by using acidic urea PAGE to detect and quantify aminoacylated and deacylated forms of 26. As a control, we used aminoacyl-tRNA samples that were prepared under acidic conditions. Fig. 3C indicates that similar fractions (∼65%) of molecules were aminoacylated in both our WCE preparation (lane 4) and intact aminoacyl tRNA sample (lane 2) and that molecules in both the samples were deacylated completely after treatment with a basic buffer (pH 8.0) (lanes 1 and 3), as previously observed 26. Therefore deacylation was not occurring in our cell extracts and would not bias our measurement of TC abundance.
To exclude the possibility that TC free of MFC easily dissociates during the immunoprecipitation reaction, we determined TC levels in the tif5-7A mutant, which alters the eIF5 AA-box 2 and is known to disrupt MFC formation 8. As mentioned earlier, tif5-7A is a seven-alanine substitution that likely unfolds C-terminal HEAT-repeat α-helices of the CTD structure. Fig. 3A, lane 6, shows that this mutation only partially reduced co-precipitation from 15 % to 11% (boxed below second gel, Fig. 3A) compared to FL-eIF2 precipitated (see Fig. 3B for quantification). In contrast, the mutation substantially reduced the amount of eIF3b precipitated (Fig. 3A-B), confirming disruption of MFC. Thus, though apparently small, the TC level determined in Fig. 3 is likely an authentic value.
∼40% of eIF2 complexes with eIF5 but lacks in vivo
Fig. 3A also indicates that a significantly higher proportion of eIF2 is associated with eIF5 (1.4 pmol out of 2.5 pmol FL-eIF2 precipitated) than the proportion of eIF2 bound to (0.42 pmol). This and several other experiments indicated that 54 ± 9 % of eIF2 is associated with eIF5. Given that TC level is ∼15 % of total eIF2 and that MFC level is smaller than this value, the data implies that ∼40% of eIF2 is present in a binary complex with eIF5 devoid of . This was a surprising finding that promoted further experimentation. To confirm this with a different strain but with the same technique, we performed a quantitative immunoprecipitation using yeast strain KAY35 encoding eIF5-FL. We confirmed that ∼60% of eIF5-FL was associated with eIF2. Of eIF2 that co-precipitated with eIF5-FL, only 22 ± 5 % (n = 7) was bound to (see Fig. 5C, lane 5, below for a typical example). Thus, the unexpected finding of eIF5/eIF2 complex lacking was confirmed in the two independent assays and likely not an artifact caused by the position of the tag introduced.
Fig. 5. Comparison of the abundance of eIF2- and eIF5-containing complexes between cells grown in YPD and SC media.
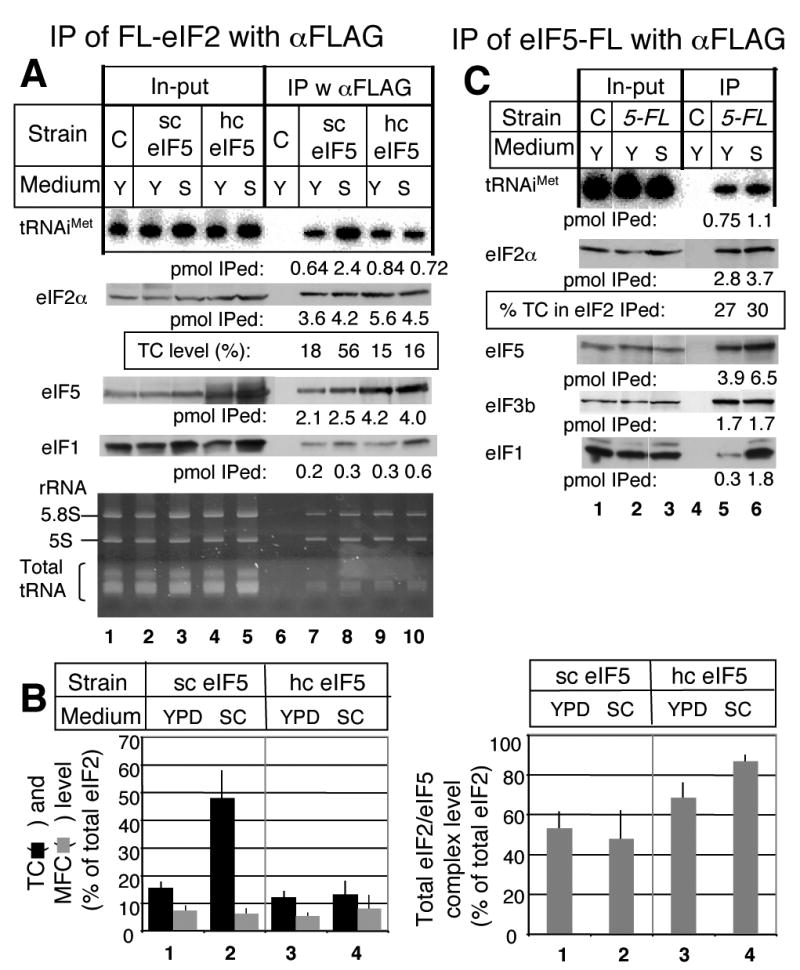
(A) Strain KAY128 (FL-SUI3 gcn2Δ; sc eIF5) and its isogenic hc eIF5 derivative KAY482 (hc eIF5), together with a control strain KAY113 carrying an unmodified SUI3 (C), were grown in YPD (Y) or SC (S) medium and subjected to quantitative immunoprecipitation, as in Fig. 3A. Immuno-precipitated fractions were analyzed by Nothern blotting for (top gel) and immunoblotting for eIF2α (second gel), eIF5 (third gel) and eIF1 (fourth gel) (lanes 6-10), together with 2% of in-put amount (lanes 1-5). Amount of precipitated proteins per 1 mg WCE is presented below each gel in pmol. Bottom gel indicates the position and amount of EtBr-stained 5.8S and 5S rRNA and total tRNA from the same acrylamide gel prior to transfer to a membrane and Northern hybridization. Note that some tRNA non-specifically coprecipitated with the 43S particle in lanes 7-10 and obscured specific precipitation when examined by EtBr staining alone. (B) The abundance of TC, MFC (left) and total eIF2/eIF5 complex (right) was quantified from (A) and at least three other independent experiments as ratio of co-precipitated , eIF1 and eIF5, respectively, to total eIF2. (C) Strain KAY35 (gcn2Δ TIF5-FL) and a control strain KAY113 (C) carrying an unmodified TIF5 were grown in YPD (Y) or SC (S) medium and subjected to quantitative immunoprecipitation and the results presented exactly as in Fig. 3A and 4A.
To verify the occurrence of a ribosome-free eIF2/eIF5 binary complex, we resolved the eIF complexes in cell extracts using sucrose gradient-velocity sedimentation. In these experiments, cycloheximide was employed to preserve intact ribosomal complexes. As shown in Fig. 3D, the strain encoding FL-eIF2β contains substantial amounts of eIF2 and eIF5 in the ribosome-free fractions 1-2. Anti-FLAG immunoprecipitation of gradient fractions indicates that the majority of FL-eIF2 precipitated in fractions 1-2 is associated with eIF5 (Fig. 3E, lanes 1-2). We recently reported a similar gradient analysis using a strain encoding eIF5-FL and showed that eIF5-FL present in the top, ribosome-free fractions also co-precipitated with eIF2 and, moreover, lacked 22. These reciprocal experiments establish the presence of the novel eIF2/eIF5 complex in the sucrose gradient. Together with further control experiments on our quantitative immunoprecipitation that were not reported previously 22, the results shown in Fig. 3 warrant the authenticity of the eIF complex abundance values presented in this study.
The level of eIF2/eIF2B complex in vivo
Next, we wished to determine the abundance of the eIF2/eIF2B complex. As shown in Fig. 3A, nearly all of eIF2B is associated with FL-eIF2. The amount of eIF2/eIF2B complex accounts for 7% of eIF2 (see Fig. 7 for summary). In the sucrose gradient analysis, the majority of eIF2B is present in fraction 3 preceding the 43S/48S complex fraction (Fig. 3D), indicating that the FL-eIF2/eIF2B complex is formed and migrates more slowly than the 40S ribosome. Furthermore, eIF2Bα and eIF2Bδ present in ribosome-free fraction 3 co-immunoprecipitated with anti-FLAG just as efficiently as FL-eIF2 (Fig. 3E), indicating that nearly all of eIF2B free from the 40S ribosome is associated with eIF2. These results are consistent with previous immunoprecipitation of eIF2B with anti-eIF2Bε antibodies, indicating that the nearly entire eIF2B co-immunoprecipitates with eIF2 and that the eIF2/eIF2B complex accounts for ∼10% of the total eIF2 27; 28. Thus, as an enzyme substoichiometric to its substrate, the majority of eIF2B appears to be fully engaged in the guanine nucleotide exchange reaction and, consequently, to bind eIF2·GDP or eIF2 alone, prior to GTP binding. Tight association between eIF2 and eIF2B has been noted since these factors were discovered in mammals and yeast 29.
The interaction between eIF5 and eIF2 is not affected by GDP or GMPPNP in vitro
The observation of the binary eIF2/eIF5 complex devoid of (Fig. 3) suggests that eIF5 can bind eIF2 in vivo even when the latter is bound to GDP. This idea is consistent with the finding that eIF5 or its CTD (aa. 241-405) can bind the isolated eIF2β subunit in the absence of eIF2γ that binds GTP or GDP 8; 30. To test the effect of guanine nucleotides on the interaction between eIF5 and eIF2 directly, we allowed GST-eIF5 to bind purified eIF2 in the presence and absence of 1 mM GDP or GMPPNP, the nonhydrolyzable GTP analogue. [GMPPNP is used because commercially available GTP is contaminated with GDP, while GMPPNP is not. The major GMPPNP contaminant is GTP (∼2%) (Roche).] As shown in Fig. 4, GST-eIF5 or GST-eIF5 (241-405) bound to eIF2 with an affinity of KD ∼100 nM in the absence or presence of the guanine nucleotide used. Thus, the eIF5/eIF2 interaction is not inhibited by GDP nor is it stimulated by GMPPNP. During the course of this study, Algire et al. showed, without presenting data, that the affinity of eIF2 for eIF5 in vitro is not altered by nucleotide or binding 4. Our results using GST-eIF5-CTD and purified eIF2 also demonstrate that the high affinity of eIF2 for eIF5 is due to interaction mediated by eIF5-CTD but not due to its NTD directly involved in the GAP activity. Together, these results confirm the finding reported by Algire et al. 4 and suggest that an eIF2·GDP/eIF5 complex can form, at least in vitro.
Fig. 4. The effect of guanine nucleotides on GST-eIF5 binding to purified eIF2.
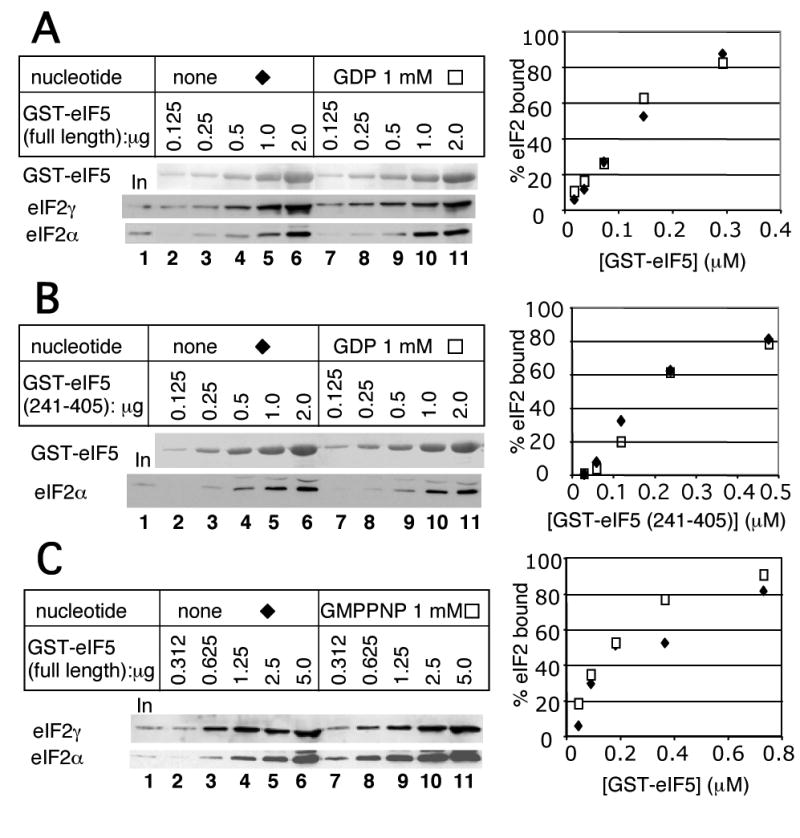
Indicated amounts of GST-fusion forms of full-length eIF5 (A, C) or its CTD (aa. 241-405) (B) were allowed to bind 20 ng of purified eIF2 in the presence of 1 mM guanine nucleotides, indicated across the top, and the complex formed was analyzed by GST pull down, as described previously 51. Bound eIF2 was visualized by immunoblotting (bottom panels), whereas GST-eIF5 proteins pulled down was visualized by Ponceu S staining (top panel). Graph to the right shows % of eIF2 bound to GST-fusion proteins (in panel A and C, average values for eIF2α and eIF2γ bound) plotted against the concentration of the latter.
The effect of nutrient change on the abundance of eIFs, ribosomes, and eIF complexes
The amounts of eIFs and their complexes, as determined in Figs. 1 and 3, were measured with the yeast gcn2Δ strain KAY128 (Table II) growing exponentially in a complex (undefined) rich medium YPD (see Materials and Methods) at the doubling time of 1.5 hr. In the synthetic defined medium supplemented with amino acids (SC), the same cells grew at the doubling time of 2.1 hr. Immunoblot analyses of WCE prepared from cells grown in YPD and SC media indicated no significant change in the levels of eIF1, all three eIF2 subunits, all five eIF2B subunits, a, b, g and i subunits of eIF3, eIF5, and eIF4G1 (data not shown). Sucrose gradient analyses of ribosomes present in the WCE preparation (not shown) and electrophoretic analysis of rRNAs isolated from the same preparation (Fig. 5A, bottom gel, lanes 2-3, for 5S and 5.8S rRNAs) indicated no discernable change in total ribosome abundance. Interestingly, quantitative immunoprecipitations revealed that the fraction of FL-eIF2 associated with is significantly higher in the SC medium than in the YPD medium (Fig. 5A, first and second gels). Averaged data from several independent experiments indicated that the TC abundance was 3 times higher in cells grown in SC medium than in the same cells grown in YPD medium (Fig. 5B).
We found that the MFC abundance was, on average, unaltered between cells grown in the YPD versus the SC medium, when measured by the amount of FL-eIF2 associated with eIF1, one of the critical MFC components (Fig. 5A, fourth gel, and B). Moreover, the total abundance of the eIF2/eIF5 complex was not altered (Fig. 5A, third gel, and B). Because the TC level increased in the SC medium, it was conceivable that the abundance of a complex between eIF5 and TC, but lacking other MFC partners was also increased. However, the amount of associated with eIF5-FL in a TIF5-FL strain only marginally increased (by 10±2 %) in the defined SC medium compared to the complex levels observed in YPD medium (Fig. 5C).
Analysis of eIF1 and eIF3b co-precipitated with eIF5-FL indicated that the amount of eIF1 bound to eIF5-FL dramatically increased while the level of eIF5-FL-bound eIF3b did not change (Fig. 5C, third and fourth gels). Notably, one third of eIF5-FL is bound to eIF3 in both the conditions (Fig. 5C, fourth gel). Given that the abundance of eIF3 is about half of that of eIF5 (Fig. 1 and Table I), the majority (two thirds) of eIF3 is associated with eIF5 regardless of the growth conditions. In this context, the significant increase in eIF1 associated with eIF5-FL observed in the SC medium indicates that nearly all of the eIF3/eIF5 complexes bind eIF1 when the cells are grown in the SC medium. In conclusion, growth in SC medium significantly increases the abundance of both TC and eIF1/eIF3/eIF5 complexes, demonstrating that dynamic changes in eIF intermediate complexes can result from changes in nutrient availability and/or growth rate. It is noteworthy that these changes were observed in a gcn2Δ background. Thus, they are independent of eIF2 phosphorylation and therefore are likely dependent on other nutrient-sensing pathways (see Discussion).
The effect of Gcn2p expression on the cellular TC level
Gcn2p is known to partially phosphorylate eIF2 when cells are grown in synthetic defined media 31; 32. Because eIF2 phosphorylation inhibits eIF2B and thereby reduces TC level, Gcn2p expression in SC medium is expected to lower TC abundance. As shown in Fig. 6A, we indeed found that Gcn2p expressed from the p722 plasmid lowered TC level in the strain KAY128 grown in SC medium (compare lanes 5 and 6). The TC abundance in the presence of Gcn2p was reduced on average from 50% to 25% compared to total eIF2 in this medium (Fig. 6B). As a control, eIF2 abundance was not altered by p722 (data not shown). These results confirm that the Gcn2p kinase plays a role in downregulating TC abundance in the SC medium.
Fig. 6. Gcn2p expression down-regulates TC formation in the SC medium.
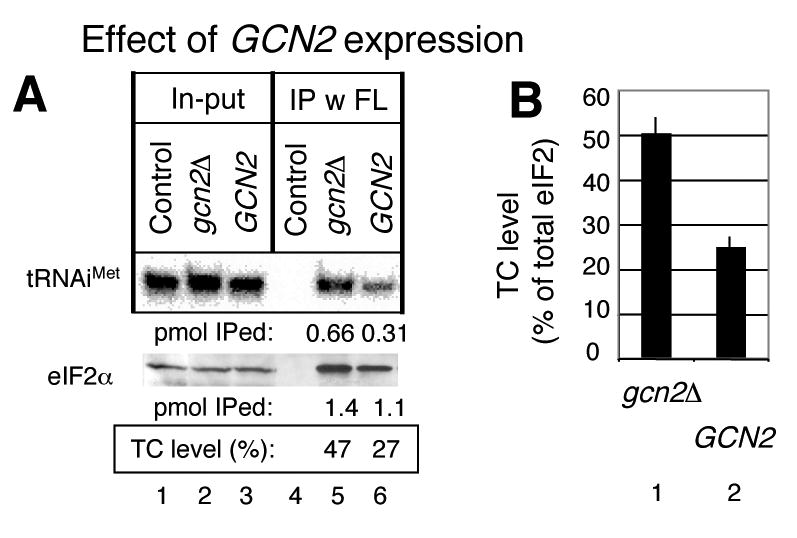
(A) Quantitative immunoprecipitation was performed using KAY128 (gcn2Δ FL-SUI3) transformants carrying an empty vector (gcn2Δ) and p722 (GCN2) and a control KAY113 (gcn2Δ SUI3) transformant carrying an empty vector, exactly as in Fig. 3A. The cells were grown in SC-ura medium. (B) TC levels measured from panel (A) and three other independent experiments with SD in lines.
The eIF2/eIF5 complex downregulates TC formation
Next, we wished to understand the mechanism by which the growth in the SC medium derepresses TC abundance in the gcn2Δ strain. One mechanism, suggested by the increase in the level of eIF1/eIF3/eIF5 complex (Fig. 5C), postulates that the growth in the SC medium decreases the rate of translation initiation by the ribosome preinitiation complex without inhibiting eIF2B activity and TC formation. Reducing the rate of a later step in the initiation pathway could achieve this and would result in increase in the level of TC and the eIF1/eIF3/eIF5 complex, both awaiting consumption by actively initiating ribosomes. An alternative but mutually consistent model came from our discovery of the eIF2/eIF5 complex free of and genetic evidence suggesting that this complex antagonizes TC formation catalyzed by eIF2B 22. Although we did not observe the change in the abundance of the eIF2/eIF5 complex between the two media tested, the possible modification of the complex by other signaling pathways was not excluded. To test whether the alteration in the stability of the eIF2/eIF5 complex is responsible for the high TC abundance in SC medium in the absence of Gcn2p, we measured TC levels in the isogenic gcn2Δ strain KAY482 overexpressing eIF5 from a high-copy (hc) plasmid. hc eIF5 would likely increase the eIF2/eIF5 complex stability by mass action. As expected, hc eIF5 substantially lowered the TC level in the SC medium with concomitant increase in the amount of eIF2/eIF5 complex (Fig. 5A and B). These results support (though do not prove) the model that the novel eIF2/eIF5 complex controls the eIF2B activity to maintain the TC abundance at a low level. However, because we have not observed any change or modification made to the eIF2/eIF5 complex, we cannot exclude the possibility that the suppression observed with hc eIF5 is a bypass of the normal pathway not involving the regulation of the eIF2/eIF5 complex (see Discussion).
The deduced levels of ribosomal preinitiation complexes
While our methods of cell lysis and immunoprecipitation did not permit us to examine the ribosomal preinitiation complex levels directly, our data are largely consistent with the known proportions of dissociated ribosomal subunits and the level of 43S complex components. The abundance model summarized in Fig. 7 for yeast grown in the YPD medium includes the levels of different ribosomal species (italicized) and their percentage compared to total ribosome (in parenthesis). We estimate that 7.5% of total eIF2 is present as MFC (Fig. 3B). If all MFCs bind the dissociated 40S subunit to produce the 43S complex, ∼2.4% (4700 copies/cell; based on the ribosomal level of 200,000 copies/cell) of 40S subunits will be found as 43S complexes. In our polysome profile experiments (such as shown in Fig. 3D, top panel), we consistently observed that ∼10% of ribosomal subunits are dissociated during yeast grown in the YPD medium (data not shown). Thus, up to a quarter of dissociated 40S subunits participate in the 43S complex. It is conceivable that the 40S subunits free from MFC contain eIF3 alone or its complex with eIF1 and/or eIF5, depending on their affinity for the ribosome. Indeed, eIF3 abundance is ∼16% of total ribosome (Table I), consistent with the idea that eIF3 associates with MFC components off the ribosome in addition to participating in 43S complex formation. Although we did not measure eIF1A abundance, von der Haar et al. estimated it at 28% of total eIF2 (Table I, column 4) 16, or ∼9% of total ribosome by our standards (i. e., eIF2 abundance as one third of ribosome abundance), consistent with the idea that the majority of eIF1A is bound to dissociated 40S subunits to set the stage for 43S complex formation and subsequently regulate 48S complex function 33.
Discussion
Cellular abundance of translation initiation components and their complexes in S. cerevisiae
In our evaluation of cellular eIF, and ribosome levels, we not only confirmed and refined the cellular abundance of individual eIFs, but also determined the ribosome and levels in direct comparison with them. The determined relationship between the ribosome and eIF levels allowed us to deduce the steady-state abundance of ribosomal preinitiation complexes (Fig. 7).
During the course of this study, Newman et al. measured the fluorescence of 4159 GFP-tagged yeast strains 34. Protein fusion to a large tag like GFP generally changes the protein stability. In addition, protein complex formation might quench fluorescence from the GFP-tag. Indeed, their GFP-eIF abundance values are in general >10 times lower than our values. The ribosomal protein levels were also measured for those encoded by two alleles in the genome. The average for 44 measured small ribosomal proteins (Rps) was 3619 ± 2414 copies/cell, and that for 63 measured large ribosomal proteins (Rpl) 4329 ± 3406 copies/cell. Of these, Rpl8A and Rpl9B showed the highest abundance of 17952 and 20074 copies/cell, which are still 10 times lower than the previously established ribosome level 24. Therefore it seems difficult to determine the absolute abundance of proteins based solely on a GFP-tagging approach.
Our measurement of eIF2-containing complex abundance provides insight into the mechanism and control of translation initiation (Figs. 3, 5 and 6). Our finding that TC and MFC represent only ∼15% and ∼8% of total eIF2, respectively, in yeast actively growing in YPD medium (Fig. 3) supports the idea that TC formation is a rate-limiting step in translation initiation and that once formed, TC is rapidly converted into the MFC. However, this was not the case when yeast were grown less rapidly in SC medium (Fig. 5). The TC abundance increased 3-fold, while MFC levels were unaltered, consistent with the reduced growth rate. Thus, TC abundance appears to be carefully controlled in accordance with nutrient composition and/or growth rate. Here we investigated two possible mechanisms to explain these observations (Figs. 5 and 6); firstly a role for Gcn2p activation and secondly via a novel eIF5/eIF2 complex lacking , as discussed next.
Fine-tuning of TC abundance by Gcn2p and the novel eIF2/eIF5 complex
Our finding that TC abundance in a gcn2Δ strain was increased by three fold in the synthetic defined complete (SC) medium (Fig. 5A) suggests that eukaryotes possess a mechanism(s) to finely tune the levels of this critical translation component. As the observed increase in TC was suppressed by GCN2 expression in the strain (Fig. 6A-B), the modest eIF2 phosphorylation that had been observed under similar growth conditions 31; 32 appears to contribute to maintaining a lower level of TC. Gcn2p is activated by binding of uncharged tRNA that accumulates during amino acid starvation 35. How Gcn2p is activated in the presence of abundant amino acids in the medium is unclear. It is possible that a limited supply of certain critical components regulates a second nutritional signaling pathway. One such nutrient sensing pathway known to regulate translation is the TOR kinase pathway 36. Consistent with this, the inhibition of TOR kinases is shown to activate Gcn2p in S. cerevisiae37. A second nutrient sensing pathway that regulates translation is the PAS kinase pathway 38.
A second mechanism to modulate TC abundance was suggested from our observation that hc eIF5 reverses the TC increase observed in the absence of Gcn2p (Fig. 5A-B). Although hc eIF5 can perturb MFC formation by producing partially formed MFC, as proposed previously 8, this mechanism does not explain the observed decrease in TC (Fig. 5A-B). Rather, we suggest that hc eIF5 stabilized the eIF2/eIF5 complex by mass action, which in turn inhibited eIF2B-catalized eIF2·GDP recycling and hence TC formation. In our recent study, we provided ample genetic and biochemical evidence for this idea using (i) a eIF5-CTD mutation that specifically disrupts eIF2 binding and restores TC decrease caused by hc eIF5 and (ii) eIF2Bε mutations whose phenotype resulting from reduced TC formation was exacerbated by hc eIF5 22. The latter results suggest that wild-type eIF2Bε (the catalytic subunit of eIF2B) is required for eIF2B to out-compete the inhibition by eIF5 bound to its substrate eIF2·GDP, perhaps by displacing eIF5 from the eIF2/eIF5 complex. Thus, a second mechanism to maintain the TC abundance homeostasis might indeed operate via the novel eIF2/eIF5 complex.
In an effort to understand the direct effect of nutrient shift on the eIF2/eIF5 complex, we carefully measured the abundance of total eIF2/eIF5 complex and the proportion of TC/eIF5 complex therein. However, we did not observe a dramatic change in the abundance of the eIF2/eIF5 complex free of that would simply explain the marked difference in TC level (Fig. 5). Instead, we found that most of the eIF5/eIF3 complex was bound to eIF1 in the SC medium (Fig. 5C). Moreover, our studies suggest that the TC level increased during growth in SC medium while free eIF2 (likely GDP-bound) decreased when compared with YPD-grown cells (Fig. 5). Thus, the activity of eIF2B in producing eIF2·GTP and hence TC appears to be higher (or less limiting) in SC medium. The accumulation of an eIF1/eIF3/eIF5 complex in SC medium (Fig. 5C) suggests that translation initiation is instead suppressed at the level of preinitiation complex function. This could include MFC interactions, mRNA binding and/or scanning.
A mechanism to explain such regulation postulates that covalent modification controls eIF2B directly or indirectly by regulating the inhibitory eIF2/eIF5 complex. A candidate for the effector kinase of this regulation would be casein kinase 2 (CK2) that phosphorylates eIF2 in yeast 39, eIF2B in mammals 40, and eIF5 in both yeast and mammals 41; 42. If eIF2/eIF5 interaction is enhanced by phosphorylation to promote MFC formation in the YPD medium, the same modification could increase the stability of the inhibitory eIF2/eIF5 complex, thereby suppressing the TC abundance. While it is still unclear whether CK2 activity is regulated 43, yeast CK2 activity is regulated in a cell cycle-dependent manner, and activated at G1 and G2/M phases 44. In humans, CK2-depependent PML protein degradation is regulated by a MAP kinase 45. Alternatively, control by one or more phosphatases might be critical for the postulated TC abundance regulation. It would be interesting to find out if this regulation via eIF2B or eIF2/eIF5 complex is downstream of the TOR kinases 36, or relates to the recently identified Gcn2p-indendent pathway that regulates eIF2B and TC formation 46. Further work is needed to delineate the Gcn2p-independent pathway(s) that regulate cellular TC abundance and to determine whether the eIF2/eIF5 complex is a component in this regulation.
Materials and methods
Plasmid construction
Plasmids used in this study are listed in Table III. To produce the TIF34-FL* allele encoding C-terminally FLAG-tagged eIF3i, the DNA segment encoding the epitope-tagged TIF34 ORF was amplified by PCR using oligo 7 (to hybridize to 5′-end of TIF34 ORF) 47 and oligo TIF34-FL 5′-CCC AAG GAT CCT TAC TTG TCATCG TCA TCC TTG TAA TCA TTA GCT TCT TGC ATG TGC TCT TTA GC-3′ (BamHI site and FLAG-coding region underlined), followed by digestion with EcoRI and BamHI. The resulting 0.3-kb fragment (3′ fourth of TIF34-FL ORF) was cloned into the same sites of YCpL-TIF34-Bm 47 to produce YCpTIF34-FL. The 0.5-kb EcoRI-HindIII fragment (3′ fourth of TIF34-FL ORF and its 3′ UTR) of YCpTIF34-FL was cloned into the same sites of pT7-TIF34 47 to create pT7-TIF34-FL. To prepare pET-FL-SUI3, the 1.4-kb NdeI-HindIII fragment of YCpSUI3 (FL-SUI3) 8 was cloned into pET23a (Novagen).
Table III. Plasmids employed in this study.
| Plasmid | Description | Reference |
|---|---|---|
| YCpTIF34-FL | Single copy (sc) CEN LEU2 TIF34-FL plasmid | This study |
| pET-FL-SUI1 | FL-eIF1 cloned under T7 promoter | 51 |
| pT7-TIF5-FL | eIF5-FL cloned under T7 promoter | 5 |
| pT7-TIF34-FL | eIF3i-FL cloned under T7 promoter | This study |
| pET-FL-SUI3 | FL-eIF2β cloned under T7 promoter | This study |
| pET-RPL25-FH | Rpl25-FL-His cloned under T7 promoter | This study |
| pGEX-TIF5 | GST-eIF5 fusion plasmid | 8 |
| pGEX-TIF5-B6 | GST-eIF5(241-405) fusion plasmid | 8 |
| p722 | sc CEN URA3 GCN2 plasmid | 56 |
The RPL25-FH (or RPL25-FL-His) allele encodes C-terminally FLAG- and polyhistidine-tagged form of Rpl25p 48. To create pET-RPL25-FH, the DNA fragment carrying RPL25-FH was PCR amplified using oligos RPL25 FW 5′-GGG GCC ATA TGG CTC CAT CTG CTA AGG CTA CTG CC-3′ and RPL25-RV 5′-GCC CAA GCT TGG ATC CTT AAT GAT GAT GAT GAT GAT GGC C-3′ (NdeI and HindIII sites underlined) and pRPL25-FH 48 as template. Its 510-kb NdeI-HindIII fragment was cloned into pET23a (Novagen).
Yeast strains
Yeast strains encoding epitope-tagged eIFs as the sole source are listed in Table II. KAY487 was constructed by plasmid shuffling using transformants of KAY6 (tif34Δ p[URA3 TIF34]) (K. Asano) carrying YCpTIF34-FL, and 5-fluoroorotic acid as a drug to select against Ura+ strains 49. The strains used for eIF level determinations grew like the wild type strains at all the temperatures tested (18°, 22°, 30°, and 37° C), indicating that the tagged alleles are at least functional in supporting exponential growth in YPD medium.
Yeast growth media
YPD medium contained 1% (w/v) yeast extract (Difco), 2% (w/v) bacto peptone (Difco), and 2% (w/v) glucose 50. SC medium is a synthetic defined medium [0.145% (w/v) yeast nitrogen base w/o amino acid and ammonium sulfate (Difco), 0.5% (w/v) ammonium sulfate and 2% (w/v) glucose] supplemented with 0.009% (w/v) of each 20 amino acids, inositol and uracyl, 0.002% (w/v) adenine, and 0.0009% para-aminobenzoic acid 50. The SC-ura medium is the same as SC but lacks uracil.
Protein purification
The recombinant forms of FLAG-tagged eIFs or Rpl25p were purified from BL21(DE3) transformants carrying the corresponding pET or pT7 derivative plasmids (Table III) using anti-FLAG affinity resin (Sigma), as described previously 23. Purification of FL-eIF1 was described previously and the presence of its N-terminal FLAG peptide sequence was confirmed by peptide sequencing, prior to the experiment shown in Fig. 2B and C51. Yeast eIF2B was purified from strain GP3685 as described previously 28.
eIF level determination by epitope-tagging and immunoblotting
Yeast strains were first grown in 5 ml of the desired medium overnight at 30 °C. The cells were diluted until A600 = 0.4 into 50 ml of the same medium, grown for 3-4 hours at 30 °C and then collected at A600 = 1.5-2.0. Approximately 300-400 μg wet weight of cells were collected, washed, and resuspended in 250 μl buffer A containing 20 mM Tris-HCl (pH 7.5), 100 mM KCl, 5 mM MgCl2, 0.1 mM EDTA, 7 mM β-mercaptoethanol, 5 mM NaF, 1 mM PMSF, Complete™ protease inhibitors (Roche), and 1 μg/mL each of pepstain A, leupeptin, and aprotinin. Resuspended cells were lysed by vortexing with 0.4 g of 0.5 mm glass beads (3 cycles of 30-second vortexing and 30-second cooling on ice) and cleared by microcentrifugation for 15 mins at 14000 rpm at 4° C. The recovered supernatants were employed as WCE. The protein concentration of WCE was measured by Bradford assay (BioRad Protein Assay kit I). 1.25 to 80 μg of total proteins for each sample were incubated at 65 °C for 2 mins with Laemmli buffer [125mM Tris-HCL (pH 6.8), 4% SDS, 25% glycerol, 0.01% Bromophenol blue] and resolved by 10-20% Tris-Glycine gradient or 7.5% or 12 % uniform gels. The proteins were transferred in Tris-glycine transfer buffer for 4-5 hours onto Hybond ECL nitrocellulose membranes, the immobilized samples were incubated for 1 hour in PBS + T (PBS + 1% Tween-20) containing 5% non-fat dry milk. The blots were washed once for 15 minutes and twice for 5 minutes in PBS+T, and then incubated for 1 hour in PBS+T with mouse monoclonal anti-HA (diluted 1:2000) or anti-FLAG (diluted 1:500) or with rabbit polyclonal anti-eIF antibodies. After that, the blots were directly incubated with horseradish peroxidase-coupled secondary antibody to mouse or rabbit for 1 hour. Finally the blots were washed again, and the bands were visualized using the ECL chemiluminescent system (Amersham Pharmacia), followed by quantification using the NIHImage software.
In the case of Rpl25p and eIF4G2, the antibodies raised against these proteins were not available. However, the expression of Rpl25-FL is most likely equivalent to the endogenous Rpl25p, because (i) the protein was expressed from the natural promoter, (ii) Rpl25-FL precipitated >90% of yeast ribosomes by anti-FLAG affinity resin without altering its ribosomal protein composition 48 and (iii) no Rpl25-FL was found free of the ribosome, based on analyses of the supernatant fractions of the immunoprecipitation reaction or sucrose gradient polysome fractions of whole cell extracts (WCE) derived from YIT613 (T. Inada, personal communications).
Determination of TC and other eIF complex levels in vivo
WCE was prepared from FL-eIF2βor eIF5-FL strains, as described above. The scale of culture for WCE preparation was usually 100 ml. 1 mg total protein of WCE was employed for immunoprecipitation with anti-FLAG antibodies in 200 μl of the buffer A containing RNasin (Promega), as described previously 5, except that the precipitated proteins on the anti-FLAG affinity resin were washed in the presence of 50 μM GMPPNP, the nonhydrolyzable GTP analogue. 80 % of the precipitated fraction was used to quantify the amount of in the fraction by a standard protocol 52 with slight modifications: The RNA sample was extracted with citric acid-saturated phenol/chloroform/isoamyl alcohol (25:24:1) (pH4.3) (Fisher), precipitated with 3 volume ethanol, 1/10 volume of 3 M sodium acetate, and 20 μg of glycogen, and analyzed with purified as the standard by 8 % urea PAGE, followed by electro-transfer to Hybond-XL membrane (Amersham Biosciences) in TBE buffer at 19 V for 60 min at 4°C, and northern blotting with the 5′-[32P] labeled oligo probe JA76 5′-AGC CCT GCG CGC TTC CAC TG-3′ specific for . The hybridization was done in (0.5 M sodium phosphate, pH7.2, 7% SDS, and 10 mM EDTA) at 57°C for 20 hr. The membrane was then washed in 2 X SSPE containing 0.1 % SDS twice, then 1 X SSPE containing 0.1 % SDS twice, exposed to imaging plate for an appropriate time, and analyzed by Cyclone™ Storage Phosphor System (Packard). The reminder of the immunoprecipitated fraction was analyzed with purified eIF2 (a gift of E. Hannig) as the standard by SDS-PAGE followed by immunoblotting, as described above.
Molar amounts of and eIF2 precipitated were determined directly by comparing the band density against those of purified components. Molar amounts of other eIFs precipitated were determined based on the percentage of eIF precipitated and the level of the corresponding eIFs relative to eIF2. These values are presented below each gel in Fig. 1A.
Quantitation of aminoacylated
To measure the relative amount of aminoacylated and deacylated in our WCE sample, total RNA was isolated from WCE by adding them to 4.0 ml AE buffer (0.3 M NaOAc pH 4.5, 10 mM EDTA), followed by extraction with an equal volume of AE buffer-saturated phenol by three rounds of vortex agitation for 1 min with a 1 min incubation on ice between rounds of vortex agitation. After centrifugation at 3000xg for 15 min at 4°C, the aqueous portion of the sample was re-extracted by the addition of an equal volume of AE buffer-saturated phenol and vortex agitation as mentioned above. After a second centrifugation, the aqueous layer was collected. precipitated with 3 volume of ethanol and 1/10 volume of 3M sodium acetate, washed with 70% ethanol and resuspended in a buffer of 10 mM sodium acetate (pH 4.5) and 1 mM EDTA. Total tRNA sample containing intact aminoacyl tRNAs was purified in parallel from whole cells by suspending them directly into 4.0 ml of AE buffer, followed by phenol extraction and ethanol precipitation. The RNA samples were separated on a 6.5% acid-urea acrylamide gel exactly as described 26 and transferred to Biodyne B membrane (Pall), followed by hybridization with radiolabeled probe JA11 (5′-TCGGTTTCGATCCGAGGACATCAGGGTTATGA-3′) and phosphorimage analysis using a Storm 840 (GEhealthcare) as previously described 53.
Supplementary Material
Acknowledgments
We are indebted to Ernie Hannig, and Leos Valasek for purified eIF2 and the NIP1-FL strain, respectively. We also thank Toshi Inada for a timely gift of materials and personal communication, and Tom Rajbandary for discussion. This work was supported by the NIH COBRE awards P20 RR15563 and RR16475, the NCRR K-INBRE pilot grants P20 RR016475, matching support from the State of Kansas and the KSU, and NIH Grant R01 GM64781 to KA and a project grant from The Wellcome Trust to GDP.
Abbreviations
- eIF
eukaryotic initiation factor
- TC
ternary complex
- GAP
GTPase activating protein
- G protein
guanine nucleotide binding protein
- GEF
guanine nucleotide exchange factor
- CTD
carboxyl-terminal domain
- NTD
amino-terminal domain
- YPD
yeast-extract peptone dextrose (medium)
- SC
synthetic defined complete (medium)
- MFC
multifactor complex
- AA-box
acidic and aromatic amino acid box
- PBS
phosphate-buffered saline
- GST
glutathione S-transferase
- FH
FLAG-epitope and polyhistidine double affinity tag
- WCE
whole cell extracts
Footnotes
Publisher's Disclaimer: This is a PDF file of an unedited manuscript that has been accepted for publication. As a service to our customers we are providing this early version of the manuscript. The manuscript will undergo copyediting, typesetting, and review of the resulting proof before it is published in its final citable form. Please note that during the production process errors may be discovered which could affect the content, and all legal disclaimers that apply to the journal pertain.
To indicate the position of epitope-tag introduced, we named the tagged protein or allele by hyphenating the protein or gene name and the tag (preceded by a number indicating the tag's copy number) in the amino- to carboxyl- or 5′- to 3′- orientation, respectively. The epitope-tags used for immuno-detection are FL for the FLAG peptide (DYKDDDDK) and HA for the influenza hemaglutinin peptide (YPYDVPDYA). Hexahistidine-tag (His) was fused for one-step affinity purification.
References
- 1.Pestova TV, Lorsch JR, Hellen CUT. The mechanism of translation initiation in eukaryotes. In: Mathews MB, Sonenberg N, Hershey JWB, editors. Translational Control in Biology and Medicine. Cold Spring Harbor Lab Press; Cold Spring Harbor, NY: 2007. pp. 87–128. [Google Scholar]
- 2.Hinnebusch AG, Dever TE, Asano K. Mechanism of translation initiation in the yeast Saccharomyces cerevisiae. In: Mathews MB, Sonenberg N, Hershey JWB, editors. Translational Control in Biology and Medicine. Cold Spring Harbor Lab Press; Cold Spring Harbor, NY: 2007. pp. 225–268. [Google Scholar]
- 3.Huang H, Yoon H, Hannig EM, Donahue TF. GTP hydrolysis controls stringent selection of the AUG start codon during translation initiation in Saccharomyces cerevisiae. Genes Dev. 1997;11:2396–2413. doi: 10.1101/gad.11.18.2396. [DOI] [PMC free article] [PubMed] [Google Scholar]
- 4.Algire MA, Maag D, Lorsch JR. Pi release from eIF2, not GTP hydrolysis, is the step controlled by start-site selection during eukaryotic translation initiation. Mol Cell. 2005;20:1–12. doi: 10.1016/j.molcel.2005.09.008. [DOI] [PubMed] [Google Scholar]
- 5.Asano K, Clayton J, Shalev A, Hinnebusch AG. A multifactor complex of eukaryotic initiation factors eIF1, eIF2, eIF3, eIF5, and initiator tRNAMet is an important translation initiation intermediate in vivo. Genes Dev. 2000;14:2534–2546. doi: 10.1101/gad.831800. [DOI] [PMC free article] [PubMed] [Google Scholar]
- 6.Yamamoto Y, Singh CR, Marintchev A, Hall NS, Hannig EM, Wagner G, Asano K. The eukaryotic initiation factor (eIF) 5 HEAT domain mediates multifactor assembly and scanning with distinct interfaces to eIF1, eIF2, eIF3 and eIF4G. Proc Natl Acad Sci USA. 2005;102:16164–16169. doi: 10.1073/pnas.0507960102. [DOI] [PMC free article] [PubMed] [Google Scholar]
- 7.Wei Z, Xue Y, Xu H, Gong W. Crystal structure of the C-terminal domain of S. cerevisiae eIF5. J Mol Biol. 2006;359:1–9. doi: 10.1016/j.jmb.2006.03.037. [DOI] [PubMed] [Google Scholar]
- 8.Asano K, Krishnamoorthy T, Phan L, Pavitt GD, Hinnebusch AG. Conserved bipartite motifs in yeast eIF5 and eIF2Bε, GTPase-activating and GDP-GTP exchange factors in translation initiation, mediate binding to their common substrate eIF2. EMBO J. 1999;18:1673–1688. doi: 10.1093/emboj/18.6.1673. [DOI] [PMC free article] [PubMed] [Google Scholar]
- 9.Pavitt GD, Ramaiah KVA, Kimball SR, Hinnebusch AG. eIF2 independently binds two distinct eIF2B subcomplexes that catalyze and regulate guanine-nucleotide exchange. Genes Dev. 1998;12:514–526. doi: 10.1101/gad.12.4.514. [DOI] [PMC free article] [PubMed] [Google Scholar]
- 10.Gomez E, Mohammad SS, Pavitt GP. Characterization of the minimal catalytic domain within eIF2B: the guanine-nucleotide exchange factor for translation initiation. EMBO Journal. 2002;21:5292–5301. doi: 10.1093/emboj/cdf515. [DOI] [PMC free article] [PubMed] [Google Scholar]
- 11.Alone PV, Dever TE. Direct binding of translation initiation factor eIF2gamma-G domain to its GTPase-activating and GDP-GTP exchange fctors eIF5 and eIF2Beplsilon. J Biol Chem. 2006;281:12636–12644. doi: 10.1074/jbc.M511700200. [DOI] [PubMed] [Google Scholar]
- 12.Dever TE. Gene-specific regulation by general translation factors. Cell. 2002;108:545–556. doi: 10.1016/s0092-8674(02)00642-6. [DOI] [PubMed] [Google Scholar]
- 13.Gingras AC, Raught B, Sonenberg N. eIF4 initiation factors: effectors of mRNA recruitment to ribosomes and regulators of translation. Ann Rev Biochem. 1999;68:913–963. doi: 10.1146/annurev.biochem.68.1.913. [DOI] [PubMed] [Google Scholar]
- 14.Futcher B, Latter GI, Monardo P, McLaughlin CS, Garrels JI. A sampling of the yeast proteome. Mol Cell Biol. 1999;19:7357–7368. doi: 10.1128/mcb.19.11.7357. [DOI] [PMC free article] [PubMed] [Google Scholar]
- 15.Ghaemmaghami S, Huh WK, Bower K, Howson RW, Belle A, Dephoure N, O'Shea EK, Weissman JS. Global analysis of protein expression in yeast. Nature. 2003;425:737–741. doi: 10.1038/nature02046. [DOI] [PubMed] [Google Scholar]
- 16.von der Haar T, McCarthy JEG. Intracellular translation initiation factor levels in S. cerevisiae and their role in cap-complex formation. molecular microbiology. 2002;46:531–544. doi: 10.1046/j.1365-2958.2002.03172.x. [DOI] [PubMed] [Google Scholar]
- 17.Uetz P, Giot L, Cagney G, Mansfield TA, Judson RS, Knight JR, Lockshon D, Narayan V, Srinivasan M, Pochart P, Qureshi-Emili A, Li Y, Godwin B, Conover D, Kalbfleisch T, Vijayadamodar G, Yang M, Johnston M, Fields S, Rothberg JM. A comprehensive analysis of protein-protein intractions in Saccharomyces cerevisiae. Nature. 2000;403:623–627. doi: 10.1038/35001009. [DOI] [PubMed] [Google Scholar]
- 18.Gavin AC, Aloy P, Grandi P, Krause R, Boesche M, Marzioch M, Rau C, Jensen LJ, Bastuck S, Dümpelfeld B, Edelmann A, Heurtier MA, Hoffman V, Hoefert C, Klein K, Hudak M, Michon AM, Schelder M, Schirle M, Remor M, Rudi T, Hooper S, Bauer A, Bouwmeester T, Casari G, Drewes G, Neubauer G, Rick JM, Kuster B, Bork P, Russell RB, Superti-Furga G. Proteome survey reveals modularity of the yeast cell machinery. Nature. 2006;440:631–636. doi: 10.1038/nature04532. [DOI] [PubMed] [Google Scholar]
- 19.Krogan NJ, Cagney G, Yu H, Zhong G, Guo X, Ignatchenko A, Li J, Pu S, Datta N, Tikuisis AP, Punna T, Peregrin-Alvarez JM, Shales M, Zhang X, Davey M, Robinson MD, Paccanaro A, Bray JE, Sheung A, Beattie B, Richards DP, Canadien V, Lalev A, Mena F, Wong P, Starostine A, Canete MM, Vlasblom J, Wu S, Orsi C, Collins SR, Chandran S, Haw R, Rilstone JJ, Gandi K, Thompson NJ, Musso G, St Onge P, Ghanny S, Lam MH, Butland G, Altaf-Ul AM, Kanaya S, Shilatifard A, O'Shea E, Weissman JS, Ingles CJ, Hughes TR, Parkinson J, Gerstein M, Wodak SJ, Emili A, Greenblatt JF. Global landscape of protein complexes in the yeast Saccharomyces cerevisiae. Nature. 2006;440:637–643. doi: 10.1038/nature04670. [DOI] [PubMed] [Google Scholar]
- 20.Ptacek J, Devgan G, Michaud G, Zhu H, Zhu X, Fasolo J, Guo H, Jona G, Breitkreutz A, Sopko R, McCartney RR, Schmidt MC, Rachidi N, Lee SJ, Mah AS, Meng L, Stark MJ, Stern DF, De Virgilio C, Tyers M, Andrews B, Gerstein M, Schweitzer B, Predki PF, Snyder M. Global analysis of protein phosphorylation in yeast. Nature. 2005;438:679–684. doi: 10.1038/nature04187. [DOI] [PubMed] [Google Scholar]
- 21.Krogan NJ, Peng WT, Cagney G, Robinson MD, Haw R, Zhong G, Guo X, Zhang X, Canadien V, Richards DP, Beattie BK, Lalev A, Zhang W, Davierwala AP, Mnaimneh S, Starostine A, Tikuisis AP, Grigull J, Datta N, Bray JE, Hughes TR, Emili A, Greenblatt JF. High-definition macromoletular composition of yeast RNA-processing complexes. Mol Cell. 2005;13:225–239. doi: 10.1016/s1097-2765(04)00003-6. [DOI] [PubMed] [Google Scholar]
- 22.Singh CR, Lee B, Udagawa T, Mohammad-Quereshi SS, Yamamoto Y, Pavitt GD, Asano K. An eIF5/eIF2 complex antagonizes guanine nucleotide exchange by eIF2B during translation initiation. EMBO J. 2006;25:4537–4546. doi: 10.1038/sj.emboj.7601339. [DOI] [PMC free article] [PubMed] [Google Scholar]
- 23.Asano K, Lon P, Krishnamoorthy T, Pavitt GD, G E, Hannig EM, Nika J, Donahue TF, Huang HK, Hinnebusch AG. Analysis and Reconstitution of Translation Initiation In Vitro. Methods in Enzymology. 2002;351:221–247. doi: 10.1016/s0076-6879(02)51850-4. [DOI] [PubMed] [Google Scholar]
- 24.Warner JR. The economics of ribosome biosynthesis in yeast. Trends Biochem Sci. 1999;24:437–440. doi: 10.1016/s0968-0004(99)01460-7. [DOI] [PubMed] [Google Scholar]
- 25.Singh CR, Curtis C, Yamamoto Y, Hall NS, Kruse DS, Hannig EM, Asano K. eIF5 is critical for the integrity of the scanning preinitiation complex and accurate control of GCN4 translation. Molecular and Cellular Biology. 2005;25:5480–5491. doi: 10.1128/MCB.25.13.5480-5491.2005. [DOI] [PMC free article] [PubMed] [Google Scholar]
- 26.Varshney U, Lee CP, RajBhandary UL. Direct Analysis of Aminoacylation Levels of tRNAs in Vivo. Application to studying recognition of Escherichia coli initiator tRNA mutants by glutaminyl-tRNA synthetase. J Biol Chem. 1991;266:24712–24718. [PubMed] [Google Scholar]
- 27.Pavitt GD, Yang W, Hinnebusch AG. Homologous segments in three subunits of the guanine nucleotide exchange factor eIF2B mediate translational regulation by phosphorylation of eIF2. Mol Cell Biol. 1997;17:1298–1313. doi: 10.1128/mcb.17.3.1298. [DOI] [PMC free article] [PubMed] [Google Scholar]
- 28.Richardson JP, Mohammad SS, Pavitt GD. Mutations causing childhood ataxia with central nervous system hypomyelination reduce eukaryotic initiation factor 2B complex formation and activity. Mol Cell Biol. 2004;24:2352–2363. doi: 10.1128/MCB.24.6.2352-2363.2004. [DOI] [PMC free article] [PubMed] [Google Scholar]
- 29.Hinnebusch AG. Mechanism and regulation of initiator methionyl-tRNA binding to ribosomes. In: Sonenberg N, Hershey JWB, Mathews MB, editors. Translational Control of Gene Expression. Cold Spring Harbor Laboratory Press; Cold Spring Harbor: 2000. pp. 185–243. [Google Scholar]
- 30.Singh CR, Yamamoto Y, Asano K. Physical association of eukaryotic initiation factor 5 (eIF5) carboxyl terminal domain with the lysine-rich eIF2β segment strongly enhances its binding to eIF3. Journal of Biological Chemistry. 2004;279:49644–49655. doi: 10.1074/jbc.M409609200. [DOI] [PubMed] [Google Scholar]
- 31.Dever TE, Feng L, Wek RC, Cigan AM, Donahue TD, Hinnebusch AG. Phosphorylation of initiation factor 2α by protein kinase GCN2 mediates gene-specific translational control of GCN4 in yeast. Cell. 1992;68:585–596. doi: 10.1016/0092-8674(92)90193-g. [DOI] [PubMed] [Google Scholar]
- 32.Campbell SG, Hoyle NP, Ashe MP. Dynamic cycling of eIF2 through a large eIF2B-containing cytoplasmic body: implications for translational control. J Cell Biol. 2005;170:925–934. doi: 10.1083/jcb.200503162. [DOI] [PMC free article] [PubMed] [Google Scholar]
- 33.Fekete CA, Applefield DJ, Blakely SA, Shirokikh N, Pestova T, Lorsch JR, Hinnebusch AG. The eIF1A C-terminal domain promotes initiation complex assembly, scanning and AUG selection in vivo. EMBO J. 2005;24:3588–3601. doi: 10.1038/sj.emboj.7600821. [DOI] [PMC free article] [PubMed] [Google Scholar]
- 34.Newman JR, Ghaemmaghami S, Ihmels J, Breslow DK, Noble M, DeRisi JL, Weissman JS. Single-cell proteomic analysis of S. cerevisiae reveals the architecture of biological noise. Nature. 2006;441:840–846. doi: 10.1038/nature04785. [DOI] [PubMed] [Google Scholar]
- 35.Dong J, Qiu H, Garcia-Barrio M, Anderson J, Hinnebusch AG. Uncharged tRNA activates GCN2 by displacing the protein kinase moiety from a bipartite tRNA-binding domain. Mol Cell. 2000;6:269–279. doi: 10.1016/s1097-2765(00)00028-9. [DOI] [PubMed] [Google Scholar]
- 36.Powers T. Ribosome biogenesis: giant steps for a giant problem. Cell. 2004;119:901–902. doi: 10.1016/j.cell.2004.12.011. [DOI] [PubMed] [Google Scholar]
- 37.Cherkasova VA, Hinnebusch AG. Translational control by TOR and TAP42 through dephosphorylation of eIF2 kinase GCN2. Genes and Development. 2003;17:859–872. doi: 10.1101/gad.1069003. [DOI] [PMC free article] [PubMed] [Google Scholar]
- 38.Rutter J, Probst BL, McKnight SL. Coordinate reulgation of sugar flux and translatiion by PAS kinase. Cell. 2002;111:17–28. doi: 10.1016/s0092-8674(02)00974-1. [DOI] [PubMed] [Google Scholar]
- 39.Feng L, Yoon H, Donahue TF. Casein kinase II mediates multiple phosphorylation of Saccharomyces cerevisiae eIF-2α (encoded by SUI2), which is required for optimal eIF-2 function in S. cerevisiae. Mol Cell Biol. 1994;14:5139–5153. doi: 10.1128/mcb.14.8.5139. [DOI] [PMC free article] [PubMed] [Google Scholar]
- 40.Wang X, Paulin FEM, Campbell LE, Gomez E, O'Brien K, Morrice N, Proud CG. Eukaryotic initiation factor 2B: identification of multiple phosphorylation sites in the e-subunit and their functions in vivo. EMBO J. 2001;20:4349–4359. doi: 10.1093/emboj/20.16.4349. [DOI] [PMC free article] [PubMed] [Google Scholar]
- 41.Maiti T, Bandyopadhyay A, Maitra U. Casein kinase II phosphorylates translation initiation factor 5 (eIF5) in Saccharomyces cerevisiae. Yeast. 2003;20:97–108. doi: 10.1002/yea.937. [DOI] [PubMed] [Google Scholar]
- 42.Homma MK, Wada I, Suzuki T, Yamaki J, Krebs EG, Homma Y. CK2 phosphorylation of eukaryotic translation initiation factor 5 potentiates cell cylce progression. Proc Acad Natl Sci USA. 2005;102:15688–15693. doi: 10.1073/pnas.0506791102. [DOI] [PMC free article] [PubMed] [Google Scholar]
- 43.Litchfield DW. Protein kinase CK2: structure, regulation and role in cellular decsions of life and death. Biochem J. 2003;369:1–15. doi: 10.1042/BJ20021469. [DOI] [PMC free article] [PubMed] [Google Scholar]
- 44.Hanna DE, Rethinaswamy A, Glover CVC. Casein kinase II is required for cell cycle progression during G1 and G2/M in Saccharomyces cerevisiae. J Biol Chem. 1995;270:25905–25914. doi: 10.1074/jbc.270.43.25905. [DOI] [PubMed] [Google Scholar]
- 45.Scaglioni PP, Young TM, Cai LF, Erdjument-Bromage H, Kaufman AJ, Singh B, Teruya-Feldstein J, Tempst P, Pandolfi PP. A CK2-depndent mechanism for degradtion of the PML tumor suppressor. Cell. 2006;126:269–283. doi: 10.1016/j.cell.2006.05.041. [DOI] [PubMed] [Google Scholar]
- 46.Smirnova JB, Selley JN, Sanchez-Cabo F, Carroll K, Eddy AA, McCarthy JEG, Hubbard SJ, Pavitt GD, Grant CM, Ashe MP. Global Gene Expression Profiling Reveals Widespread yet Distinctive Translational Responses to Different Eukaryotic Translation Initiation Factor 2B-Targeting Stress Pathways. Mol Cell Biol. 2005;25:9340–9349. doi: 10.1128/MCB.25.21.9340-9349.2005. [DOI] [PMC free article] [PubMed] [Google Scholar]
- 47.Asano K, Phan L, Anderson J, Hinnebusch AG. Complex formation by all five homologues of mammalian translation initiation factor 3 subunits from yeast Saccharomyces cerevisiae. J Biol Chem. 1998;273:18573–18585. doi: 10.1074/jbc.273.29.18573. [DOI] [PubMed] [Google Scholar]
- 48.Inada T, Winstall E, Tarun SZ, Yates JR, Schieltz D, Sachs AB. One-step affinity purification of the yeast ribosome and its associted proteins and mRNAs. RNA. 2002;8:948–958. doi: 10.1017/s1355838202026018. [DOI] [PMC free article] [PubMed] [Google Scholar]
- 49.Boeke JD, Trueheart J, Natsoulis G, Fink GR. 5-fluoroorotic acid as a selective agent in yeast molecular genes. Methods Enzymol. 1987;154:164–175. doi: 10.1016/0076-6879(87)54076-9. [DOI] [PubMed] [Google Scholar]
- 50.Sherman F. Getting started with yeast. Methods Enzymol. 1991;191:3–21. doi: 10.1016/0076-6879(91)94004-v. [DOI] [PubMed] [Google Scholar]
- 51.Singh CR, Hui H, Ii M, Yamamoto Y, Asano K. Efficient incorporation of eIF1 into the multifactor complex is critical for formation of functional ribosomal preinitiation complexes in vivo. Journal of Biological Chemistry. 2004;279:31910–31920. doi: 10.1074/jbc.M313940200. [DOI] [PubMed] [Google Scholar]
- 52.Sambrook J, Fritsch EF, Maniatis T. Molecular Cloning, a Laboratory Manual. 2. Cold Spring Harbor Laboratory; Cold Spring Harbor, NY: 1989. [Google Scholar]
- 53.Anderson J, Phan L, Cuesta R, Carlson BA, Pak M, Asano K, Bjork GR, Tamame M, Hinnebusch AG. The essential Gcd10p-Gcd14p nuclear complex is required for 1-methyladenosine modification and maturation of initiator methionyl-tRNA. Genes and Development. 1998;12:3650–3662. doi: 10.1101/gad.12.23.3650. [DOI] [PMC free article] [PubMed] [Google Scholar]
- 54.Asano K, Shalev A, Phan L, Nielsen K, Clayton J, Valasek L, Donahue TF, Hinnebusch AG. Multiple roles for the carboxyl terminal domain of eIF5 in translation initiation complex assembly and GTPase activation. EMBO Journal. 2001;20:2326–2337. doi: 10.1093/emboj/20.9.2326. [DOI] [PMC free article] [PubMed] [Google Scholar]
- 55.Tarun SZ, Sachs AB. Binding of eukaryotic translation initiation factor 4E (eIF4E) to eIF4G represses translation of uncapped mRNA. Molecular and Cellular Biology. 1997;17:6876–6886. doi: 10.1128/mcb.17.12.6876. [DOI] [PMC free article] [PubMed] [Google Scholar]
- 56.Ramirez M, Wek RC, Vazquez de Aldana CR, Jackson BM, Freeman B, Hinnebusch AG. Mutations activating the yeast eIF-2α kinase GCN2: Isolation of alleles altering the domain related to histidyl-tRNA synthetases. Mol Cell Biol. 1992;12:5801–5815. doi: 10.1128/mcb.12.12.5801. [DOI] [PMC free article] [PubMed] [Google Scholar]
Associated Data
This section collects any data citations, data availability statements, or supplementary materials included in this article.