

Abstract
Prostacyclin synthase (PGIS) and thromboxane synthase (TXAS) are atypical cytochrome P450s. They do not require NADPH or dioxygen for isomerization of prostaglandin H2 (PGH2) to produce prostacyclin (PGI2) and thromboxane A2 (TXA2). PGI2 and TXA2 have opposing actions on platelet aggregation and blood vessel tone. In this report, we use a lipid hydroperoxide, 15-hydroperoxyeicosatetraenoic acid (15-HPETE), to explore the active site characteristics of PGIS and TXAS. The two enzymes transformed 15-HPETE not only into 13-hydroxy-14,15-epoxy-5,8,11-eicosatrienoic acid (13-OH-14,15-EET), like many microsomal P450s, but also to 15-ketoeicosatetraenoic acid (15-KETE) and 15-hydroxyeicosatetraenoic acid (15-HETE). 13-OH-14,15-EET and 15-KETE result from homolytic cleavage of the O–O bond, whereas 15-HETE results from heterolytic cleavage, a common peroxidase pathway. About 80% of 15-HPETE was homolytically cleaved by PGIS and 60% was homolytically cleaved by TXAS. The Vmax of homolytic cleavage is 3.5-fold faster than heterolytic cleavage for PGIS-catalyzed reactions (1100 min−1 vs. 320 min−1) and 1.4-fold faster for TXAS (170 min−1 vs. 120 min−1). Similar KM values for homolytic and heterolytic cleavages were found for PGIS (∼60 μM 15-HPETE) and TXAS (∼80 μM 15-HPETE), making PGIS a more efficient catalyst for the 15-HPETE reaction.
Keywords: prostacyclin synthase, thromboxane synthase, cytochrome P450, peroxide bond cleavage, homolytic, heterolytic, hydroperoxides, epoxyalcohol
Prostacyclin synthase (PGIS) and thromboxane synthase (TXAS) are members of the cytochrome P450 superfamily, which uses heme as the prosthetic group and has a cysteine thiolate proximal ligand [1, 2]. PGIS and TXAS convert prostaglandin H2 (PGH2) to prostacyclin (PGI2) and thromboxane A2 (TXA2), respectively. PGI2 inhibits platelet activation and aggregation and induces vasodilation, whereas TXA2 stimulates platelet secretion, aggregation and vasoconstriction [3]. Both PGI2 and TXA2 are rapidly hydrolyzed to biologically inactive forms, thus making PGI2 and TXA2 autocrine or paracrine mediators. PGIS and TXAS are localized to the endoplasmic reticulum membrane. Unlike other microsomal P450s, they catalyze isomerization rather than mono-oxygenation reactions. In addition, they undergo suicide inactivation during catalysis. Although PGIS shares many features with TXAS, they only have 16% sequence identity, suggesting a potential difference in reaction mechanisms.
Hecker and Ullrich proposed a caged radical mechanism for TXAS and PGIS catalysis [4]. In this mechanism, the initial step of substrate binding and interaction of one of the endoperoxide oxygens of PGH2 with the ferric heme iron is followed by homolytic scission of the peroxide bond, leading to formation of alkoxy radical and [S−⋯Fe(IV)⋯O–R] intermediates. With TXAS, the alkoxy radical undergoes a β-scission and ionic rearrangement to form TXA2. With PGIS, the alkoxy radical undergoes cyclization, giving rise to a carbon-centered radical. Subsequent oxidation of the carbon-centered radical and formation of an alkene generate PGI2. Both TXAS and PGIS utilize an endoperoxide (PGH2) as their substrate, and some aspects of peroxidase-based mechanisms may be relevant. Most peroxidases have heme Fe(III) as the prosthetic group and catalyze a two-electron oxidation to produce an intermediate called Compound I (Cpd I) [5]. Subsequent one-electron reduction of Cpd I generates Compound II (Cpd II), which contains an Fe(IV)-oxo complex. A further one-electron reduction regenerates the resting peroxidase.
Hydroperoxides have been frequently used in studying P450 reaction mechanisms because they provide an effective alternative for the separate addition of molecular oxygen and reducing equivalents, the so-called “peroxide shunt”. Numerous reports indicated that P450s catalyze both homolytic and heterolytic cleavages of hydroperoxides and peroxyacids [6-8]. Homolytic O–O scission produces Cpd II and an alkoxyl radical (RO·) (eq. [1]); the alkoxyl radical is subsequently oxidized to a carbonyl product or subjected to β-scission. Heterolytic O–O scission yields an alcohol (ROH) and Cpd I, which is a complex of Fe(IV)=O with either a porphyrin radical or an amino acid radical, [X]·+ (eq. [2]).
| [1] |
| [2] |
15-HPETE is a 20-carbon fatty acid hydroperoxide derived from arachidonic acid and is a potential substrate for both PGIS and TXAS. In mammals, 15-HPETE can be synthesized by 15-lipoxygenase present in various tissues and cells [9]. Weiss et al first reported product analysis of 15-HPETE reacted with P450-enriched liver microsomes isolated from phenobarbital-treated rats [10]; the main products were 13-OH-14,15-EET (an epoxyalcohol) and 11,14,15-trihydroxy-5,8,12-trienoic acid. Later, purified P450 2B1 was reported to convert 15-HPETE to11-hydroxy-14,15-epoxy-5,8,11-eicosatrienoic acid and, to a lesser extent, 13-OH-14,15-EET [11]. It was postulated that 15-HPETE was first homolytically cleaved by heme iron(III) to generate a ferryl-hydroxo complex and an epoxy allylic radical. The enzyme then returns to the ferric state by donating the hydroxyl radical to the allylic radical, producing an epoxyalcohol. Interestingly, 15-KETE and 15-HETE were not detected as products from these typical microsomal P450s. To understand how the reactivities and mechanisms of PGIS and TXAS differ from other P450s, we analyzed the products of PGIS and TXAS reactions with 15-HPETE. The results indicate that PGIS and TXAS convert 15-HPETE to a mixture of products comprised of 15-HETE, 15-KETE, and an epoxyalcohol.
MATERIALS AND METHODS
Materials
Unlabeled arachidonic acid was purchased from NuChek Preps (Elysian, MN). [1-14C]-arachidonic acid (55 mCi/mmol) was purchased from Amersham Pharmacia Biotech. Soybean 15-lipoxygenase (Soybean P1) came from Cayman Chemical. Guaiacol (o-methoxyphenol), α-aminolevulinic acid, Lubrol PX and lactose were purchased from Sigma. Sheep apo-PGHS-1 and holoenzymes replenished with hemin or mangano protoporphyrin IX were prepared as described previously [12].
Expression and Purification of Recombinant PGIS and TXAS
Recombinant PGIS was prepared as described previously, and its concentration was spectrophotometrically determined using ε418 = 103 mM−1 cm−1 [13]. The TXAS expression vector was essentially the same as previously described [14] except that the amino terminal segment (MALLLAVF) was replaced by a hydrophilic segment (MAKKTSS). The MAKKTSS sequence has been used in overexpression of many microsomal P450s [15]. The resultant plasmid yielded a recombinant TXAS with MAKKTSS replacing the first 28 amino acid residues and a four-histidine tag at the carboxyl terminus. The TXAS plasmid was transformed in E. coli BL21(DE3)pLysS, and the recombinant protein was induced by IPTG in the presence of δ-aminolevulinic acid. Purification of TXAS was modified from previous procedures [14]. Briefly, the frozen cells were re-suspended in 50 mM NaPi, pH 7.5 containing 0.1 M NaCl, 10% glycerol, 50 μg/ml DNase and 4 mM MgCl2, and then subjected to sonication. TXAS was solubilized by overnight treatment with 1% Emulgen 913 and was recovered in the supernatant following centrifugation at 100,000 × g for 1 h. The enzyme was applied to a nickel nitrilotriacetate agarose column (Qiagen) pre-equilibrated with Buffer A (20 mM NaPi, pH 7.5 and 10% glycerol). All the following buffers contained 0.2 % Lubrol PX. The column was washed with Buffer A containing 0.5 M NaCl until A280 was less than 0.1, and then with Buffer A containing 5 mM of histidine until A420 started to increase. TXAS was eluted with Buffer A containing 100 mM histidine, diluted four-fold with Buffer B (10 mM NaPi, pH 7.5 and 10% glycerol) and loaded on a hydroxyapatite column (Bio-Rad). The column was washed with Buffer B until A280 was less than 0.05 and then washed with 50 mM NaPi, pH 7.5 and 10 % glycerol until A420 started to increase. TXAS then was eluted with 200 mM NaPi, pH 7.5 and 10% glycerol. The concentration of TXAS was determined using ε418 = 100 mM−1 cm−1 [14]. Both PGIS and TXAS were stored at −70°C. Absorbance was measured with a Shimadzu UV-2501PC spectrophotometer.
Preparation of 15-HPETE and [1-14C]-15-HPETE
15-HPETE was synthesized from 25 μmol of arachidonic acid in 30 ml of 0.1 M Tris, pH 9.0, that had been saturated with oxygen. The reaction was initiated by adding 0.25 × 10⁶ units of 15-lipoxygenase and proceeded for 2 min at room temperature. Subsequently, a second aliquot of 15-lipoxygenase (0.25 × 10⁶ units) was added, and the reaction continued for an additional 8 min. Oxygen was gently bubbled into the buffer throughout the reaction. Formation of 15-HPETE was monitored by an increase in A235. The reaction was stopped by adding 7.5 ml of ethanol and chilling on ice. After acidification to pH 3 with 12 N HCl, lipids were extracted three times with 4 volumes of ethyl acetate/hexane (1:1). The combined organic layers were dried over anhydrous sodium sulfate and concentrated by a stream of nitrogen gas. The extracts were applied to a silica HPLC semi-preparative column (Waters Spherisorb S10 W, 5 μm, 10 × 250 mm) and eluted isocratically with hexane/isopropanol/acetic acid (985:15:1, v/v/v) at a flow rate of 2.0 ml/ min; the eluate was monitored by A234. Fractions containing 15-HPETE were combined, concentrated by evaporation with a stream of nitrogen gas and stored at −20°C. The concentration of 15-HPETE was determined using ε235 = 23 mM−1 cm−1 [16]. [1-14C]-15-HPETE was synthesized from [1-14C]-arachidonic acid (25 μmol, 20 μCi) following the same procedures. To prepare 15-HPETE for experiments in aqueous solution, the HPLC solvent was evaporated with a stream of nitrogen gas and replaced with ethanol. [1-14C]-15-HETE was prepared by reacting 15-HPETE with Fe-PGHS [16], followed by purification through a silica HPLC column.
Product Analysis by HPLC and Electron-Spray Ionization Mass Spectrometry (ESI/MS)
PGIS or TXAS was reacted with [1-14C]-15-HPETE for 10 s in 0.5 ml of 20 mM NaPi, pH 7.5, containing 10% glycerol at 23°C. The reactions were stopped by acidification with HCl, followed by three extractions with 3 volumes of ether. The ether was evaporated with a stream of nitrogen gas and the extracts were re-dissolved in 200 μl of mobile phase (hexane/isopropanol/acetic acid (985:15:1, v/v/v)), separated on a silica HPLC analytic column (Waters Spherisorb S5W, 5 μm, 4.6 × 250 mm), and eluted isocratically with the mobile phase at 1 ml/min. Radioactivity eluting from the column was monitored with a Radiomatic Flo-One β-detector (IN/US system).
The individual peaks were identified as follows. 15-HETE and 15-KETE were identified using the authentic compounds produced by the reaction of 15-HPETE with Fe- or Mn-PGHS, respectively [12, 16]. Fe- or Mn-PGHS (0.5 μM) was reacted with [1-14C]-15-HPETE (100 μM) in the presence of guaiacol (980 μM) for 1 min. The products were extracted and subjected to HPLC analysis as mentioned above. The third product peak was collected, derivatized with Agtrifluoroacetic acid and analyzed with a Thermo Electron, LCQ DECA-XP Plus mass spectrometer equipped with an electron spray ionization apparatus. ESI/MS analysis was accomplished with a spray voltage of 4.5 kV. The temperature and voltage applied to the capillary were 250°C and 42 V, respectively.
Steady-State Kinetic Analysis
PGIS (0.5 μM) or TXAS (1.8 μM) was incubated with various concentrations of [1-14C]-15-HPETE in 0.5 ml of 20 mM NaPi, pH 7.5, containing 10% glycerol at 23°C for 5 or 10 s, respectively. The reactions were stopped by acidification with HCl, followed by ether extraction. The samples were prepared and separated on a silica HPLC analytic column as described above. Product quantificaion was carried out by scintillation counting. Areas within the product peaks were compared with the standard curve obtained from peak areas vs. 15-HPETE concentrations.
Absorbance changes were recorded with a Shimadzu UV-2501PC spectrophotometer to determine the rate of co-substrate oxidation. Various concentrations of 15-HPETE were added to 1 μM of PGIS or TXAS in 1 ml of 20 mM NaPi, pH 7.5, containing 10% glycerol and 1.8 mM guaiacol. The rate of oxidized guaiacol formation was calculated from ΔA470/min using Δε470 = 26.6 mM−1cm−1 [17].
EPR Spectroscopy
EPR measurements were carried out at 10 K on a Bruker EMX spectrometer using a GFS600 transfer line, an ITC503 temperature controller and an Oxford ESP900 cryostat. Samples containing PGIS (55 μM) or TXAS (55 μM) in 20 mM NaPi, pH 7.5 and 10% glycerol, were manually mixed with a 20-fold excess of 15-HPETE and frozen immediately in a dry ice/acetone bath. The instrument parameters were: microwave power, 1 mW; microwave frequency, 9.6 GHz; modulation amplitude, 10.87 G; time constant, 328 ms; sweep rate, 168 G/s.
Kinetic Measurements by Stopped-flow Spectroscopy
Kinetic experiments were performed on a Bio-Sequential Model DX-18MV stopped-flow instrument (Applied Photophysics, Leatherhead, UK). PGIS or TXAS in 20 mM NaPi, pH 7.5 and 10% glycerol, was mixed at 23°C with an equal volume of the 15-HPETE solution in the same buffer; the dead time of the instrument was 1.5 ms. Spectral data acquired over 16.4 s (PGIS) or 32.8 s (TXAS) were subjected to singular value decomposition (SVD), and the key spectral intermediates were then resolved by global analysis using the Pro-K software package. In separate single-wavelength experiments, heme oxidation was monitored at 418 nm, and reaction kinetics were analyzed with the built-in software. The reactions with 15-HPETE were found to be biphasic for both enzymes over the collection times (20 s for PGIS and 50 s for TXAS) and were fitted by a two-exponential equation:
where k1,obs and k2,obs are the rate constants, B1 and B2 are the amplitudes for the fast and slow phases, respectively, and C is the final absorbance.
RESULTS
Expression and Purification of TXAS
Expression of TXAS containing a hydrophobic amino terminal segment (MALLLAVF) derived from P450c17 suffered from batch-to-batch variations in yield [14]. To circumvent this problem, we replaced the amino terminus with a hydrophilic segment (MAKKTSS), which has been successfully used for protein crystallization of several members of P450 families 2 and 3 [15, 18, 19]. Additionally, a simplified purification procedure was developed to replace the previous scheme, which included ion exchange and hydrophobic columns. We typically obtained 5 mg of purified TXAS per liter of culture medium (Table I). This yield of the hydrophilic N-terminal TXAS considerably exceeded that of TXAS with the hydrophobic N-terminus (∼0.8 mg/L of culture) [14].
Table I.
Purification of TXAS with hydrophilic amino-terminal segment expressed in E. colia.
| Step | Protein (mg) |
Specific activityb (nmol MDA/min/mg) |
Yield (%) |
|---|---|---|---|
| Cell homogenate | 4123 | 62 | 100 |
| Ni-NTA | 65 | 760 | 19 |
| Hydroxyapatite | 26 | 1500 | 15 |
Values shown are for a typical run in 5 L of culture medium.
Enzymatic assays were carried out in 20 mM NaPi, pH 7.5, containing 10% glycerol at 23°C and ∼30 μM of PGH2. MDA formation was monitored by A268 [14].
The UV-visible absorption spectrum of hydrophilic N-terminal TXAS is indistinguishable from that of hydrophobic N-terminal TXAS. The TXAS with hydrophilic N-terminus converts PGH2 to TXA2, malondialdehyde and 12-hydroxy-5, 8, 10-heptadecatrienoic acid at a molar ratio of 1:1:1, with a turnover number, kcat, of 5,000 ± 300 min−1 and KM (PGH2) of 29 ± 5 μM, comparable to the values for TXAS with hydrophobic N-terminus (kcat of 4,000 ± 300 min−1; KM, 21 ± 2 μM [20]). These results indicate that alteration of the N-terminal segment had little effect on the TXAS catalytic activity. TXAS was about 95% pure by electrophoretic analysis, similar to the purity of recombinant PGIS (Fig. 1).
Fig.1.

SDS-PAGE analysis of purified hPGIS and TXAS (1 μg each) on a 10 % polyacrylamide gel. The proteins were stained by Coomassie Blue. The sizes of molecular weight markers (10 kDa markers from GibcoBRL) are indicated.
Product Identification of Products from the Reaction of 15-HPETE with PGIS or TXAS
PGIS and TXAS have endoperoxides as their physiological substrates, and it is conceivable that they may behave as peroxidases that catalyze a two-electron reduction of peroxide (heterolytic cleavage of O–O bond). However, we previously reported that PGIS catalyzed 90% of homolytic and 10% of heterolytic O–O cleavage of 10-hydroperoxyoctadeca-8,12-dienoic acid [13]. In view of these facts, we expected that PGIS and TXAS would convert 15-HPETE to 15-KETE (via the homolytic cleavage and one-electron oxidation of Fe(III)) and 15-HETE (via the heterolytic cleavage and two-electron oxidation of Fe(III)) (Scheme I). We thus analyzed the products of [1-14C]-15-HPETE reacted with PGIS or TXAS. As shown in Fig. 2C and 2D, PGIS and TXAS both produced 15-KETE and 15-HETE as major products from 15-HPETE (cf. Fig. 2A). PGIS produced more 15-KETE, and TXAS produced more 15-HETE. A third major product with both PGIS and TXAS, which had negligible absorbance at 235 nm, was eluted with a retention time of ∼ 22 min. 15-HPETE was not metabolized by boiled PGIS (Fig. 2B) or TXAS (data not shown). For both PGIS and TXAS reactions, the radioactivity recovered from the three products accounted for more than 95% of the radioactivity decrease in 15-HPETE, indicating that no other major products were synthesized.
Scheme I.
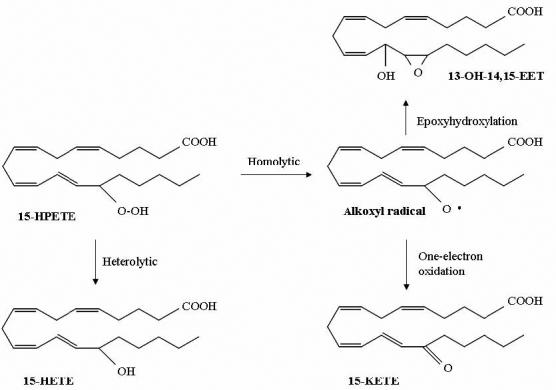
Proposed metabolism of 15-HPETE, catalyzed by PGIS or TXAS.
Fig.2.

Chromatographic analyses of products from the reaction of 15-HPETE with PGIS or TXAS. HPLC radio-chromatograms of reaction products of (A) 0.5 μM of Mn-PGHS with 100 μM 15-HPETE for 60 s in the presence of 1 mM guaiacol, (B) 2 μM of boiled PGIS with 15-HPETE for 10 s, (C) 2 μM of PGIS with 75 μM 15-HPETE for 10 s and (D) 5 μM of TXAS with 60 μM 15-HPETE for 10 s.
The material eluting at 22 min was analyzed by ESI/MS (Supplementary Data). The m/z of the molecular ion was 443.5/445.5 (MAg+), and the secondary derived ions were at m/z 557.4/559.4, caused by cleavage and subsequent dimerization between C13 and C14 ((M–C7H12O)2Ag+). The product was further dehydrated into m/z 521.2/523.2 ((M–C7H12O–H2O)2Ag+) or decarboxylated to 467.4/469.4 ((M–C7H12O–COOH)2Ag+). It also gave an m/z at 601.5/603.5 ((M–C5H11–H2O)2Ag+) (data not shown). Without complexation with Ag, the 22-min peak material produced ions with the following m/z, assigned according to published results [21, 22]: 337.5 (MH+), 359.5 (MNa+), 695.1 (M2Na+), 473.7 (cleavage between C14 and C15, followed by dimerization, yielding (M–C6H12O)2H+)), and 517.5 (cleavage between C15 and C16, and followed by dimerization, yielding (M–C5H11–H2O)2Na+)) (data not shown). Based on these mass spectra, the third HPLC peak was assigned as 13-OH-14,15-EET. As depicted in Scheme I, formation of 13-OH-14,15-EET most likely resulted from homolytic O–O cleavage within 15-HPETE, followed by the formation of an epoxy-containing allylic radical that abstracts the hydroxyl radical from heme iron [11, 23, 24]. The overall reaction is an isomerization, although reduction and oxidation are involved. To examine the possibility that 13-OH-14,15-EET or 15-KETE was derived from 15-HETE, we incubated a mixture of 60 μM of [1-14C]-15-HETE and 110 μM of un-labeled 15-HPETE with 5 μM of TXAS or PGIS. Neither [1-14C]-13-OH-14,15-EET nor [1-14C]-15-KETE was observed (data not shown), indicating that 13-OH-14,15-EET and 15-KETE are directly formed from 15-HPETE by these two enzymes. The relative amounts of the three enzymatic products were also quantified by the radioactivity detector. The heterolytic product, 15-HETE, represented 19% of the total product from PGIS and 44% of the product from TXAS. Furthermore, the relative amounts of the three products were unchanged over a shorter (2 s) or longer (120 s) incubation time (data not shown).
Steady-State Kinetics of Homolytic and Heterolytic Reactions of 15-HPETE with PGIS or TXAS
To further investigate the kinetics of homolytic and heterolytic pathways by PGIS and TXAS, we determined the rates of the two cleavage paths versus the concentrations of [1-14C]-15-HPETE (30- 300 μM). Homolytic cleavage (15-KETE and 13-OH-14,15-EET) and heterolytic cleavage (15-HETE) products of PGIS and TXAS were separated by HPLC and quantified by liquid scintillation counting. It should be noted that comparable amounts of homolytic and heterolytic products were obtained even when a peroxidase co-substrate, guaiacol, was present in the reaction mixtures, and the absorbance changes at 470 nm, an indicator of guaiacol oxidation, were insignificant (data not shown). These results suggest that the oxidized heme intermediates of PGIS and TXAS acquire electron(s) from the nearby environment to re-establish their resting states and do not interact with exogenous reducing agents. The homolytic and heterolytic cleavage activities are plotted against the 15-HPETE concentrations in Fig. 3. Homolytic cleavage by PGIS reveals a KM of 65 μM and a Vmax of 1100 mol products formed/mol PGIS/min, and heterolytic cleavage had a KM of 59 μM and a Vmax of 320 mol of 15-HETE formed/mol PGIS/min (Fig. 3A). For TXAS (Fig. 3B), homolytic cleavage reaction had a KM of 87 μM and a Vmax of 170 mol products formed/mol TXAS/min, and the heterolytic reaction had a KM of 71 μM and a Vmax of 120 mol of 15-HETE formed/mol TXAS/min. Both enzymes catalyzed homolytic cleavage faster than heterolytic cleavage. Moreover, PGIS has a higher selectivity for 15-HPETE (greater Vmax/KM values) than TXAS.
Fig.3.

Concentration dependence of PGIS- and TXAS-catalyzed homolytic and heterolytic cleavage of 15-HPETE. Reactions used 0.5 μM PGIS (Panel A) and 1.8 μM TXAS (Panel B) with indicated concentrations of [1-14C]-15-HPETE for 5 s and 10 s, respectively. Products were separated by HPLC and quantified by on-line liquid scintillation. The amounts of homolytic reaction (15-KETE + 13-OH-14,15-EET; filled circles) and heterolytic reaction (15-HETE; open circles) were fit to the Michaelis-Menten equation by linear regression.
Pre-Steady-State Kinetics of PGIS- and TXAS-Catalyzed 15-HPETE Reactions
Fig. 4A shows spectra of PGIS recorded during the reaction with a 15-fold molar excess of 15-HPETE at 23°C. Two phases were observed. The first phase was completed within 3 s and had two isosbestic points at 435 and 581 nm. The second phase was observed between 3 and 16 s and had isosbestic points at 445 and 578 nm (Fig. 4A). Use of SVD and global analysis for the model A → B → C yielded the spectra shown in Fig. 4A, inset, with k1= 0.53 s−1 and k2= 0.07 s−1. Conversion of Species A to Species B was accompanied by a 20% loss of Soret absorbance and a shift from 418 to 420 nm. The intensity of the α band (569 nm) is noticeably less than that of the β band (536 nm) in Species B. This is similar to Cpd II of chloroperoxidase, which is also a P450 enzyme [25]. This similarity suggests that PGIS forms a Cpd II intermediate upon interaction with 15-HPETE, consistent with the observation that 80% of 15-HPETE was homolytically cleaved. Conversion of Species B to Species C was accompanied by a further 30% decrease in the intensity of Soret peak and partial loss of the Q-band feature, suggesting a process of heme bleaching. Longer incubations resulted in a total loss of Soret peak (data not shown), indicating that Species B irreversibly decomposed into Species C. Stopped-flow measurements at 418 nm were used to evaluate the rate constants for the reaction of PGIS with 15-HPETE (Fig. 4B, left panel). Biphasic exponential kinetics were observed for the first 20 s; the observed rate constants are plotted as a function of 15-HPETE concentration (Fig. 4B, right panel). The rate constants of the first phase ranged between 0.7 and 0.9 s−1 and were only slightly dependent on the 15-HPETE concentration. This first phase is unlikely to reflect binding of 15-HPETE because the Kd value of 15-HPETE for PGIS, calculated from the plot, would be ∼1.4 mM. Instead, the data suggest that the first phase is likely a mixture of a binding step, Cpd II formation, and recycling of Cpd II back to the resting enzyme. The presence of spectral isosbestic points in the first 3 sec of the reaction (Fig. 4A) suggests that binding of 15-HPETE has little effect on absorbance change and that Cpd II formation and recycling steps exhibit the same spectral changes but in opposite directions. An attempt to separate 15-HPETE binding from later steps failed, as 400 μM of 15-HPETE did not saturate the observed rate of the first phase. It is thus difficult to resolve the binding step from Cpd II formation using electronic spectroscopy. Similarly, the formation and disappearance of Cpd II are difficult to separate because, unlike peroxidases, a co-substrate is not required for PGIS to restore its resting state. Nonetheless, the observations of the presence of isosbestic points (Fig. 4A), little absorbance changes within the 1.5-ms dead time of the stopped-flow apparatus (Fig. 4B, left panel), and close resemblance of Species B (Fig. 4A, inset) to Cpd II suggest that Cpd II is accumulated during the reaction, and the observed rate constants (∼ 0.8 s−1) are mainly attributed to Cpd II formation. The rate constant of the second phase (∼0.10 s−1) is independent of the 15-HPETE concentration and is probably accountable for the heme-bleaching step.
Fig.4.

Pre-steady-state kinetics of PGIS reaction with 15-HPETE. (A) rapid scan absorbance data of the first 16.4 s for the reaction of PGIS (3.75 μM) with 15-HPETE (56 μM). Spectra were recorded at the indicated time. Arrows show the direction of spectral changes with increasing time. Inset: Resolved spectral intermediates by global analysis using a sequential model (A→ B → C). The fitted rate constants were: k1= 0.53 s−1, and k2= 0.07 s−1. The spectrum for A is shown with a solid line, B with a dotted line, and C with a dashed line. (B) Left panel, time course of absorbance at 418 nm during the reaction of PGIS (3 μM) with 15-HPETE (32 to 414 μM). Right panel, plots of kobs for the first phase (filled circles) and the second phase (open circles) of A418 changes versus 15-HPETE concentration.
Spectra of intermediates formed during reaction of TXAS with 15-HPETE were also investigated by rapid-scan stopped-flow spectroscopy. The spectra were collected over 32.8 s after mixing TXAS with a 13-fold molar excess of 15-HPETE at 23°C (Figure 5A). The data were best fitted to a sequential model (A → B → C), with k1= 0.22 s−1 and k2= 0.05 s−1; the spectra of the three species are shown in Fig. 5A, inset. Species B was characterized by a 17% decrease in Soret absorbance, accompanied by a blue-shift from 420 to 416.5 nm, without significant changes in the α and β bands at 572 and 540 nm, respectively. The Soret absorbance of Species C further decreases by 13%, but λmax was unchanged or slightly shifted to 418 nm. However, an α band was not evident in Species C. Stopped-flow reactions monitored at 418 nm were performed for the first 50 s of the reaction, using a range of 15-HPETE concentrations (Fig. 5B, left panel). Two kinetic phases were observed; the rate constant of the first phase was linearly dependent on the 15-HPETE concentrations, whereas the rate constant for the second phase was essentially independent of 15-HPETE concentration (Fig. 5B, right panel). The second-order rate constant and the dissociation rate constant obtained from the plot of kobs versus 15-HPETE concentration were 1100 M−1 s−1 and 0.053 s−1, respectively. The ratio of these two rate constants gives a value of 48 μM, comparable to the observed KM value of 70- 90 μM (Fig. 3). The rate constant of second phase was ∼ 0.03 s−1. These data are consistent with the first phase representing binding and the second step being a catalytic reaction involved in a peroxide bond cleavage. Thus, Species B, with a blue-shifted Soret peak, is a TXAS-15-HPETE complex. Its spectrum is consistent with the blue-shift to 414 nm observed with binding of substrate analog U44069 to TXAS [14]. Identification of Species C is substantiated by previous reports in which the Cpd I of P450 1A2 and P450cam were shown to have their Soret peaks at 389 and 406 nm, respectively [26, 27]. Because TXAS catalyzes 44% heterolytic and 56% homolytic cleavage of 15-HPETE, Species C is likely a mixture of Cpd I (blue-shifted Soret peak) and Cpd II (red-shifted Soret peak). It is thus expected that the Soret peak of Species C is close to 418 nm. Furthermore, because Cpd I of chloroperoxidase has no distinctive α and β bands, we anticipated that Species C lost some of its Q band features (Fig 5A, inset of left panel, dashed line). Our data are consistent with the reaction mechanism in which TXAS catalyzes homolytic and heterolytic cleavages of 15-HPETE, thereby producing Cpd II and Cpd I, respectively. It should also be noted that longer incubation of 15-HPETE with TXAS under pseudo-first order conditions leads to the bleaching of heme, causing irreversible inactivation of TXAS (data not shown), and the rate constant of heme-bleaching is considerably smaller than 0.03 s−1.
Fig.5.

Pre-steady-state kinetics of 15-HPETE catalyzed by TXAS. (A) rapid scan absorbance data at 0.08, 4.18, 8.27, 12.4, 16.5, 20.6, 24.7 and 28.8 s during the reaction of TXAS (4 μM) with 15-HPETE (53 μM). Arrows show the direction of spectral changes with increasing time. Inset: Resolved spectral intermediates from singular value decomposition and global analyses by an irreversible two-step sequential mechanism (A→ B → C) with k1= 0.2 s−1 and k2= 0.05 s−1.
Species A, solid line; species B, dotted line; species C, dashed line. (B) Left panel, time course of absorbance changes at 418 nm during the reaction of TXAS (3.0 μM) with 15-HPETE (27 to 360 μM). Right panel, plots of kobs for the first phase (filled circles) and the second phase (open circles) versus 15-HPETE concentration.
EPR
PGIS or TXAS was manually reacted for 3- 5 s with a 20-fold molar excess of 15-HPETE, and their EPR spectra were then recorded at ∼10 K. Compared with the EPR of resting PGIS and TXAS, the spectra revealed, in addition to nonspecific iron signal at 4.3 and low-spin heme features of un-reacted enzymes, a small signal at g= 2 for both enzymes (Fig 6). Cpd I has an EPR signal at g= 2, whereas Cpd II is EPR silent [28, 29]. For PGIS, approximate 16% of the low-spin heme signals were retained upon reaction with 15-HPETE (solid line vs. dotted line in Fig. 6). The remaining 84% of the heme signal most likely disappeared due to conversion of EPR silent species, consistent with the formation of Cpd II as the predominant intermediate. Similarly, 25% of the TXAS heme signals was retained upon reaction with 15-HPETE (short dashed line vs. long dashed line). The amplitude of g= 2 signal for TXAS is greater than that for PGIS (long dashed line vs. dotted line), consistent with the result that a greater percentage of heterolysis is catalyzed by TXAS than by PGIS. These results supported the scheme that Cpd I was probably produced in the reactions of 15-HPETE with TXAS and, to a lesser extent, with PGIS.
Fig.6.

EPR spectra of PGIS and TXAS (55 μM) before and after reacting with a 20-fold excess of 15-HPETE for 3-5 s at 23°C. EPR conditions were: microwave power, 1 mW; microwave frequency, 9.6 GHz; modulation amplitude, 10.87 G, and temperature, 10 K.
DISCUSSION
It was unexpected that microsomal P450s would react with 15-HPETE to produce mainly epoxyalcohols and not 15-HETE, the main product of heme-containing peroxidases [10]. These peroxidases normally obtain electrons from an exogenous source to restore their resting states. In general, the heme binding site is more exposed to the solvent in peroxidase than in P450. It is therefore plausible that microsomal P450s, in the presence of 15-HPETE, are unable to obtain electrons from a co-substrate; instead, the microsomal P450s obtains electrons from the enzyme intermediate(s). TXAS and PGIS are unable to gain electrons from a co-substrate, as expected if general P450 characteristics are conserved in these two enzymes. Indeed, guaiacol is not consumed by TXAS or PGIS during the reaction with 15-HPETE. Thus, TXAS and PGIS produced epoxyalcohol from 15-HPETE. In this aspect, TXAS and PGIS behave similarly to other microsomal P450s. Nonetheless, TXAS and PGIS can also convert 15-HPETE to 15-KETE and 15-HETE. It is unclear what serves as the source of reductant from which TXAS and PGIS heme moieties regain their electron(s) after the two enzymes are oxidized by 15-HPETE, particularly for the formation of 15-HETE. One possible candidate is an amino acid residue(s) near the heme. This possibility is supported by the observation that a longer incubation with 15-HPETE causes bleaching of the heme, which likely results from irreversible modification by this amino acid radical.
Although the strong electron donating ability of thiolate favors heterolytic cleavage of the O–O bond of hydroperoxides [30], P450s are also capable of catalyzing homolytic cleavage. It appears that the nature of the substrate, active site environment and heme conformation each plays a different role in determining the fate of O–O bond cleavage. The effect of the substrate was exemplified by a series of alkyl constituents of 4-hydroperoxy-4-methyl-2,5-cyclohexadienone reacting with liver microsomes from phenobarbital-treated rats [6]. These studies concluded that the greater the van der Waals volume of the hydroperoxides, the larger the ratio of homolysis/heterolysis. Studies have also shown that the hydrophobic distal site enhances homolytic cleavage. For example, mutation in P450 1A2 of Glu318 or Thr319 to more hydrophobic amino acid residues resulted in a greater extent of homolytic O–O cleavage of cumyl hydroperoxide or tert-butyl hydroperoxide [26]. Collectively, these studies suggested that the hydrophobic distal site and hydrophobic hydroperoxide enhanced homolytic cleavage. Because PGIS produces more homolytic products from 15-HPETE than TXAS does, it is likely that PGIS has a smaller and more hydrophobic active site. Indeed, the active site volume of human PGIS estimated from the crystal structure is about 355 Å3 [31], considerably smaller than most structurally-known microsomal P450s (the TXAS structure is not available at the present). Furthermore, the residues from five substrate recognition sites in PGIS make up a highly hydrophobic environment with only two residues being hydrophilic [31]. “Truth diagram” analysis of heme EPR data indicates that both PGIS and TXAS have similar hydrophobicity in the distal heme pocket [13, 14]; thus, the different volume of the heme pockets in both enzymes may be a more critical determinant for the product profile. As compared to other microsomal P450s, PGIS and TXAS take significant parts in the heterolytic cleavage, a feature of peroxidase reaction. A possible factor that may contribute to this difference between PGIS and microsomal P450s is the planarity of the heme. The PGIS crystal structure (Protein Data Bank (PDB) code: 2IAG) reveals a slightly more distorted heme plane than microsomal P450 members such as CYP2B4, CYP2C5 and CYP2D6 (PDB codes of 1PO5, 1NR6, and 2F9Q, respectively). Based on the observations that the heme plane of peroxidases is usually more distorted than that of P450s [32] and that non-planar heme is easier to oxidize than planar one [33], two-electron oxidation is favored by a non-planar heme. It might partly explain why 15-HETE is synthesized by PGIS. It will be interesting to know if TXAS has a heme plane even more distorted than that of PGIS.
The maximal rate constant, Vmax, of PGIS-catalyzed homolytic cleavage reaction is about 3.5-fold greater than that of the heterolytic cleavage reaction. For TXAS, homolytic cleavage reaction is only slightly faster (∼ 1.4-fold). These data suggest that the two non-classic P450s favor homolytic cleavage of the O–O bond of lipid hydroperoxides, supporting previous caged radical mechanisms [4]. Steady-state and pre-steady state analyses also showed that enzymatic activity with 15-HPETE was greater for PGIS than TXAS. The Vmax values of homolytic and heterolytic cleavage reactions by PGIS are higher than those of TXAS by 23.4- and 9.5-fold, respectively. Similarly, stopped-flow measurements showed the rate of O–O bond cleavage for PGIS was at least 27-fold faster than TXAS. However, the KM values are very close for PGIS(∼60 μM of 15-HPETE) and TXAS-catalyzed (∼80 μM of 15-HPETE) reactions, making PGIS a more efficient catalyst for 15-HPETE reaction, owing to its facile homolytic cleavage mechanism. It is unclear why PGIS is more efficient than TXAS in this aspect. Despite many years of intensive efforts to understand the iron-oxo intermediates of heme-containing enzymes [34, 35], their reactivities still remain an active subject, particularly in P450s whose iron-oxo species are very unstable. It seems that the features of P450 intermediates depend on a great number of small differences in structure from one protein to another. Recently, a Cpd I of Fe(IV)=O complexed with an amino acid radical was identified in P450cam and P450BM3 upon reaction with peracetic acid or m-chloroperbenzoic acid [36, 37]. We also observed that the reaction of PGIS with peracetic acid produced a metastable intermediate with spectral features similar to Cpd I (Yeh and Wang, unpublished results), indicating that both Cpd I and Cpd II can be major intermediates for PGIS. As we mentioned above, subtle differences in the heme pocket volume and heme geometry could be factors that steer the product profile in different directions. More studies are needed to gain better understanding of this critical issue.
In summary, when reacting with PGIS, 15-HPETE undergoes predominantly homolytic cleavage, thus displaying an intermediate of red-shifted Soret peak. In contrast, TXAS catalyzes a comparable percentage of homolytic and heterolytic cleavages. The Soret peak does not change much. Scheme II summarizes the reaction mechanism of 15-HPETE catalyzed by PGIS and TXAS. The initial step is the binding of 15-HPETE to the enzyme, a step that occurs faster with PGIS than in TXAS. The substrate complex has two possible fates: either one-electron transfer from Fe(III) to produce Cpd II and alkoxyl radical or two-electron oxidation of Fe(III) to yield Cpd I and 15-HETE. An alkoxyl radical either donates an electron to form 15-KETE or undergoes isomerization to form an epoxyallylic radical, which is subsequently oxidized by Cpd II to synthesize epoxyalcohol. Cpd I and II are potential potent intermediates leading to inactivation.
Scheme II.

Supplementary Material
ACKNOWLEDGEMENTS
This work was supported by National Institutes of Health grants HL60625 (L.-H. W.) and GM44911 (A.-L. T.). We thank Dr. Jinn-Shyan Wang for helpful advice on preparing 15-HPETE, Dr. Richard J. Kulmacz for valuable suggestions and Mr. Huanyi Chu at the University of Houston for mass spectroscopy of 13-OH-14,15-EET.
Footnotes
The abbreviations used are: PGIS, prostacyclin synthase; PGI2, prostacyclin; PGHS, prostaglandin H synthase; TXAS, thromboxane synthase; TXA2, thromboxane A2; 15-HPETE,15-hydroperoxyeicosatetraenoic acid; 15-HETE, 15-hydroxyeicosatetraenoic acid; 15-KETE, 15-ketoeicosatetraenoic acid; 13-OH-14,15-EET, 13-hydroxy-14,15-epoxy-5,8,11-eicosatrienoic acid; ESI/MS, electron-spray ionization/ mass spectrometry; EPR, electron paramagnetic resonance; SVD, singular value decomposition.
Publisher's Disclaimer: This is a PDF file of an unedited manuscript that has been accepted for publication. As a service to our customers we are providing this early version of the manuscript. The manuscript will undergo copyediting, typesetting, and review of the resulting proof before it is published in its final citable form. Please note that during the production process errors may be discovered which could affect the content, and all legal disclaimers that apply to the journal pertain.
REFERENCES
- 1.Haurand M, Ullrich V. J Biol Chem. 1985;260:15059–15067. [PubMed] [Google Scholar]
- 2.Ullrich V, Castle L, Weber P. Biochem Pharmacol. 1981;30:2033–2036. doi: 10.1016/0006-2952(81)90218-5. [DOI] [PubMed] [Google Scholar]
- 3.Needleman P, Turk J, Jakschik BA, Morrison AR, Lefkowith JB. Annu Rev Biochem. 1986;55:69–102. doi: 10.1146/annurev.bi.55.070186.000441. [DOI] [PubMed] [Google Scholar]
- 4.Hecker M, Ullrich V. J. Biol. Chem. 1989;264:141–150. [PubMed] [Google Scholar]
- 5.Hersleth HP, Ryde U, Rydberg P, Gorbitz CH, Andersson KK. J Inorg Biochem. 2006;100:460–476. doi: 10.1016/j.jinorgbio.2006.01.018. [DOI] [PubMed] [Google Scholar]
- 6.Correia MA, Yao K, Allentoff AJ, Wrighton SA, Thompson JA. Arch Biochem Biophys. 1995;317:471–478. doi: 10.1006/abbi.1995.1190. [DOI] [PubMed] [Google Scholar]
- 7.McCarthy MB, White RE. J. Biol. Chem. 1983;258:11610–11616. [PubMed] [Google Scholar]
- 8.Thompson J, Wand M. J. Biol. Chem. 1985;260:10637–10644. [PubMed] [Google Scholar]
- 9.Kuhn H. Prog Lipid Res. 1996;35:203–226. doi: 10.1016/s0163-7827(96)00008-2. [DOI] [PubMed] [Google Scholar]
- 10.Weiss RH, Arnold JL, Estabrook RW. Arch Biochem Biophys. 1987;252:334–338. doi: 10.1016/0003-9861(87)90039-7. [DOI] [PubMed] [Google Scholar]
- 11.Chang MS, Boeglin WE, Guengerich FP, Brash AR. Biochemistry. 1996;35:464–471. doi: 10.1021/bi952081v. [DOI] [PubMed] [Google Scholar]
- 12.Kulmacz RJ, Palmer G, Wei C, Tsai AL. Biochemistry. 1994;33:5428–5439. doi: 10.1021/bi00184a011. [DOI] [PubMed] [Google Scholar]
- 13.Yeh HC, Hsu PY, Wang JS, Tsai AL, Wang LH. Biochim Biophys Acta. 2005;1738:121–132. doi: 10.1016/j.bbalip.2005.11.007. [DOI] [PMC free article] [PubMed] [Google Scholar]
- 14.Hsu P-Y, Tsai A-L, Kulmacz RJ, Wang L-H. J. Biol. Chem. 1999;274:762–769. doi: 10.1074/jbc.274.2.762. [DOI] [PubMed] [Google Scholar]
- 15.Cosme J, Johnson EF. J Biol Chem. 2000;275:2545–2553. doi: 10.1074/jbc.275.4.2545. [DOI] [PubMed] [Google Scholar]
- 16.Landino LM, Marnett LJ. Biochemistry. 1996;35:2637–2643. doi: 10.1021/bi952546h. [DOI] [PubMed] [Google Scholar]
- 17.Baldwin DA, Marques HM, Pratt JM. J Inorg Biochem. 1987;30:203–217. doi: 10.1016/0162-0134(87)80064-8. [DOI] [PubMed] [Google Scholar]
- 18.Scott EE, He YA, Wester MR, White MA, Chin CC, Halpert JR, Johnson EF, Stout CD. Proc Natl Acad Sci U S A. 2003;100:13196–13201. doi: 10.1073/pnas.2133986100. [DOI] [PMC free article] [PubMed] [Google Scholar]
- 19.Williams PA, Cosme J, Vinkovic DM, Ward A, Angove HC, Day PJ, Vonrhein C, Tickle IJ, Jhoti H. Science. 2004;305:683–686. doi: 10.1126/science.1099736. [DOI] [PubMed] [Google Scholar]
- 20.Wang L-H, Tsai A-L, Hsu P-Y. J. Biol. Chem. 2001;276:14737–14743. doi: 10.1074/jbc.M009177200. [DOI] [PubMed] [Google Scholar]
- 21.Bryant RW, Bailey JM. Prog Lipid Res. 1981;20:279–281. doi: 10.1016/0163-7827(81)90055-2. [DOI] [PubMed] [Google Scholar]
- 22.Henke D, Danilowicz RM, Curtis JF, Boucher RC, Eling TE. Arch Biochem Biophys. 1988;267:426–436. doi: 10.1016/0003-9861(88)90048-3. [DOI] [PubMed] [Google Scholar]
- 23.Dix T, Marnett L. J. Biol. Chem. 1985;260:5351–5357. [PubMed] [Google Scholar]
- 24.Song W, Baertschi S, Boeglin W, Harris T, Brash A. J. Biol. Chem. 1993;268:6293–6298. [PubMed] [Google Scholar]
- 25.Egawa T, Proshlyakov DA, Miki H, Makino R, Ogura T, Kitagawa T, Ishimura Y. J Biol Inorg Chem. 2001;6:46–54. doi: 10.1007/s007750000181. [DOI] [PubMed] [Google Scholar]
- 26.Shimizu T, Murakami Y, Hatano M. J Biol Chem. 1994;269:13296–13304. [PubMed] [Google Scholar]
- 27.Spolitak T, Dawson JH, Ballou DP. J Biol Chem. 2005;280:20300–20309. doi: 10.1074/jbc.M501761200. [DOI] [PubMed] [Google Scholar]
- 28.Davydov R, Kofman V, Fujii H, Yoshida T, Ikeda-Saito M, Hoffman BM. J Am Chem Soc. 2002;124:1798–1808. doi: 10.1021/ja0122391. [DOI] [PubMed] [Google Scholar]
- 29.Erman JE, Vitello LB, Mauro JM, Kraut J. Biochemistry. 1989;28:7992–7995. doi: 10.1021/bi00446a004. [DOI] [PubMed] [Google Scholar]
- 30.Sono M, Roach MP, Coulter ED, Dawson JH. Chem Rev. 1996;96:2841–2888. doi: 10.1021/cr9500500. [DOI] [PubMed] [Google Scholar]
- 31.Chiang C-W, Yeh H-C, Wang L-H, Chan N-L. J Mol Biol. 2006;364:266–274. doi: 10.1016/j.jmb.2006.09.039. [DOI] [PMC free article] [PubMed] [Google Scholar]
- 32.Jentzen W, Ma JG, Shelnutt JA. Biophys J. 1998;74:753–763. doi: 10.1016/S0006-3495(98)74000-7. [DOI] [PMC free article] [PubMed] [Google Scholar]
- 33.Kadish KM, Caemelbecke EV, D'Souza F, Medforth CJ, Smith KV, Tabard A, Guilard R. Inorg Chem. 1995;34:2984–2989. [Google Scholar]
- 34.Groves JT. J Inorg Biochem. 2006;100:434–447. doi: 10.1016/j.jinorgbio.2006.01.012. [DOI] [PubMed] [Google Scholar]
- 35.Harvey JN, Bathelt CM, Mulholland AJ. J Comput Chem. 2006;27:1352–1362. doi: 10.1002/jcc.20446. [DOI] [PubMed] [Google Scholar]
- 36.Jung C, Schunemann V, Lendzian F. Biochem Biophys Res Commun. 2005;338:355–364. doi: 10.1016/j.bbrc.2005.08.166. [DOI] [PubMed] [Google Scholar]
- 37.Makris TM, von Koenig K, Schlichting I, Sligar SG. J Inorg Biochem. 2006;100:507–518. doi: 10.1016/j.jinorgbio.2006.01.025. [DOI] [PubMed] [Google Scholar]
Associated Data
This section collects any data citations, data availability statements, or supplementary materials included in this article.