

Abstract
When listening to two tones at frequency f1 and f2 (f2>f1), one can hear pitches not only at f1 and f2 but also at distortion frequencies f2-f1, (n+1)f1−nf2, and (n+1)f2−nf1 (n=1,2,3…). Such two-tone distortion products (DPs) also can be measured in the ear canal using a sensitive microphone. These ear-generated sounds are called otoacoustic emissions (OAEs). In spite of the common applications of OAEs, the mechanisms by which these emissions travel out of the cochlea remain unclear. In a recent study, the basilar membrane (BM) vibration at 2f1-f2 was measured as a function of the longitudinal location, using a scanning laser interferometer. The data indicated a forward traveling wave and no measurable backward wave. However, this study had a relatively high noise floor and high stimulus intensity. In the current study, the noise floor of the BM measurement was significantly decreased by using reflective beads on the BM, and the vibration was measured at relatively low intensities at more than one longitudinal location. The results show that the DP phase at a basal location leads the phase at an apical location. The data indicate that the emission travels along the BM from base to apex as a forward traveling wave, and no backward traveling wave was detected under the current experimental conditions.
Keywords: Basilar membrane, Traveling wave, Otoacoustic emission, Distortion products, Laser interferometer
1. Introduction
When two tones at frequency f1 and f2 (f2>f1) are presented to the ear, a person with normal hearing can hear pitches at frequencies f2-f1, (n+1)f1−nf2, and (n+1)f2−nf1 (n=1,2,3,…). These two-tone distortion products (DPs) have been extensively studied by psychophysicists (Goldstein, 1967; Hall, 1972; Smoorenburg, 1972). Psychophysical evidence indicating that the cubic combination tone at frequency 2f1-f2 should originate in the cochlea (Goldstein, 1967; Siegel et al., 1982; Smoorenburg, 1972) is supported by the presence of DPs in cochlear microphonics (Gibian et al., 1982), at the inner hair cells (Nuttall et al., 1990a), and in auditory nerve responses (Goldstein et al., 1968; Kim et al., 1980; Siegel et al., 1982). Kemp demonstrated that the cubic DPs at 2f1-f2 frequency can be measured in the external ear canal using a sensitive microphone (Kemp, 1979). These intra-cochlearly-generated sounds are termed otoacoustic emissions (OAEs), and OAEs at frequencies of two-tone DPs are termed distortion product otoacoustic emissions (DPOAEs). Direct experimental demonstration of the cochlear origin of OAEs has been provided by measurements of basilar membrane (BM) vibration and intracochlear pressure. DPs have been demonstrated to exist at the BM in a number of subsequent studies (Cooper et al., 1997; Cooper et al., 2004; Narayan et al., 1998; Nuttall et al., 1990b; Ren, 2004; Rhode et al., 1993; Robles et al., 1990; Robles et al., 1991; Robles et al., 1997; Siegel et al., 2005). Intracochlear pressure measurements (Avan et al., 1998; Dong et al., 2005; Magnan et al., 1997) demonstrated DP presence in the cochlear fluids.
Since Kemp (1979) discovered the DPOAE, it has been increasingly used clinically as a non-invasive tool for detecting auditory disorders and for measuring cochlear mechanical properties (Lonsbury-Martin et al., 1991; Probst, 1990). However, the application of the DPOAE has been limited due to lack of understanding of its generation mechanisms.
Regarding how the OAE propagates backward from its generation site to the cochlear base, there are two different theories in the literature. The prevailing view is that the emission reaches the cochlear base through a backward traveling wave, a slow-propagating transverse wave, along the BM (Kemp, 1986; Knight et al., 2001; Shera et al., 1999; Tubis et al., 2000). A completely different view is that the emission propagates to the cochlear base via the cochlear fluids as a compression wave, a longitudinal wave (Avan et al., 1998; Ren, 2004; Robles et al., 1997; Ruggero, 2004; Siegel et al., 2005; Vetesnik et al., 2006; Wilson, 1980). Using a scanning interferometer, Ren (2004) measured the magnitude and phase of BM vibration at the emission frequency as a function of the longitudinal location. Data showing that the DP phase decreases with distance from the cochlear base are consistent with that the BM vibration at 2f1-f2 is dominated by a forward traveling wave. However, due to the extremely low reflectivity of the cochlear partition (Khanna et al., 1989), the noise floor was relatively high. It was not possible to measure small backward traveling waves below the noise floor. In the current study, the noise floor of BM vibration measurement was decreased by the application of reflective beads, and the vibration at 2f1-f2 was measured at more than one longitudinal location. The data show that the BM vibration at 2f1-f2 reaches the basal location earlier than the apical location, confirming a forward traveling wave at the DP frequency.
2. Materials and methods
2.1. Animal preparation and measurement of BM vibration
Thirty-two young healthy Mongolian gerbils (40–80 g) were used in this study. Animal preparation and surgical approach were the same as in previous studies (Ren, 2002; Ren, 2004). Briefly, under adequate anaesthesia, the animal’s head was firmly fixed on a head holder, and body temperature was maintained at 38±1°C with a servo-regulated heating blanket. A tracheotomy was performed, and a ventilation tube was inserted into the trachea to ensure normal breathing. The left auditory bulla was exposed through a ventrolateral surgical approach. After the round window membrane was removed, several gold-coated glass beads (~20 μm diameter) were placed on the BM at different longitudinal locations with best frequencies (BFs) from 14 to 22 kHz. The radial location of the beads was approximately at the second row of outer hair cells. Since free fall of the beads made it difficult to place them precisely at useful locations, desired bead positions were achieved by appropriately adjusting the angle of the animal’s head and controlling the entering point of the beads into the perilymph. After the round window was covered using a thin glass cover slip to eliminate the optical distortion due to the meniscus formed by the cochlear fluids, the laser beam of a heterodyne laser interferometer (OFV 3000S, Polytec, Inc. Germany) was focused on the beads on the BM through a custom-made upright microscope. The voltage output of the laser interferometer was proportional to the velocity of the transverse vibration of the bead. Beads have been shown to accurately follow the BM vibration (Cooper, 1999). The noise floor of the measurement is ~0.1 μm/s, which is about 20 dB below the noise floor of measurement without using reflective beads (Ren, 2004). The BF of the observed location was determined as the frequency with the maximum amplitude in the magnitude transfer function at 30 dB SPL (0 dB SPL=20 μPa). The magnitude transfer function was measured as the ratio of the BM and stapes velocities as a function of the frequency. The phase transfer function is the phase difference between the stapes and the BM vibration as a function of frequency.
Cochlear sensitivity was monitored by measuring the cochlear compound action potential (CAP) using the previously described method (Ren, 2002). The CAP threshold was measured before and after data collection. A cochlea with less than 8 dB threshold elevation at 18 kHz was considered a sensitive preparation.
Animal protocols were approved by the Oregon Health & Science University Institutional Animal Care and Use Committee.
2.2. Signal generation and data acquisition
A LabView-based (National Instruments, Austin, TX) program was used to control TDT hardware (System II, Tucker-Davis Technologies, Gainesville, Florida) for signal generation and data acquisition. Simultaneous tone bursts at f1 and f2 with 23 ms duration and 1 ms rise/fall time were generated by a D/A converter (DA3-4). The signals were connected to a dual-channel headphone buffer (HB6) through two programmable attenuators (PA4) and then used to drive two earphones (ER-2 Etymotic Research, Inc. Elk Grove Village, IL). High-frequency responses of the ER-2 earphones were improved by removing resonant chambers and directly coupling the transducers to the stainless steel tubes of the microphone. A sensitive microphone (10 B+ Etymotic Research, Inc. Elk Grove Village, IL) was used to measure the sound pressure in the ear canal. The microphone-earphone probe was coupled into the external ear canal to form a closed sound field. The signals from the microphone and the interferometer were digitized and averaged 10 to 40 times, depending on the signal level. The magnitude and phase of the average signal at different frequencies and intensities were obtained through a Fourier transform. For presentation clarity, the data were smoothed with the Binomial smoothing function using Igor software (Wavemetrics, Inc., Lake Oswego, OR). This smoothing operation is a Gaussian filter, and its algorithm was derived from a paper by Marchand and Marmet (1983).
2.3. Delay measurements
Sound pressure in the ear canal and the vibration at different longitudinal locations on the BM and on the stapes were measured as a function of the emission frequency. Frequency of 2f1-f2 was varied by changing f1 in 200 Hz steps when f2 was fixed, resulting in a 2f1-f2 change in 400 Hz steps. In order to position the emission-generation sites at the apical side of the observed location, f2 was equal to or smaller than BF of the observed location except for the data in Fig. 1. Magnitude and phase of sound pressure and vibration at frequencies f1, f2, and 2f1-f2 were measured. Group delays were derived from the phase transfer functions. Phase refers to the electrical signals, which drive the speakers. The attenuator and earphone buffer introduced no significant delay. Group delays were calculated based on the fitted functions of the phase data, according to the equation: D = Δφ/Δω, where D is the group delay in seconds and Δφ is the phase difference in radians over the angular frequency change Δω. For calculating the distance between two beads (d), the x, y, and z coordinates were measured using a positioning system consisting of a controller (ESP300) and three motorized linear translation stages (MFN25CC) (Newport Co. Irvine, CA). The distance d was calculated using the equation
Fig. 1.

Magnitude (A) and phase (B) responses at 2f1-f2 in a sensitive cochlea (solid lines) and an insensitive cochlea (dotted lines), and the magnitude and phase transfer functions at different sound pressure (panels C and D). Data were measured from the same longitudinal location. Dramatic difference between the results in the sensitive preparation and those under post-mortem conditions show that the observed emission response of the BM is closely related to cochlear sensitivity. The magnitude response peaks at 2f1-f2 in panel A are very similar to the BF (15 kHz) shown in panel C.
where Xa, Ya, Za, Xb, Yb, and Zb are the x, y, and z coordinates at locations a and b. For some animals, data were collected from more than two longitudinal locations.
3. Results
Due to the invasive nature of the cochlear surgeries, the vulnerability of sensitive hearing at high frequencies, and time-consuming data acquisition, productivity of this experiment is low. Fifteen of thirty-two animals showed more than 8 dB CAP threshold elevation at18 kHz before data were collected, indicating an insensitive preparation. Only six animals retained less than 8 dB hearing loss at 18 kHz after data collection. The data presented below are from these sensitive preparations.
In order to show the reliability of the experimental method and the relationship between the DP responses and BM transfer functions, the magnitude and phase of the BM vibration were measured in four animals as a function of the 2f1-f2 frequency under the sensitive condition and more than 5 minutes post-mortem. A comparison of sensitive to insensitive data is shown in Fig. 1. Solid lines in Fig. 1A show the magnitude of the BM vibration at 2f1-f2 at f1 intensities of 40, 50, 60, and 70 dB SPL. The f2 (17 kHz) intensities were 5 dB below the f1 level. Stimulation levels in the following text are described using only f1 levels. For a given intensity, the magnitudes increase when the 2f1-f2 increases or the f2/f1 decreases. The magnitude response peak is approximately at 15 kHz, which coincides with the BF of the measured location. This is confirmed by the magnitude transfer functions of the BM in Fig. 1C. At intensities below 50 dB SPL, the BM magnitude transfer functions show an overall peak at approximately 15 kHz, i.e., the BF. As the sound pressure increases, the response peaks shift to the low frequency side, and the response magnitudes decrease. These features indicate the sensitive condition of the preparation. The intermediate plateau in the higher intensity curves is not typical among other preparations. Magnitudes in Fig. 1C are significantly smaller than those in the literature (Robles and Ruggero, 2001). This difference is likely due to the magnitude difference of measured stapes vibrations, which depend on the accessing angle and location of the laser beam. The corresponding phase transfer functions are presented in Fig. 1D and show a slight level-dependent phase change. At frequencies above the BF of 15 kHz, the phase increases with sound pressure, denoting an increase in propagation velocity of the BM vibration, which is consistent with the level-dependent spatial pattern of the cochlear traveling wave in sensitive ears (Ren, 2002). Since f2 (17 kHz) is greater than the BF of the measured location (~15 kHz), the observed location is on the apical side of the DP generation site. Fig. 1A shows that predominant responses occurred at f2/f1 ratios below 1.26. Above the f2/f1 of 1.26, the magnitude is close to the noise floor (~0.1 μm/s). The magnitude response pattern is likely determined by the spatial patterns of f1 and f2 traveling waves, their spatial relationship, and the tuning of the BM at the observed location. This interpretation is largely consistent with a recent study (Dong et al., 2005), in which the pattern of the DP response in the intracochlear pressure is determined by the filtering function of the primary tones, the DP generation, and the BM location. In the insensitive cochlea, the magnitude responses of the BM vibration at the DP frequency are near the noise floor (~0.1 μm/s) (dotted line in Fig. 1A). In the sensitive preparation, phase responses (solid lines in Fig. 1B) show negative slopes. The slope of the phase-frequency curves indicates the group delay of the BM responses. This group delay should be determined by the delay from the speakers to the stapes and by the forward delay in the cochlea. The former includes the delays of the acoustic probe, the ear canal, and the middle ear (Ren et al., 2006). The regular phase pattern (solid line) becomes random post-mortem (dotted line in Fig. 1B).
The magnitude and phase responses of the BM measured from two longitudinal locations are presented in Fig. 2. Fig. 2A and B show data measured from the apical bead, Fig. 2C and D from the basal bead. The distance between the two beads is ~109 μm, and the longitudinal location of the basal bead is ~ 2,400 μm from the cochlear base. The BFs of the two locations are approximately 17.0 kHz for the apical bead (solid line) and 18.5 kHz for the basal bead, as shown in Fig 3A. The amplitude transfer functions were measured at 30 dB SPL. The phase transfer function in Fig. 3B shows that for a given frequency, the phase of the basal bead leads the phase of the apical bead, indicating that the BM vibration propagates through the observed region from base to apex.
Fig. 2.

Magnitude and phase responses of the BM as a function of the 2f1-f2 frequency from two longitudinal locations. Panels A and B are measured from the apical bead, and panels C and D are from the basal bead. The distance between the beads is 109 μm. In panels A and C, across different intensities, the vibration magnitude increases with 2f1-f2, reaching a maximum where 2f1-f2 approaches f2 or 2f1/f2 is close to one. In panel A, at frequencies near f2, the separation between the curves is significantly smaller than the intensity increment of 10 dB, revealing a nonlinear growth. Phase-frequency curves in Fig. 2B and D show negative slopes. Above 10 kHz, the phase shows a linear relationship to the 2f1-f2 frequency.
Fig. 3.
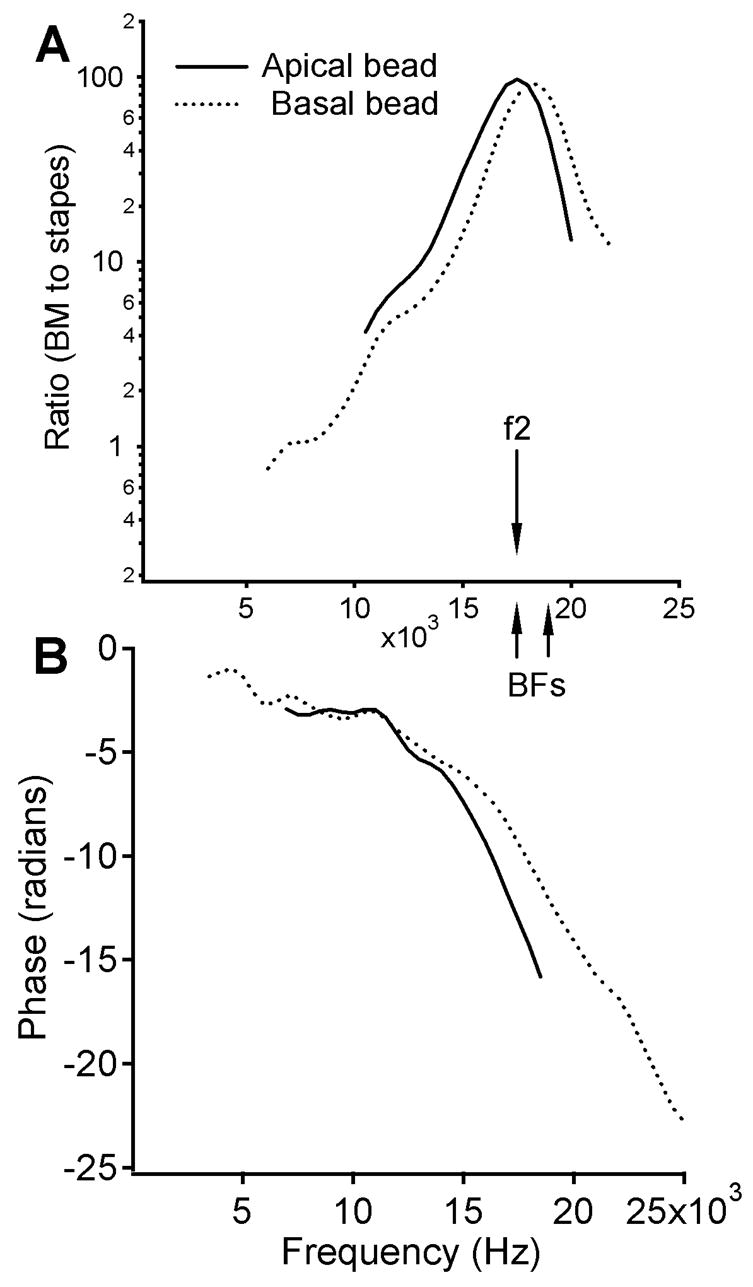
Magnitude and phase transfer functions of the BM measured at 30 dB SPL from same two longitudinal locations as for data in Fig. 2. The arrows in panel A show the relationship between the f2 and the BFs. Panel A shows that BFs of two locations are approximately 17.0 kHz for the apical bead (solid line) and 18.5 kHz for the basal bead (dotted line). The phase transfer function in panel B shows that for a given frequency the phase of the basal bead leads the phase of the apical bead, which indicates a forward traveling wave.
Fig. 2A and B present the magnitude and phase of the BM vibration as a function of 2f1-f2 at the apical location at intensities of 40 (dash-dot line), 50 (dashed line), 60 (dotted line), and 70 dB SPL (solid line). Across different intensities, the vibration magnitude increases with 2f1-f2, reaching a maximum where 2f1-f2 approaches f2 or f2/f1 is close to one. In panel A, at frequencies near f2, the separation between the curves is significantly smaller than the intensity increment of 10 dB, revealing a nonlinear growth. These features, and the solid line in Fig. 3A, indicate that the data in Fig. 2A and B were measured approximately at the f2 (17 kHz) location.
Magnitude and phase responses of the basal bead at 2f1-f2 are presented in Fig. 2C and D. At 60 and 70 dB SPL, the magnitude also increases as a function of 2f1-f2 and reaches a maximum where 2f1-f2 approaches f2 or the f2/f1 is close to one. The dotted line in Fig. 3A shows a BF of 18.5 kHz, indicating that the data in Fig. 2C and D were collected from the longitudinal location basal to the f2 (17 kHz) site.
Phase-frequency curves in Fig. 2B and D show negative slopes. Above 10 kHz, the phase clearly shows a linear relationship to the 2f1-f2 frequency. This linear phase behavior indicates that the group delay can be reliably derived from the phase-frequency data. In Fig. 2D, phase responses at frequencies below 8.2 kHz and at the level of 40 dB SPL are not shown, due to poor signal-to-noise ratio at this location.
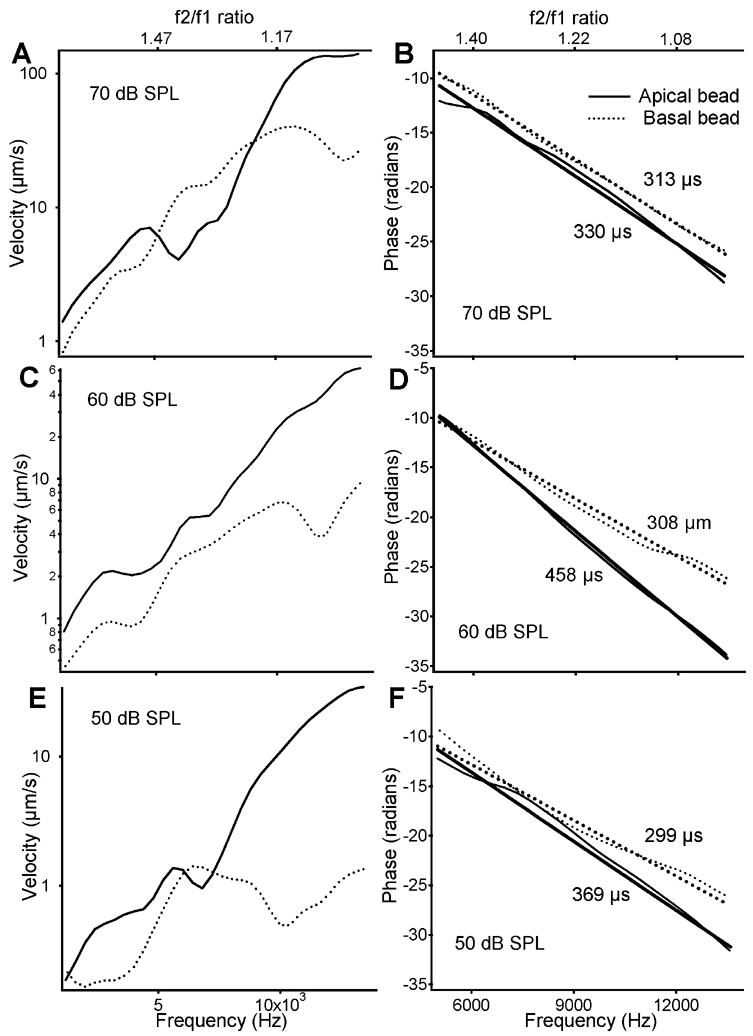
Because of the dominating magnitude response and linear phase behavior at frequencies above 10 kHz, the group delay was calculated from the phase data above 10 kHz and is presented in Fig. 4. The magnitude and phase responses of the apical bead (solid lines) at different intensities and those measured from the basal bead (dotted lines) are presented in Fig. 4. At a given intensity, the pattern of the magnitude-frequency curves is very similar, while the response of the basal bead is significantly smaller than that of the apical bead (Fig. 4A, C, and E). Phase responses and their linear regression lines from two locations are plotted in Fig. 4B (70 dB SPL), D (60 dB SPL), and F (50 dB SPL). These plots clearly show that the phase slopes of the apical bead (solid lines) are significantly steeper than those of the basal bead (dotted lines). Group delays derived from the phase slopes show that the group delay of the apical bead is greater than at the basal bead location. Thus, Fig. 4B, D, and F show that the group delay of the BM vibration at an apical location is greater than at a location basal to it, indicating a forward rather than a backward traveling wave.
Fig. 4.

Magnitude and phase comparison between the apical bead (solid lines) and basal bead (dotted lines) responses at different intensities. The patterns of magnitude response across intensities are very similar while response of the apical bead is significantly greater than that of the basal bead. Because of the dominating magnitude responses and linear phase behavior at frequencies above 10 kHz, the group delay was calculated at frequencies above 10 kHz. The phase slopes show that at a given intensity, the group delay of the apical-bead location is greater than that at the basal location. For a given location, the group delay decreases with intensity.
In order to confirm the findings presented in Fig. 2, 3, and 4, BM vibration was measured at the emission frequency from two locations with a relatively large separation from a different sensitive preparation. Data presented in Fig. 5, 6, and 7 were collected from two longitudinal locations in the basal turn, with a separation of ~366 μm. The BF of the apical bead location is approximately 14 kHz (solid) and that of the basal bead 19 kHz (dotted line), as shown in Fig. 6A. An f2 of 14 kHz was used for the data in Fig. 5 and 7. Thus, the apical bead is at the f2 place and the basal bead is distant from the f2 place, toward the base. Data in Fig. 5 and 7 are very similar to those in Fig. 2 and 4 except for a greater difference in phase slope in Fig. 7B, D, and F than in Fig. 4. Allowing for variation across animals, Fig. 7B, D, and F also show that the group delay at the apical location is greater than that of the basal location.
Fig. 5.

Magnitude and phase responses of the BM as a function of the 2f1-f2 frequency from two different longitudinal locations with a separation of ~366 μm. Data are similar to those in Fig. 2 but are from a different animal. In panels A and C, magnitude increases with 2f1-f2, with a maximum at the high frequency side indicating that these observed locations are at or basal to the f2 place. Data in this figure are very similar to those in Fig. 2, except for a greater difference in phase slope in panels B and D than in Figs. 2B and 2D.
Fig. 6.

Magnitude and phase transfer functions of the BM measured at 30 dB SPL from the same two longitudinal locations as for data in Fig. 5. The arrows in panel A show the relationship between the f2 and the BFs. The BFs of two locations are approximately 14 kHz for the apical bead (solid line) and 19 kHz for basal bead (dotted line) shown in panel A. The phase transfer function in panel B shows that the phase of the basal bead leads the phase of the apical bead, indicating a forward traveling wave.
Fig. 7.
Comparison between the apical bead (solid lines) and basal bead (dotted lines) responses at different intensities. The phase slopes also show that the delay of the apical bead is greater than the basal-bead delay. Thus, panels B, D, and F are also consistent with a forward traveling wave at the emission frequency.
Delay difference between two observed locations was obtained by subtracting the delay at a basal location from that at an apical location in six sensitive preparations and is presented in Fig. 8A. Data were collected at 14 to 22 kHz BF locations and with f2 frequencies of 12 to 16 kHz. For a given cochlea, both observed locations are basal to the f2 BF site. Due to the low signal to noise ratio, data at 40 dB SPL were not included in Fig. 8. In panel A, a positive value indicates a forward propagation, and a negative value suggests a backward wave. All data points are above the zero (dotted line) supporting that BM vibrations at 2f1-f2 frequencies propagate toward the apex. The velocity of the forward propagating wave (v) was calculated from the distance (l) and delay difference (t) between two beads according to equation v = l/t, where v is in meter per second (m/s), l is in meter (m), and t is in second (s). Most velocity values range from 1 m/s to 10 m/s, which apparently is smaller than the velocity derived from the wavelength measured by Olson (1999) using a pressure sensor. In addition to methodological difference, there is a possibility that a DP forward travelling wave is slower that a single tone-induced forward wave due to the interaction with primary tones. Relatively wide distributions of data points in panels A and B likely result from difference in measured locations, f2 frequencies, and primary intensities across the animals.
Fig. 8.

Delay difference (A) and traveling wave velocity (B) as a function of the distance between the beads. Data were derived from the phase values of two beads at two longitudinal locations in six animals. Positive delays from a basal location to an apical location in panel A indicate forward propagation. Most velocity values are between 1 to 10 m/s.
4. Discussion
In a previous study (Ren, 2004), the phase-location data showed a forward traveling wave but no backward traveling wave could be detected using a scanning interferometer. According to the backward traveling wave theory, the backward traveling wave exists only in the region from its generation location (near f2) to the cochlear base. To detect this hypothetical backward traveling wave at a basal cochlear location far from its generation site, the generation location was moved apically by using a low f2 (12 kHz) (Fig. 1D, Ren, 2004). This attempt failed to detect the putative backward traveling wave. Due to the extremely low reflectivity of the cochlear partition (Khanna et al., 1989), the noise floor using a scanning interferometer was significantly higher than that with a fixed-point measurement using reflective beads. The noise floor of the BM measurement using a scanning interferometer was ~1 μm/s (Ren, 2002, 2004), which is approximately 20 dB above that of the measurement using a reflective bead (Robles et al., 2001). Only primary-tone intensities at or above 60 dB SPL were used for the spatial pattern measurement of the BM vibration (Ren, 2004). Thus, scanning interferometry cannot detect a backward traveling wave with a transverse velocity less than 1 μm/s, which may exist with primary-tone intensity below 60 dB SPL.
In order to explore the above possibility in this study, the BM vibration at 2f1-f2 was measured at more than one longitudinal location on the BM. The use of gold-coated reflective beads dramatically increased the carrier signal of the interferometer, which in turn resulted in a significantly lower noise floor. Postmortem data in Fig. 1A show that the noise floor of the measurement was ~0.1 μm/s. The lower noise floor made it possible to measure the DPs on the BM at primary-tone intensities as low as 40 dB SPL.
Although phase measured as a function of the frequency from a single longitudinal location provides information on the group delay, it carries no information on the wave propagation direction. The phase relationship between two positions, however, shows the propagation direction of the BM vibration. The data in Figs. 4, 7, and 8 show the phase of the BM vibration at a basal location leading the phase at an apical location and a smaller group delay at the basal location than at the apical location. This finding shows that the BM vibration arrives at the basal location earlier than at the apical location, indicating a forward traveling wave. These data are consistent with a previous study (Ren, 2004), in which the author measured the BM vibration as a function of longitudinal location and could not detect the expected the expected backward traveling wave. Since the noise floor in this study is significantly lower than when using laser-scanning interferometry, this study extends the above scanning-interferometry finding into relatively low intensities, i.e., there is no measurable backward traveling wave at the primary-tone intensities as low as 40 dB SPL.
A critical requirement for detecting the backward travelling wave is that measurement locations of the BM vibration be at longitudinal locations basal to the emission generation site. This condition was achieved by measuring the BM vibration at a location with a BF above f2. The magnitude transfer functions presented in Fig. 3 and 6 confirm that the data in Fig. 4 and 7 are measured from a cochlear location basal to the f2 site, where the backward traveling wave should exist. Due to the very restricted spatial distribution of the traveling wave in a sensitive cochlea (Ren, 2002), there is a practical limitation on how far from the f2 site the BM vibration can be measured. Magnitude responses in Fig. 2E and Fig. 5E show that the location of the basal beads in these two animals is already so far to the base that responses at low intensities fell into the noise floor. Although the longitudinal extent of the DP generation site has not been measured experimentally it must be a distributed source rather than a simplified point source. One may argue that the observed group delay is due to the propagation of the primary tones instead of being due to propagation of the DP, i.e., the DP is generated at the measured location. If this is true, the DP group delay at the BM should be smaller than that at the stapes. However, it was found that the DP group delay at the stapes is smaller than that on the BM (Fig. 2D, Ren, 2004).
For measuring the group delay of the DPOAE, it is necessary to vary the emission frequency. The 2f1-f2 emission frequency has been varied using two different methods. One is to vary f1 when f2 is constant; the other is to vary f2 when f1 is fixed. Due to the frequency-location map (Greenwood, 1990), varying either f1 or f2 results in a change in the DP generation site. This location change causes the emission phase to change, since it is determined by the f1 and f2 phases, which are dependent on the longitudinal location. Because the longitudinal extent of a traveling wave at a high frequency is more restricted than at a lower frequency (Ren, 2002), varying f2 likely causes more change in the DP phase than varying f1. This speculation is consistent with the observation that the group delay measured by varying f2 is greater than by varying f1 (Kimberley et al., 1993). In this study, in order to minimize the change in the emission phase at the generation site, the group delay was measured by varying f1 when f2 was constant. This frequency-dependent change in the emission generation site makes it difficult to interpret the measured group delay. Involvement of cochlear dispersion, tuning and nonlinearity further complicate the quantitative interpretation of the data. However, since these undefined factors equally affect the group delays at different longitudinal locations, the group delay difference between the beads should reliably indicate the propagation direction of BM vibration.
In summary, the cubic DPOAE was evoked by presenting f1 and f2 tones at intensities from 40 to 70 dB SPL, and the BM vibration at emission frequencies was measured at more than one longitudinal location. The phase-frequency response shows that the phase response at a basal location leads the phase at an apical location, indicating that the BM vibration at the emission frequency is a forward wave under the current experimental conditions. Data measured at relatively low intensities in this study are consistent with a previous finding that the expected backward travelling wave at the emission frequency could not be measured using a scanning-interferometer (Ren, 2004), which agrees with an experimental study in another species (Siegel et al., 2005). However, the finding in this study cannot exclude the possibility that a reverse traveling wave could propagate in the tectorial membrane, and may not be applied to other cochlear longitudinal locations until measurements are made.
Acknowledgments
The authors are grateful to the two Hearing Research reviewers for helpful comments and suggestions on the manuscript, and to Edward Porsov and Scott Matthews for technical assistance and valuable discussions. This study was supported by Grants from National Institute on Deafness and Other Communication Disorders.
Abbreviations
- BM
basilar membrane
- DP
distortion product
- OAE
otoacoustic emission
- DPOAE
distortion product otoacoustic emissions
- BF
best frequency
- CAP
cochlear compound action potential
Footnotes
Publisher's Disclaimer: This is a PDF file of an unedited manuscript that has been accepted for publication. As a service to our customers we are providing this early version of the manuscript. The manuscript will undergo copyediting, typesetting, and review of the resulting proof before it is published in its final citable form. Please note that during the production process errors may be discovered which could affect the content, and all legal disclaimers that apply to the journal pertain.
References
- Avan P, Magnan P, Smurzynski J, Probst R, Dancer A. Direct evidence of cubic difference tone propagation by intracochlear acoustic pressure measurements in the guinea-pig. Eur J Neurosci. 1998;10:1764–70. doi: 10.1046/j.1460-9568.1998.00188.x. [DOI] [PubMed] [Google Scholar]
- Cooper NP. Vibration of beads placed on the basilar membrane in the basal turn of the cochlea [letter] J Acoust Soc Am. 1999;106:L59–64. doi: 10.1121/1.428147. [DOI] [PubMed] [Google Scholar]
- Cooper NP, Rhode WS. Mechanical responses to two-tone distortion products in the apical and basal turns of the mammalian cochlea. J Neurophysiol. 1997;78:261–70. doi: 10.1152/jn.1997.78.1.261. [DOI] [PubMed] [Google Scholar]
- Cooper NP, Shera CA. Backward traveling waves in the cochlea? Comparing basilar membrane vibrations and otoacoustic emissions from Individual guinea-pig ears. Association for Research in Otolaryngology Twenty-seventh Midwinter Research Meeting; Daytona Beach, Florida,. 2004. p. 342. [Google Scholar]
- Dong W, Olson ES. Two-tone distortion in intracochlear pressure. J Acoust Soc Am. 2005;117:2999–3015. doi: 10.1121/1.1880812. [DOI] [PMC free article] [PubMed] [Google Scholar]
- Gibian GL, Kim DO. Cochlear microphonic evidence for mechanical propagation of distortion products (f2 - f1) and (2f1 - f2) Hear Res. 1982;6:35–59. doi: 10.1016/0378-5955(82)90006-5. [DOI] [PubMed] [Google Scholar]
- Goldstein JL. Auditory nonlinearity. J Acoust Soc Am. 1967;41:676–89. doi: 10.1121/1.1910396. [DOI] [PubMed] [Google Scholar]
- Goldstein JL, Kiang NYS. Neural correlates of the aural combination tone 2f1-f2. Proceedings of IEEE. 1968;56:981–992. [Google Scholar]
- Greenwood DD. A cochlear frequency-position function for several species--29 years later. J Acoust Soc Am. 1990;87:2592–605. doi: 10.1121/1.399052. [DOI] [PubMed] [Google Scholar]
- Hall JL. Auditory distortion products f2-f1 and 2f1-f2. J Acoustical Soc Am. 1972;51:1863–1871. [Google Scholar]
- Kemp DT. Evidence of mechanical nonlinearity and frequency selective wave amplification in the cochlea. Arch Otorhinolaryngol. 1979;224:37–45. doi: 10.1007/BF00455222. [DOI] [PubMed] [Google Scholar]
- Kemp DT. Otoacoustic emissions, travelling waves and cochlear mechanisms. Hear Res. 1986;22:95–104. doi: 10.1016/0378-5955(86)90087-0. [DOI] [PubMed] [Google Scholar]
- Khanna SM, Willemin JF, Ulfendahl M. Measurement of optical reflectivity in cells of the inner ear. Acta Otolaryngol Suppl. 1989;467:69–75. doi: 10.3109/00016488909138323. [DOI] [PubMed] [Google Scholar]
- Kim DO, Molnar CE, Matthews JW. Cochlear mechanics: Nonlinear behavior in two-tone responses as reflected in cochlear-nerve-fiber responses and in ear-canal sound pressure. J Acoustical Soc Am. 1980;67:1704–1721. doi: 10.1121/1.384297. [DOI] [PubMed] [Google Scholar]
- Kimberley BP, Brown DK, Eggermont JJ. Measuring human cochlear traveling wave delay using distortion product emission phase responses. J Acoust Soc Am. 1993;94:1343–50. doi: 10.1121/1.408162. [DOI] [PubMed] [Google Scholar]
- Knight RD, Kemp DT. Wave and place fixed DPOAE maps of the human ear. J Acoust Soc Am. 2001;109:1513–25. doi: 10.1121/1.1354197. [DOI] [PubMed] [Google Scholar]
- Lonsbury-Martin BL, Whitehead ML, Martin GK. Clinical applications of otoacoustic emissions. J Speech Hear Res. 1991;34:964–81. doi: 10.1044/jshr.3405.964. [DOI] [PubMed] [Google Scholar]
- Magnan P, Avan P, Dancer A, Smurzynski J, Probst R. Reverse middle-ear transfer function in the guinea pig measured with cubic difference tones. Hear Res. 1997;107:41–5. doi: 10.1016/s0378-5955(97)00015-4. [DOI] [PubMed] [Google Scholar]
- Marchand P, Marmet L. Binomial smoothing filter: A way to avoid some pitfalls of least-squares polynomial smoothing. Rev Sci Instr. 1983;54:1034–41. [Google Scholar]
- Narayan SS, Recio A, Ruggero MA. Cubic distortion products at the basilar membrane and in the ear canal of chinchillas. Association for Research in Otolaryngology Twenty-first Midwinter Research Meeting; St. Petersburg Beach, Florida. 1998. p. 181. [Google Scholar]
- Nuttall AL, Dolan DF. Inner hair cell responses to the 2f1-f2 intermodulation distortion product. J Acoust Soc Am. 1990a;87:782–90. doi: 10.1121/1.398890. [DOI] [PubMed] [Google Scholar]
- Nuttall AL, Dolan DF, Avinash G. Measurements of basilar membrane tuning and distortion with laser Doppler velocimetry. In: Dallos P, Geisler CD, Matthews JW, Ruggero MA, Steele CR, editors. The Mechanics and Biophysics of Hearing. Springer-Verlag; Berlin: 1990b. pp. 288–295. [Google Scholar]
- Olson ES. Direct measurement of intra-cochlear pressure waves. Nature. 1999;402:526–9. doi: 10.1038/990092. [DOI] [PubMed] [Google Scholar]
- Probst R. Otoacoustic emissions: an overview. Adv Otorhinolaryngol. 1990;44:1–91. doi: 10.1159/000417719. [DOI] [PubMed] [Google Scholar]
- Ren T. Longitudinal pattern of basilar membrane vibration in the sensitive cochlea. Proc Natl Acad Sci U S A. 2002;99:17101–6. doi: 10.1073/pnas.262663699. [DOI] [PMC free article] [PubMed] [Google Scholar]
- Ren T. Reverse propagation of sound in the gerbil cochlea. Nat Neurosci. 2004;7:333–4. doi: 10.1038/nn1216. [DOI] [PubMed] [Google Scholar]
- Ren T, He W, Scott M, Nuttall AL. Group delay of acoustic emissions in the ear. J Neurophysiol. 2006;96:2785–91. doi: 10.1152/jn.00374.2006. [DOI] [PubMed] [Google Scholar]
- Rhode WS, Cooper NP. Two-tone suppression and distortion production on the basilar membrane in the hook region of cat and guinea pig cochleae. Hear Res. 1993;66:31–45. doi: 10.1016/0378-5955(93)90257-2. [DOI] [PubMed] [Google Scholar]
- Robles L, Ruggero MA. Mechanics of the mammalian cochlea. Physiol Rev. 2001;81:1305–52. doi: 10.1152/physrev.2001.81.3.1305. [DOI] [PMC free article] [PubMed] [Google Scholar]
- Robles L, Ruggero MA, Rich NC. Two-tone distortion products in the basilar membrane of the chinchilla cochlea. In: Dallos P, Geisler CD, Matthews JW, Ruggero MA, Steele CR, editors. The Mechanics and Biophysics of Hearing. Springer-Verlag; Berlin: 1990. pp. 304–311. [Google Scholar]
- Robles L, Ruggero MA, Rich NC. Two-tone distortion in the basilar membrane of the cochlea. Nature. 1991;349:413–4. doi: 10.1038/349413a0. [DOI] [PMC free article] [PubMed] [Google Scholar]
- Robles L, Ruggero MA, Rich NC. Two-tone distortion on the basilar membrane of the chinchilla cochlea. J Neurophysiol. 1997;77:2385–99. doi: 10.1152/jn.1997.77.5.2385. [DOI] [PMC free article] [PubMed] [Google Scholar]
- Ruggero MA. Comparison of group delays of 2f1-f2 distortion product otoacoustic emissions and cochlear travel times. ARLO. 2004;5:143–147. doi: 10.1121/1.1771711. [DOI] [PMC free article] [PubMed] [Google Scholar]
- Shera CA, Guinan JJ., Jr Evoked otoacoustic emissions arise by two fundamentally different mechanisms: a taxonomy for mammalian OAEs. J Acoust Soc Am. 1999;105:782–98. doi: 10.1121/1.426948. [DOI] [PubMed] [Google Scholar]
- Siegel JH, Kim DO, Molnar CE. Effects of altering organ of Corti on cochear distortion products f2-f1 and 2f1-f2. Journal of Neurophysiology. 1982;47:303–328. doi: 10.1152/jn.1982.47.2.303. [DOI] [PubMed] [Google Scholar]
- Siegel JH, Cerka AJ, Recio-Spinoso A, Temchin AN, van Dijk P, Ruggero MA. Delays of stimulus-frequency otoacoustic emissions and cochlear vibrations contradict the theory of coherent reflection filtering. J Acoust Soc Am. 2005;118:2434–43. doi: 10.1121/1.2005867. [DOI] [PubMed] [Google Scholar]
- Smoorenburg GF. Combination tones and their origin. J Acoustical Soc Am. 1972;52:615–632. [Google Scholar]
- Tubis A, Talmadge CL, Tong C. Modeling the temporal behavior of distortion product otoacoustic emissions. J Acoust Soc Am. 2000;107:2112–27. doi: 10.1121/1.428493. [DOI] [PubMed] [Google Scholar]
- Vetesnik A, Nobili R, Gummer A. How does the inner ear generate distortion product otoacoustic emissions?. Results from a realistic model of the human cochlea. ORL J Otorhinolaryngol Relat Spec. 2006;68:347–52. doi: 10.1159/000095277. [DOI] [PubMed] [Google Scholar]
- Wilson JP. Model for cochlear echoes and tinnitus based on an observed electrical correlate. Hear Res. 1980;2:527–32. doi: 10.1016/0378-5955(80)90090-8. [DOI] [PubMed] [Google Scholar]