

Abstract
Presented in this paper are crystal structures of the Anabaena sensory rhodopsin transducer (ASRT), a soluble cytoplasmic protein that interacts with the first structurally characterized eubacterial retinylidene photoreceptor Anabaena sensory rhodopsin (ASR). Four crystal structures of ASRT from three different spacegroups were obtained, in all of which ASRT is present as a planar (C4) tetramer, consistent with our characterization of ASRT as a tetramer in solution. The ASRT tetramer is tightly packed with large interfaces where the well-structured β-sandwich portion of the monomers provides the bulk of the tetramer-forming interactions and forms a flat, stable surface on one side of the tetramer (the “β-face”). Only one of our four different ASRT crystals reveals a C-terminal α-helix in the otherwise all-β protein, together with a large loop from each monomer on the opposite face of the tetramer (the “α-face”), which is flexible and largely disordered in the other three crystal forms. Gel filtration demonstrates that ASRT forms stable tetramers in solution and isothermal microcalorimetry shows that the ASRT tetramer binds to ASR with a stoichiometry of one ASRT tetramer per one ASR photoreceptor with a Kd of 8 μM. Possible mechanisms for the interaction of this transducer tetramer with the ASR photoreceptor via its flexible α-face to mediate transduction of the light signal are discussed.
Keywords: Anabaena, photosensory, rhodopsin, transducer, structure
Introduction
The freshwater cyanobacterium Anabaena sp. expresses the apoprotein of the membrane-embedded light-sensor Anabaena sensory rhodopsin (ASR) from an operon that contains one additional gene encoding a 14 kDa soluble protein.1 Jung et al. concluded that ASR is a sensory rhodopsin due to its lack of electrogenic ion transport when expressed in E. coli, a relatively slow photocycle similar to that of known sensory rhodopsins, lack of the proton donor present in proton-pumping rhodopsins and its co-transcription with the 14 kDa protein, which was found to interact with ASR while influencing its photocycle. Since the soluble protein partner of ASR encoded in the same operon is further shown in this study to exhibit moderate affinity binding to ASR, we consider the evidence of this small soluble protein serving a putative transducer sufficiently strong to tentatively designate it the ASR transducer (ASRT).
ASR is a member of the microbial rhodopsin family, which is comprised of retinylidene membrane proteins that function either as light-powered ion pumps or as light-sensors. Microbial rhodopsins, like vertebrate rhodopsins, are integral membrane proteins with seven transmembrane helices that form a central binding pocket for the retinal chromophore. In both vertebrate and microbial rhodopsins the retinal is attached covalently to a lysine in the seventh transmembrane helix via a Schiff base linkage. While the retinal chromophore photoisomerizes in both families, the two systems exhibit different isomeric configurations. In vertebrate rhodopsins the isomerization occurs from cis to trans at the C11=C12 double bond and the sensor is returned to its initial state by breaking of the Schiff base bond, dissociation-loss of the all-trans retinal and replenishment with the 11-cis isomer. In contrast, in microbial rhodopsins each effective photon absorption event starts a complete cycle of structural changes of chromophore and protein that returns the rhodopsin to its initial or dark state with no disruption of the retinylidene-Schiff base linkage. The absorption of one photon by the retinal chromophore of microbial rhodopsins causes a trans-to-cis isomerization of the C13=C14 double bond, which in turn triggers a series of conformational changes in the protein. Eventually, protein and chromophore return to their initial states without further energy input, thus completing one photocycle per photon-absorption event. The structural changes associated with these photocycles support different functions within the microbial rhodopsin family. In bacteriorhodopsin2;3 and halorhodopsin4 ions are pumped against an electrochemical gradient across the cytoplasmic membrane to convert light energy to chemiosmotic energy. Sensory rhodopsins, on the other hand, use the light-induced conformational changes of the protein as a signal that is transferred to transducer proteins, which in turn modulate signaling events that control a variety of light-dependent cellular processes.5 The best sensory rhodopsin characterized in structural terms is the haloarchaeal phototaxis receptor sensory rhodopsin II (SRII).6–8 Bacteriorhodopsin, halorhodopsin and SRII are all archaeal in origin and have been relatively well characterized, functionally as well as structurally.
The crystal structure of ASR9 was the first of a eubacterial rhodopsin. The overall structure of ASR resembles those of the archaeal rhodopsins. In terms of backbone structure the main divergence was observed on the cytoplasmic face of ASR – the expected interaction region with the putative soluble transducer ASRT. The cytoplasmic face contains three ordered loops that are arranged very differently from their archaeal counterparts. Another notable difference to the archaeal rhodopsins is evident in the cytoplasmic half of ASR, a region typically very hydrophobic in archaeal rhodopsins.6 In ASR this interior region of the molecule is far more hydrophilic, with numerous ordered water molecules forming hydrogen bonds with polar and charged residues, creating a network of hydrogen bonds that extends from near the Schiff base to the cytoplasmic surface.
As a fully soluble protein ASRT represents a new type of transducer for microbial rhodopsins. Previously, only one other microbial rhodopsin-transducer system has been characterized at atomic resolution - that of sensory rhodopsin II (SRII) and its transducer HtrII from the haloarchaeon Natronomonas pharaonis.8 In contrast to the small, soluble ASRT molecule, HtrII contains two transmembrane helices, which interact with the rhodopsin in a heterotetrameric intramembrane signaling complex. The ASR-ASRT system with its soluble transducer is therefore more reminiscent of the signaling complex of vertebrate rhodopsin with its heterotrimeric Gαβγ transducer complex, which interacts with the rhodopsin mainly via its cytoplasmic face.
Furthermore, ASRT lacks the signaling and methylation domains that are characteristic of the taxis signaling proteins that mediate attractant and repellent phototaxis, which are controlled by archaeal sensory rhodopsins SRI and SRII respectively.10 Consequently, the ASR-ASRT system and the previously characterized haloarchaeal sensory system show significant differences not only in the nature of their respective light receptor-transducer interactions but also in their signal transduction mechanisms inside the cell and the cellular functions they ultimately target.
ASR photochromic reactions9;11 suggest it functions as a relatively stable molecular switch which is controlled by orange and blue light. One possible signaling purpose is the regulation of gene-expression in response to light intensity and/or quality. This control could occur via direct transcriptional regulation by ASRT (making ASRT a transcription factor) or via transcription factors further downstream in a not yet characterized signaling cascade. Possible target systems for such regulation include proteins involved in circadian rhythm control, photomorphogenesis or chromatic adaptation,12 which optimizes photosynthesis in cyanobacteria by variation of phycobiliprotein composition.13;14
A BLAST search reveals sequence homologs with 31% to 73% sequence identity to ASRT, each consisting of about 120 amino acid residues. These ASRT homologs are found in diverse bacteria (Nitrosococcus, Polyangium, Rubrobacter, Nitrobacter, Anaeromyxobacter, Sinorhizobium, Azoarcus, Bacillus, Caldicellulosiruptor, Thermotoga), and none have a known function.
Results
Expression, purification, crystallization, data collection, and initial phasing were described along with the pertinent statistics in a previous publication.15 Crystals and structures of ASRT were obtained in three spacegroups: P4 (PDB code 2IIA), C2 (2II9) and P212121 (2II7, 2II8). The P212121 crystal form can be cryo-cooled in a range of unit cell sizes (> 20% volume variation) depending on cryo-conditions and protocol. Of these, the largest P212121 unit cell (from here on referred to as “large P212121”) provided the largest amount of interpretable electron density (92% for the most complete monomer) while in the smaller unit cell sizes (referred to as “small P212121” in this paper) 17% to 27% of the molecule were disordered, similar to spacegroups C2 (26% disordered) and P4 (29% disordered). Most of the additional interpretable electron density in the large P212121 form stems from a partially ordered C-terminal helix that is completely disordered in the other three crystal forms. The large disordered fractions are reflected in refinement R-factors that are higher than expected for their respective resolutions. Refinement statistics are listed in Table 1.
Table 1.
Refinement statistics
| P4 | C2 | P212121 (small unit cell) | P212121 (large unit cell) | |
|---|---|---|---|---|
| Resolution [Å] | 1.8 | 2.0 | 2.1 | 2.8 |
| No. of reflections (working / test set) | 11,354/567 | 25,101/2,774 | 56,142/4,287 | 27,591/2,088 |
| Rwork / Rfree [%] | 19.7/24.0 | 21.5/25.9 | 22.8/26.3 | 25.9/31.5 |
| Monomers per a.u. | 1 | 4 | 8 | 8 |
| Residues built | ||||
| per chain | 89 | 2×92, 93, 94 | 91, 4×92, 97, 98, 104 | 2×91, 103, 2×10⁶, 110, 112, 115 |
| per a.u. | 89 | 371 | 758 | 834 |
| No. of protein atoms | 701 | 2,912 | 5,951 | 6,548 |
| No. of waters | 139 | 201 | 582 | 15 |
| Mean B factor [Å2] | 36.6 | 21.9 | 38.4 | 60.5 |
| R.m.s. deviations from ideality | ||||
| bond lengths [Å] | 0.019 | 0.021 | 0.023 | 0.008 |
| bond angles [°] | 1.707 | 1.932 | 1.899 | 1.420 |
| Ramachandran statistics (% of residues per region) | ||||
| most favorite | 93.2 | 93.8 | 91.2 | 86.5 |
| allowed | 6.8 | 6.2 | 8.8 | 13.5 |
| disallowed | 0.0 | 0.0 | 0.0 | 0.0 |
In all three spacegroups (P4, C2 and P212121) ASRT forms the same tightly packed tetramer with C4 symmetry (Figure 1). In the P4 spacegroup this tetramer is formed by crystallographic symmetry, while in the other two spacegroups the tetramer symmetry is non-crystallographic. The same tetramer was also observed in the only structural homolog of ASRT in the protein data bank – protein TM1070 (PDB code 1NC7, no corresponding publication). This 114-residue protein TM1070 from the hyperthermophilic bacterium Thermotoga maritima possesses 35% sequence identity with ASRT (Figure 2).
Figure 1. Ribbon representations of the P4 (A), C2 (B) and large P212121 (C) tetramers compared to the TM1070 tetramer (PDB code 1NC7) (D).
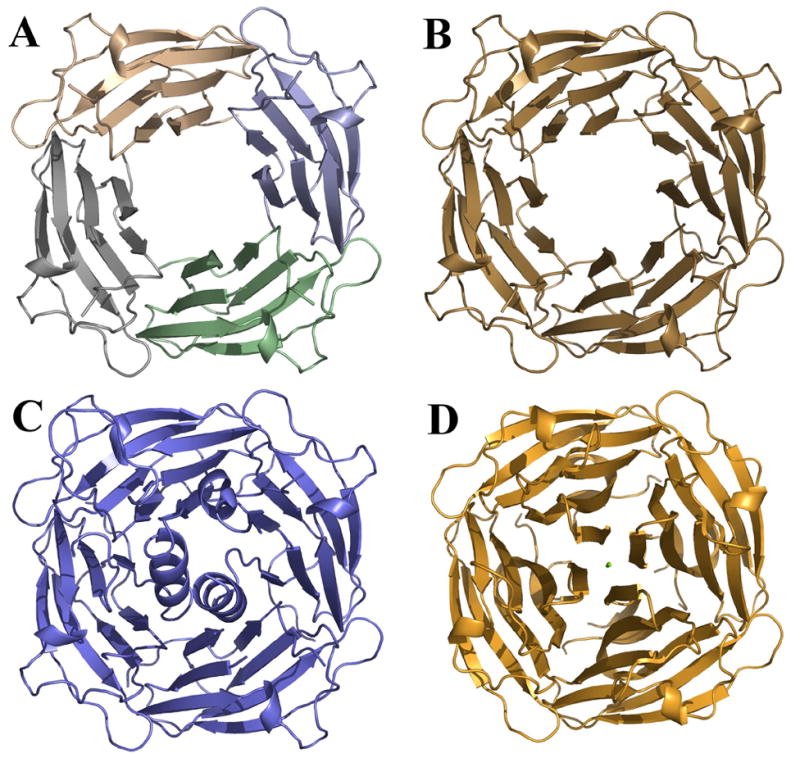
The tetramer in the P4 cell is formed by crystallographic symmetry. The C2 ASRT crystals and the TM1070 crystals contain one tetramer in the asymmetric unit while the P212121 asymmetric unit contains two such tetramers facing each other.
Figure 2.
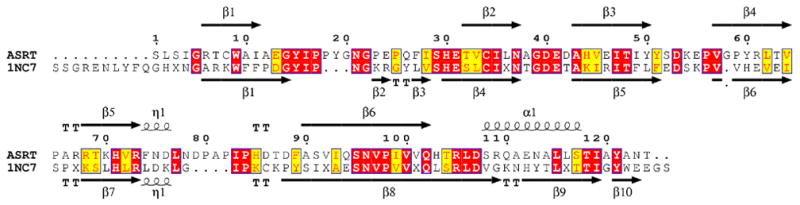
Primary and secondary structure comparison of ASRT and TM1070, based on secondary structure assignment from the large P212121 structure of ASRT and PDB deposition 1NC7 for TM1070 generated using the web-based utility ESPript 2.2 (http://espript.ibcp.fr/ESPript/ESPript).
Dynamic light scattering (DLS) and analytic gel filtration chromatography confirm the tetrameric state of ASRT in solution. Neither method gave an indication of a subpopulation of monomeric ASRT. Those experiments were performed at pH 8.0 compared to pH values between pH 4 and pH 5 for the crystallization conditions, indicating the tetramer is stable over a wide range of pH and does not depend on charge-charge interactions for stabilization. Gel filtration suggests a size of the ASRT tetramer slightly below that of the 67 kDa bovine albumin (control), slightly larger than expected for a tetramer 14.7 kDa molecules (Figure 3). This is probably due to the central hole in the tetramer, which increases the occupied volume beyond the value anticipated from the molecular weight alone
Figure 3.
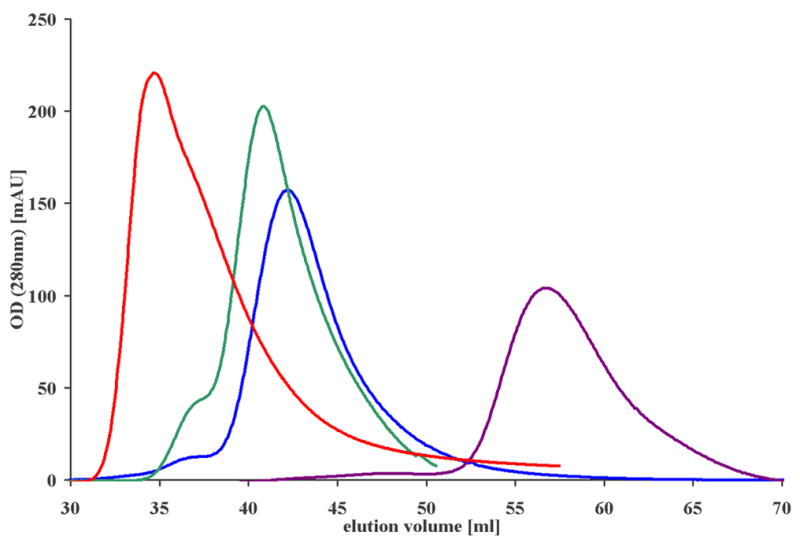
Gel filtration chromatography demonstrates that ASRT is a tetramer in solution (blue, peak at 43 ml) eluting slightly slower than the 67 kDa bovine serum albumin reference (green, 42 ml) but clearly faster than the 13.7 kDa ribonuclease A reference (purple, 57 ml), which corresponds in size to an ASRT monomer. The exclusion volume, at which a 120 kDa ASRT octamer or higher oligomers would be expected to elute, is 36 ml (red, determined with dextran 2000).
The ASRT tetramers are tightly packed with 833 Å2 or 19% of the monomer surface involved in the tetramer interface in the ordered part of the C2 tetramer and an average of 1,220 Å2 or 23% of the monomer surface of the large P212121 crystals.
Residues 3–18 and 31–104 show clear density in all four crystal forms (P4, C2, P212121small and P212121large). These residues form two β-sheets in a folding topology that has not been reported previously. It consists of seven β-strands arranged in a β-sandwich. This β-sandwich section of the ASRT structure has the same fold as the corresponding section of the unpublished TM1070 structure. In contrast, the C-terminal helix of ASRT is replaced by a continuation of β-turn 7 and an 8th β-turn directly after β-turn 7 in TM1070.
In the P4, C2 and small P212121 crystal forms of ASRT there is no electron density for the loop composed of residues 19–30 and for the C-terminal 20 residues with the exception that the 12-residue loop between Pro18 and Glu31 is ordered in two of the eight monomers in the small P212121 crystal form. These loops do, however, have different conformations from each other and from those in TM1070, and they are involved in crystal contacts. The large P212121 form shows these same two loops as well as density for a C-terminal helix up to residue 120 in four of the eight monomers in the asymmetric unit - three of them in the same tetramer. There is fragmented electron density suggesting the position of the fourth C-terminal helix in this tetramer but it is not sufficient for model building. The second tetramer in the large P212121 asymmetric unit displays only one C-terminal helix with clearly defined density. In the ASRT homolog TM1070 the equivalent C-terminal residues fold into a β-conformation that extends away from the tetramer parallel to its 4-fold axis and then makes a 180° turn to loop back close to the 4-fold axis along the center of the tetramer (Figures 1, 7). In the resulting narrow channel that traverses the center of the TM1070 tetramer β-strands coordinate a string of four Mg2+ and two Cl− ions situated on the 4-fold tetramer axis. In stark contrast, in the large P212121 form of ASRT, the only ASRT crystal form with electron density for the C-terminal residues, the C-terminal residues form α-helices pointing away from the tetramer, leaving a wide opening in the middle of the β-folded part of the tetramer. The C-terminal α-helices with electron density do not conform to the 4-fold symmetry. Each helix is pointing away from the tetramer at a different angle. One helix does not fold into the classical α-helical conformation: after the α-helical n→n-4 hydrogen bonding pattern for the first two residues (107 and 108) it tapers out into an increasingly elongated form with n→n-3 hydrogen bonding at residue 111 and finally an elongated helical coil with no electron density after residue 116. The other two helices follow the classical α-helical fold until they become disordered at residues 118 and 119, respectively. Even though the B-factors for these helices are very high (sometimes exceeding 100 Å2) and substantially higher than those of the rest of the structure, helical density was clearly visible even before the atomic model was built. There is no density along the tetramer axis to indicate bound ions even though the P4 and P212121 crystals were grown in up to 300 mM MgCl2 specifically to confirm this difference to the TM1070 structure.
Figure 7.
Large P212121 tetramer with one monomer colored according to residue conservation among the top eight BLAST sequence homologs. The coloring represents alignment scores of completely (red), strongly (orange) and significantly (yellow) conserved residues according to the program Clustal W (v.1.82).29 Conservation is relatively high at the tetramer interfaces and relatively low in the C-terminal helix. The sequence of the flexible loop is also relatively weakly conserved, especially compared to TM1070, which has two fewer residues in this loop than the top five BLAST hits for ASRT and is missing the proline at the end of the flexible loop.
The four disordered C-terminal helices of the tetramer as well as the mostly disordered loops between residue 18 and 30 are located on the same face of the tetramer, making it a region of low structural order. We will refer to this face as the “α-face” in this article because of its primarily α-helical secondary structure. The opposing face, which is completely ordered and identical in all the structures we obtained, will be referred to as the “β-face” since it displays exclusively β-strand secondary structure.
Interaction of ASR and ASRT by Isothermal Titration Calorimetry
Given the tetrameric state of ASRT in the crystals as well as in solution the question arose whether one ASRT tetramer interacts with one, two, four or any other number of ASR photoreceptor molecules. Consequently isothermal titration calorimetry (ITC) measurements were performed to determine the molecular ratio with which ASR and ASRT interact.
In order to determine the concentration of ASR used in the ITC measurements, the molar extinction coefficient of ASR needed to be determined (Figure 4). The rough concentration of ASR opsin in the purified protein sample was estimated based on the absorption of aromatic amino acids yielding a value of ~14 μM. A sub-saturating concentration of retinal (~3.5 μM) was used for ASR reconstitution to ensure specificity and completeness of binding. Successive scans of absorption revealed the appearance of a reconstitution intermediate (panel A, Figure 4). This intermediate form appears in the first scan (during 1 min) and converts to ASR with a time constant of ~5.5 min. It has a structured absorption spectrum with a main peak at 435 nm and shoulders at 405 nm and 460 nm, evident also as negative bands in the difference spectrum of its conversion to ASR (curve 3, panel B, Figure 4). The maximum absorption of reconstituted ASR is at 549 nm, matching the calculated absorption of the pure all-trans form of ASR.11 No residual intermediate nor residual retinal was detected after completion of the reconstitution. The extinction coefficient at the absorption maximum of the all-trans form of ASR calculated from these spectra and the extinction of free retinal (44,000 mol−1cm−1 at 384 nm in ethanol) is 61,000 mol−1cm−1. The same value was obtained from the difference spectra of reconstitution (curve 2, panel B, Figure 4), provided the correction for ASR absorption at 384 nm was made.
Figure 4. Reconstitution of ASR with all-trans retinal.
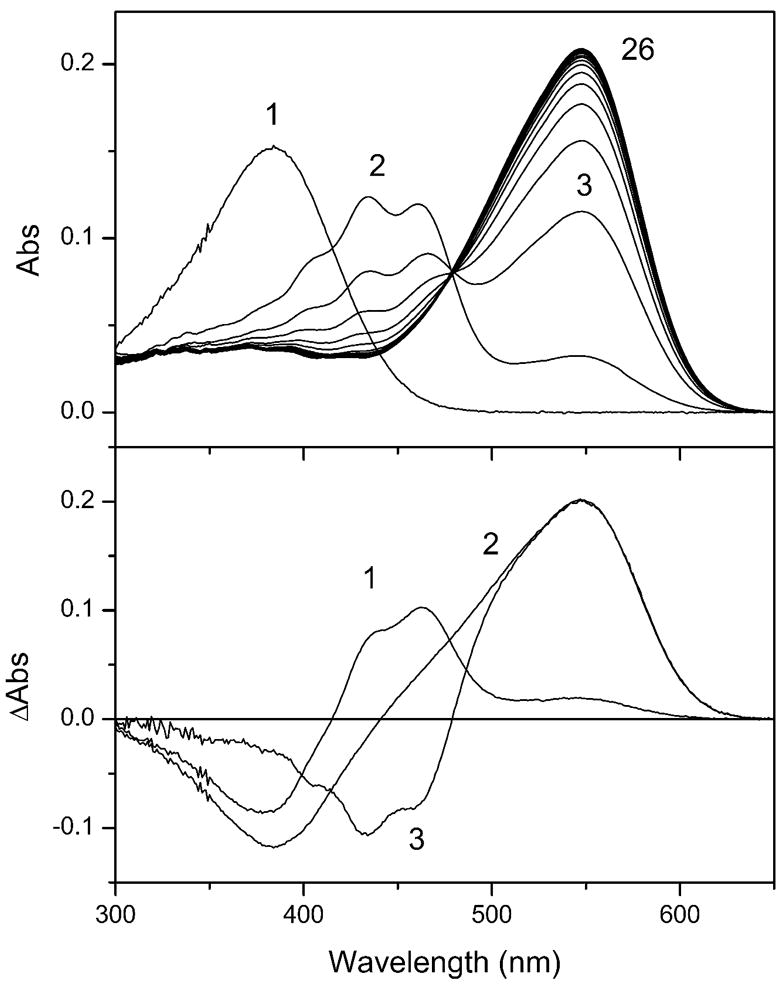
(A) Absorption spectra in the course of ASR reconstitution. 1, retinal in ethanol; 2–26, absorption spectra measured with 3-min increments immediately after addition of the same amount of retinal as in spectrum 1 to ~4-fold excess of purified ASR opsin. The absorption spectrum of the protein sample measured prior to retinal addition was subtracted from all curves. (B) Reconstitution difference spectra. 1, immediately after addition of retinal (spectrum 2 minus spectrum 1 from panel A); 2, after completion of the opsin reconstitution (spectrum 26 minus spectrum 1 from panel A); 3, normalized difference spectrum of the conversion of the reconstitution intermediate to ASR (spectrum 26 minus spectrum 2 from panel A ).
The concentration of ASR in the samples used for the ITC measurements was determined prior to their dark-adaptation in the ITC sample chamber. At ambient light conditions, the absorption maximum of ASR is shifted to 543 nm and the extinction decreased to 53,000 mol−1cm−1 due to the formation of the 13-cis isomer of ASR during light adaptation.11 This light-adapted extinction value was used for determination of the pigment concentration for the ITC measurements.
ITC measurements gave stoichiometric values for monomer ASRT binding to ASR near 4 (4.27 +/− 0.35, n=7); a representative ITC run is shown in Figure 5. Taking into account the relative sizes of the ASRT monomer and the portion of ASR exposed to the cytoplasm, four equal binding sites for ASRT on ASR seem highly unlikely. Therefore we favor the alternative explanation that the binding occurs between ASR and one tetramer of ASRT, present in solution in approximately 4-fold lower concentration than calculated for the monomer, which correlates with the structural and gel filtration data above. The mean value of the dissociation constant calculated for tetrameric ASRT binding to ASR is ~17 +/− 4 μM (n=7) with a single binding site on the ASR molecule. In some measurement the value was as low as 8 μM.
Figure 5. Isothermal titration calorimetric titration of ASR with ASRT.
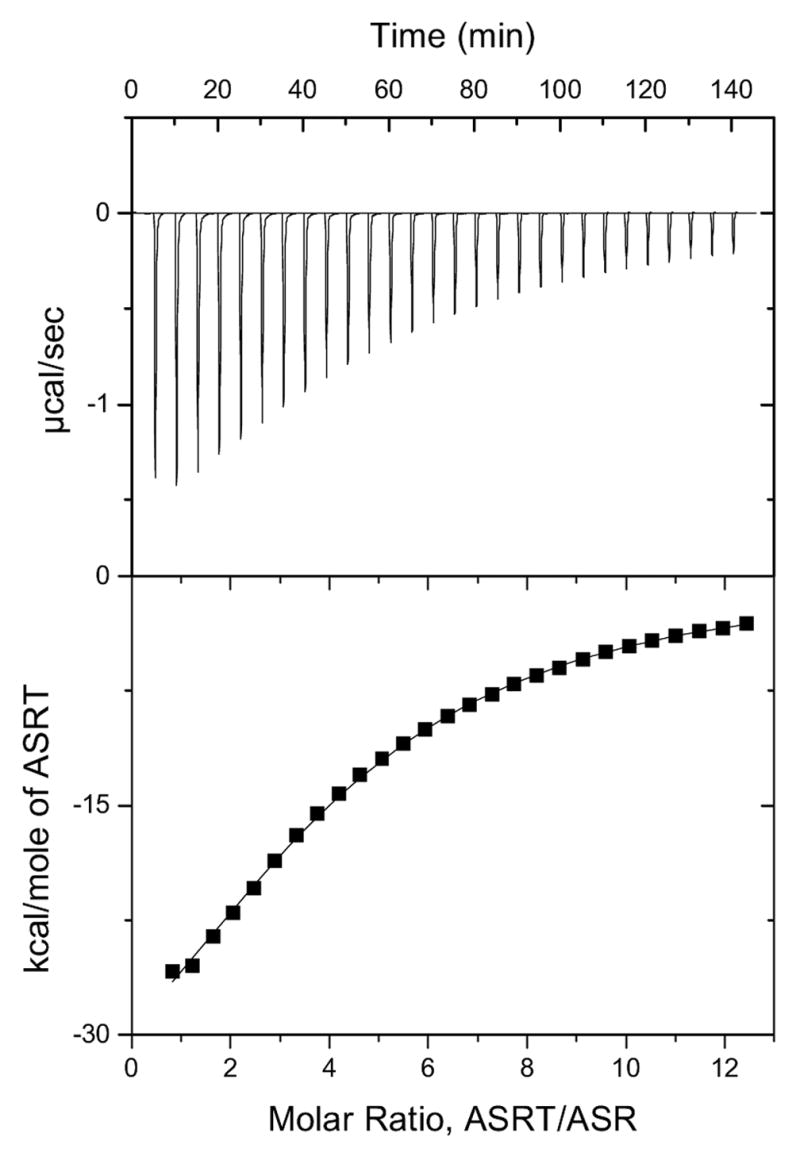
The top panel shows the baseline corrected data. The bottom panel shows molar enthalpy change as a function of the molar ratio of ASRT monomers and ASR.
Binding greatly depends on yet not identified parameters of the sample. Data collection in the dark sample chamber requires more than two hours, and therefore the sample becomes to a great extent dark-adapted. This fact and variability of the quantitative results did not allow us to follow the effect of light/dark adaptation of the sample on binding of ASRT to ASR.
Discussion
In all, three crystal forms described here as well as in that of the homolog TM1070, the protein crystallizes as the same C4 homotetramer, which only for the P4 form is a crystallographic tetramer (Figure 1). We confirmed this strong indication that the tetrameric state is the natural solution state of ASRT by dynamic light scattering (DLS, data not shown), analytic gel filtration and ITC as described above. Considering only the conserved β-sandwich part of the structure, which corresponds to the ordered portion of the P4 crystal structure, the tetramer interface comprises 750 Å2 of the 4,314 Å2 surface area of each monomer.
For the homolog TM1070 30% of the monomer surface area are involved in the tetramer interface. The intermolecular interfaces of the ASRT tetramer are clearly more hydrophobic than the rest of the surface (Figure 6) and the tetrameric contacts are conserved more strongly (Figure 7).
Figure 6.
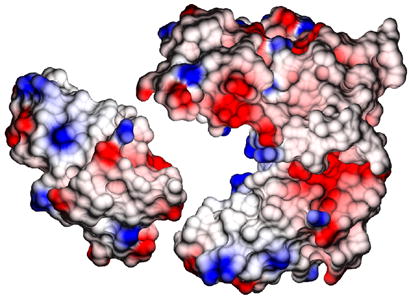
The surface of the large P212121 tetramer of ASRT, with one monomer removed and depicted to the left, colored according to electrostatic potential. Hydrophobic patches on both sides of the monomer facilitate tetramer formation.
The structure of the protein outside the β-sandwich seems to be highly variable as evidenced by the large differences in unit cell size of the P212121 unit cells at room temperature (1.23 × 10⁶ Å3) and cryo-cooled with glycerol (1.17 × 10⁶ Å3) and PEG 4000 (1.05 × 10⁶ Å3) cryo-protectants. Furthermore, heavy-metal soaked P4 crystals also showed anisomorphism of about 7% along the c-axis (37 Å to 40 Å), which runs parallel to the 4-fold axis of the tetramer. In light of this it appears questionable that the arrangement of the three irregular helices at the α-face of the large P212121 tetramer represents the only native state, but rather one possible arrangement of this apparently very flexible region. The varying unit cell sizes observed with the P4 and P212121 crystals indicate different arrangements of those helices or possibly even different secondary structures of the C-terminal residues. Considering the progression from small to large P212121, where the larger unit cell contained more interpretable density, it seems possible that the even larger unit cell observed at room temperature contains additional density for the C-terminal residues. Unfortunately, the ASRT crystals at best diffract to 3.5 Å at room temperature and degrade very quickly during data collection, not allowing collection of a complete dataset. This seems to confirm the existence of highly flexible regions in the protein fold, at least under the crystallization conditions. All three crystal forms were obtained between pH 4.2 and pH 5.0. The missing electron density cannot be explained by proteolysis since crystals of each of the three spacegroups were separately dissolved in water for mass spectrometry, which showed the protein to be full-length in each of them (Figure 8).
Figure 8.
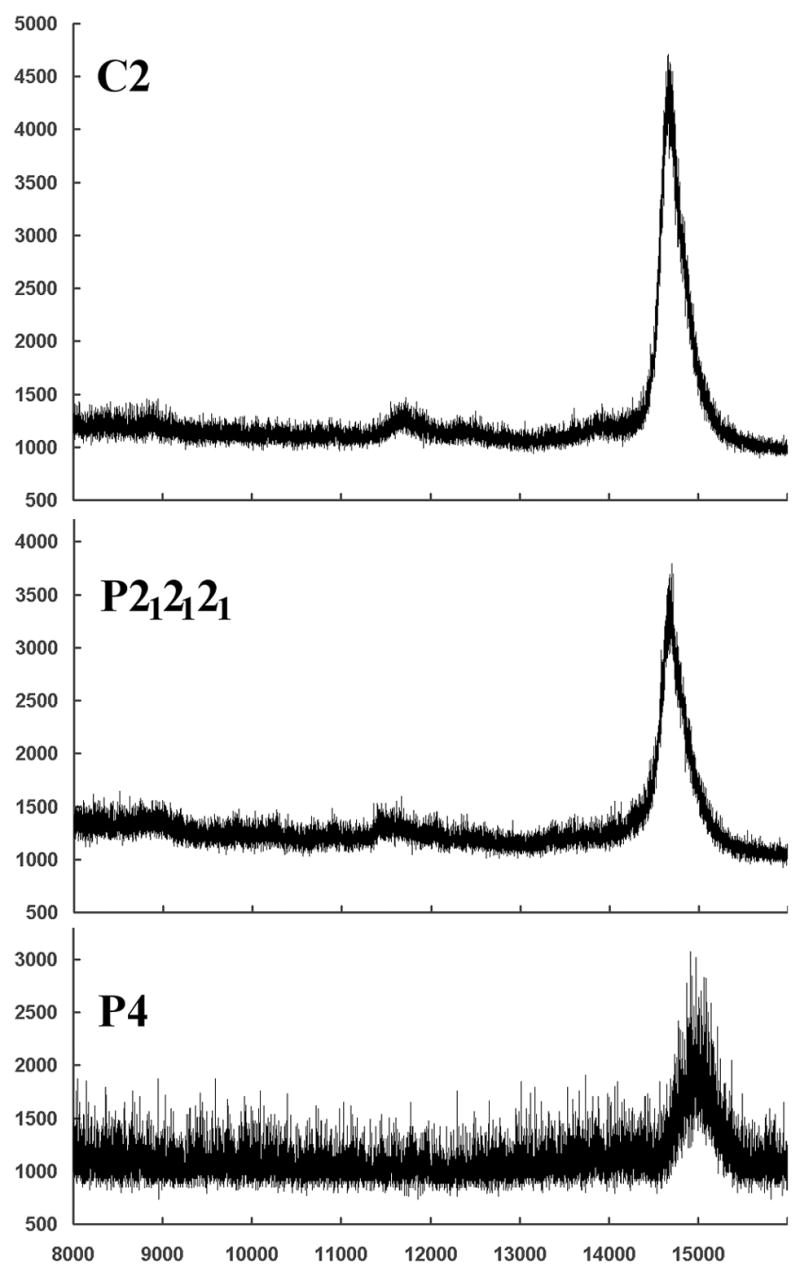
The molecular mass of ASRT in dissolved P4, C2 and P212121 crystals was determined by mass spectrometry – confirming intact ASRT in these crystals. The large fragment between residues 31 and 104 is fully represented in the electron density of all ASRT molecules in all three crystal forms. Therefore one would expect ASRT to show a mass spectrometry peak between 8.3 kDa (residues 31–104) and 14.7 kDa (intact molecule with 6xHis-tag) if the missing electron density for residues 18–31 and 104–125 were due to proteolysis. Since mass spectrometry shows only the intact ASRT the absence of interpretable electron density for the loop and C-terminus must be due to disorder, not degradation.
Considering that the sequence homology of ASRT with the homolog TM1070 persists into the C-terminal region it seems conceivable that ASRT could adopt a C-terminal βstrand conformation as in the TM1070 structure. It was taken into consideration that the His-tags at either of the protein termini (C-terminal in the C2 and P212121 and N-terminal in the P4 crystals) may have prevented complete folding of the monomers or proper arrangement of the α-face of the tetramer. However, the homolog TM1070 was crystallized with an N-terminal His-tag as well and has a completely ordered structure. Additionally, both termini in TM1070 are on the side of the tetramer that corresponds to β-face of ASRT, opposite to where the C-terminal helices are located in the ASRT tetramer. Furthermore, the C-terminally-tagged P212121 and C2 spacegroup ASRT crystals lack interpretable electron density for the same parts of the protein that are disordered in the N-terminally-tagged P4 ASRT crystals. It seems unlikely that C- and N-terminal 6-His-tags would have exactly the same effect on protein folding without disturbing the rest of the tetramer. Applying the TM1070 folding pattern to the ASRT sequence the C-terminal His-tag would be located over 18 Å away from the N-terminus of the same monomer and 15 Å away from the N-terminus of the neighboring monomer (Figure 9), making identical structural effects of C- and N-terminal His-tags even more unlikely.
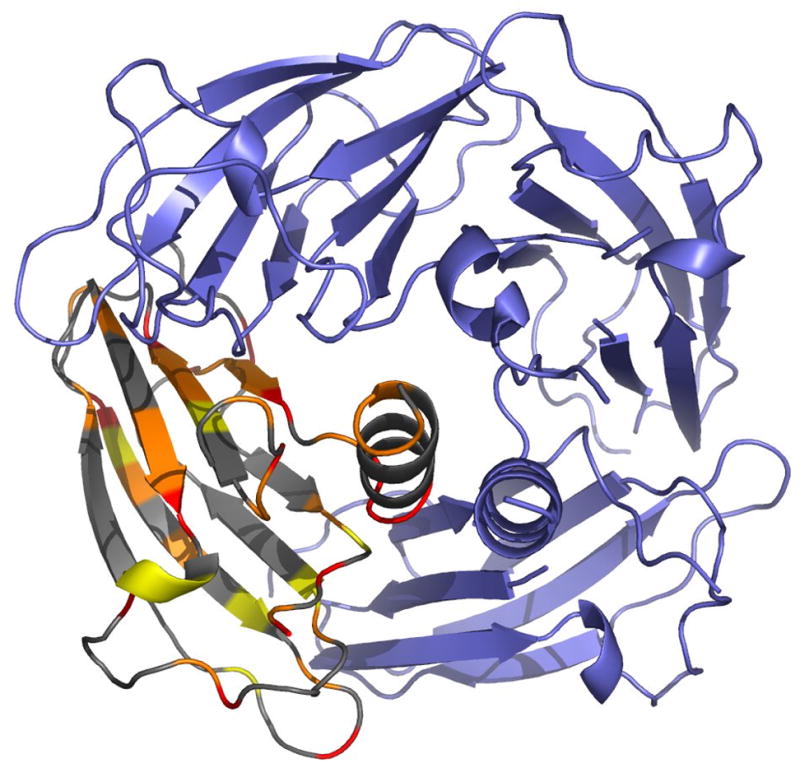
Figure 9. Modeling the ASRT C-terminal sequence onto the TM1070 structure (PDB code 1NC7) places the C-termini at the end of the central opening of the tetramer on the β-face.
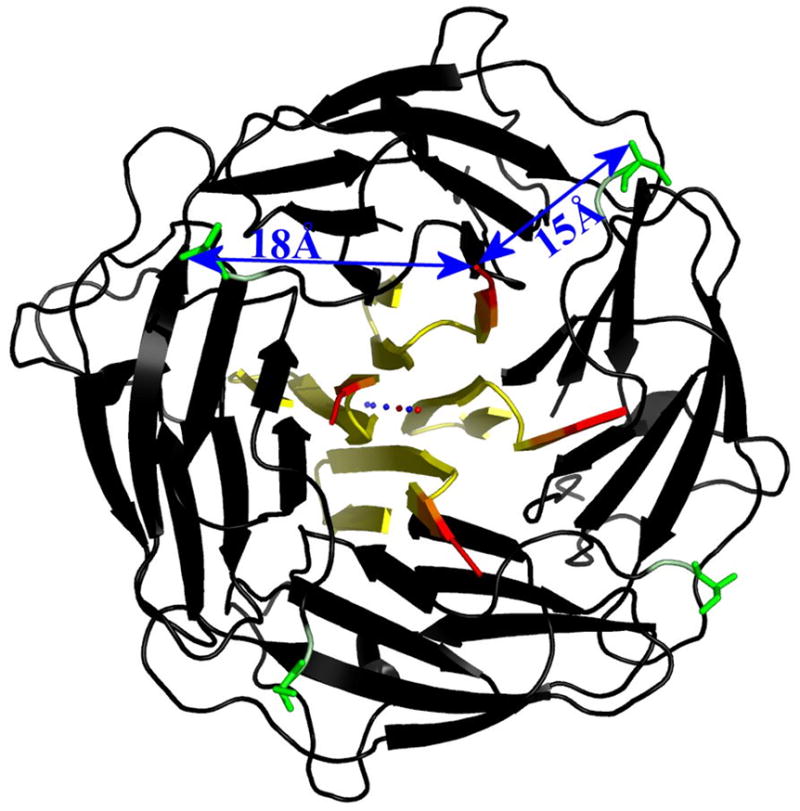
Shown here are the C-terminal residues of that alignment, which are disordered in most of the ASRT structures (yellow → red indicates C-termini) along with the C2 ASRT tetramer (black). The N-terminal serine residue (green) in the ASRT structure is located on the β-face of the tetramer as well but points away from the 4-fold axis. The distances between N- and C-termini are 18 Å within a monomer and 15 Å between adjacent monomers. The spheres along the central tetramer axis represent the Mg2+ (blue) and Cl− (red) ions, which are observed in the TM1070 structure but not in the ASRT structures despite being present in the crystallization buffer.
Secondary structure predictions with the programs SSpro and SSpro816 suggest an α-helical C-terminal segment for ASRT, although it should be added that SSpro predicts a C-terminal α-helix for TM1070 as well. The different secondary structures cannot be explained by the absence in ASRT of the four Mg2+ and two Cl− ions observed in the TM1070 crystal structure since the P4 and P212121 crystals were grown in the presence of up to 300 mM MgCl2 without any effect on the protein fold.
This evidence does not completely rule out the possibility that the N- and C-terminal His-tags are the cause of the partially unstable fold observed in all three ASRT crystal forms, but considered together with the fact that the completely ordered homolog TM1070 was expressed with an N-terminal His-tag as well it seems very unlikely. The fact that His-tagged ASRT still binds ASR also indicates that the His-tag does not have a major impact on the structure of ASRT. Since ASRT is thought to act as a transducer for the transmembrane photoreceptor ASR it is plausible that the flexible helical conformation is indeed the native state of the α-face and is stabilized in the cyanobacterium by interaction with the membrane or the photoreceptor. The Anabaena sensory rhodopsin crystal structure does indeed show a hydrophobic patch on its cytoplasmic surface. However, this hydrophobic patch could be an artifact of the C-terminally truncated version of ASR used to obtain that crystal structure (residues 230–261 missing9).
The tetrameric state of ASRT could be considered a problematic aspect for the ASR-ASRT signaling system since it is counterintuitive that a complex with 4-fold symmetry would bind to a surface devoid of rotational symmetry. However, in the ASR-ASRT system this predicament would be resolved by the high flexibility of the α-face of the ASRT tetramer. While the β-folded part of the ASRT tetramer provides stable interactions for tetramer formation the α-face can adopt conformations free of rotational symmetry, such as the one observed in the P212121large tetramer, which does not preserve the 4-fold symmetry of its β-scaffold on the α-face of the tetramer.
The often disordered loop between residues 18 and 31 forms the α-face of the tetramer together with the C-terminal helices. Like the C-terminal helices this loop displays great conformational flexibility in the absence of a binding partner, as evidenced by the three completely different conformations observed in the P212121 ASRT and TM1070 crystals.
In conclusion, our four structures and our observations of unit cell size fluctuations indicate that the ASRT tetramer consist of a relatively rigid, C4 symmetrical, β-folded scaffold supporting a flexible, asymmetric α-face of four helices and loops which could interact with the rhodopsin photoreceptor in an adaptable fashion.
Interestingly, there is some superficial structural similarity between the ASRT tetramer and the Gβ protein (Figure 10) of eukaryotic heterotrimeric G-proteins17–19 which functions as the transducer for G-protein coupled receptors (GPCRs) such as rhodopsin (type II). GPCRs are of paramount pharmaceutical importance due to their central role in vertebrate signal transduction. Gβ is a member of the WD-repeat protein family, which performs regulatory functions. WD-repeat proteins contain four to eight WD repeats, so called because of their characteristic sequence repeats ending in Trp-Asp. Structurally these repeats represent small β-sheets (called “propeller blades”) composed of four antiparallel β-strands that are arranged in a ring around the monomer center. Gβ consists of seven such blades and an N-terminal helix, which binds Gγ, the smallest member of the heterotrimeric G-protein assembly, consisting of only two helices. Gα is the member of the heterotrimeric complex, comprised of one α, β and γ subunit each, that interacts directly with the GPCR. Both Gα and Gγ are membrane-anchored via lipid attachments, while Gβ is in essence a soluble protein like ASRT and is localized to the membrane because of its close association with Gγ. Upon exchange of the Gα-bound GDP with GTP, triggered by Gα’s interaction with the light-activated rhodopsin, the heterotrimeric complex dissociates into Gα and Gβγ. This dissociated state is the active signaling state in which Gα activates cGMP phosphodiesterase to trigger intracellular signaling cascades until Gα and Gβγ re-associate after GTP hydrolysis by Gα.20 ASRT could be considered equivalent to either Gβ or Gβγ, but there is no Gα-like protein encoded in the ASR-ASRT operon, even though such a GTPase could be transcribed and expressed separately.
Figure 10. Comparison of the structures of Gβ (left) and the ASRT tetramer (right).
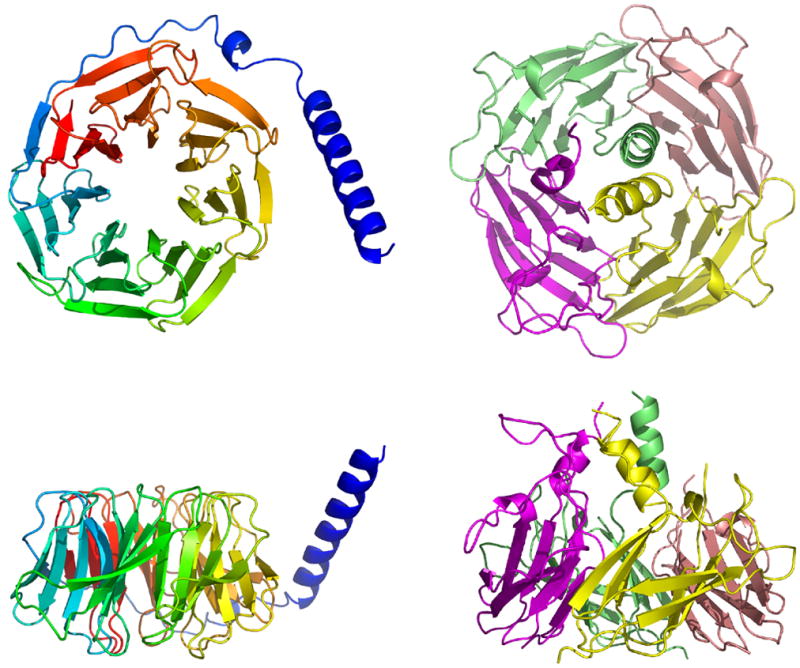
The ASRT tetramer consists of eight small β-sheets of three to four antiparallel β-strands arranged in a circle around the tetramer center. In contrast to the Gβ monomer, the βsheets are supplied in pairs by the four ASRT monomers that form the ASRT tetramer. Additionally, there are loosely structured helices at each of the C-termini of the four ASRT monomers.
The folding pattern of ASRT is completely different from that of Gβ, and the β-sheets are oriented at a relatively low angle towards the plane defined by the symmetry axis compared to the β-sheets in Gβ which have a more upright pose (Figure 10). However similar observations could be made about the rhodopsin receptors of type 1 and 2 associated with these transducers, which are similar in overall structure, yet have no recognizable sequence similarity 21. The two rhodopsin receptors in vertebrates and Anabaena appear to be evolutionarily convergent structures, and to a lesser degree maybe also their respective transducers.
Implications of the ASRT structure for ASR-ASRT signaling
Two possible mechanisms for ASR signaling have been suggested (Sineshchekov et al., 2005). First, the long-lived M intermediate of ASR may function as a signaling state. Such a mechanism would be similar to those of known type 1 and type 2 sensory rhodopsins, in which chemically similar short-wavelength-absorbing photoproducts (M and Meta-II in microbial sensory rhodopsins and the mammalian rod visual pigment, respectively) serve as the signaling forms. A second possible mechanism is based on the fact that ASR exists in two distinct forms (with all-trans and 13-cis retinal), whose ratio depends on light intensity and/or quality. Therefore, one of those forms may be active in signaling, provided the two isomeric forms have different conformations. In either case, ASRT is the only other molecule that is co-transcribed with ASR from their common operon, and thus it seems likely that the signals generated by ASR are transmitted via this transducer. Our four crystal forms of ASRT and the homologous structure of TM1070 from the PDB suggest the possibility for different folding states of ASRT. All have the same β-sandwich fold for the first 100 residues ensuring tetramer formation and providing a stable scaffold; however, not all structures show ordered conformations of the C-terminal 20 residues and the 12-residue loop, which form the α-face of the tetramer. We interpret differing degrees of missing electron density on the α-face of the ASRT tetramer in all crystal forms and the wide range of crystal unit cell sizes we observed as indications that the α-face is relatively flexible and allows different conformation for the C-terminal helices. The apparently flexible 12-residue loop between residues 18 and 31 could adapt to either of these conformations as evidenced by the different conformations observed. Structural changes on the cytoplasmic surface of ASR could in turn induce adoption of different signaling conformations by ASRT. These signaling conformations could either influence ASR interactions with downstream signaling components directly or expose phosphorylation or methylation sites. Considering the variation of unit cell sizes in the P212121 form, it seems that there could be several α-helical states of the α-face and even a β-folded state similar to the one observed in TM1070 might be possible. The signaling conformations of the ASRT tetramer could be metastable and revert back to the initial ASR-binding, non-signaling state with time, or alternatively, through interaction with downstream signaling components depending on the conformation of its α-face. Also, it cannot be ruled out that ASRT molecules in vivo may exist in a monomer-tetramer equilibrium and ASR photoreceptor states may influence this equilibrium, providing another possible signaling mechanism.
Further studies are needed to better define the ASR-ASRT interaction and their signaling consequences, and the availability of atomic resolution detail for each should prove a valuable resource for this goal.
Materials and Methods
Purification, crystallization and phasing of ASRT were described previously.15
Modeling/Refinement
From the SIRAS phasing and molecular replacement solutions obtained as described before15 the programs Arp/Warp22, O23 and Coot24 were used to build the models. The programs REFMAC25, CNS26, LAFIRE27 and PHENIX28 were used to refine the models until R-factors could not be decreased further.
Gel filtration
For determination of the oligomeric state of ASRT in solution ASRT in a buffer of 50 mM Tris pH 8.0 and 300 mM NaCl was run over a Superdex 75 gel filtration column using an Acta FPLC system (Pharmacia Biotech). Ribonuclease A (13.7 kDa), albumin (67 kDa) and blue dextran 2000 from a LMW Gel Filtration Calibration Kit (Amersham Biosciences) were used for size calibration.
Mass spectrometry
For mass spectrometry several crystals of the P4, C2 and P212121 forms were fished from crystallization setups, washed in crystallization buffer and dissolved in 5 μl water. 1 μl saturated sinapic acid solution in a 1:1 (v/v) mixture of water and acetonitrile was mixed with 1μl of each of the dissolved crystal solutions on a mass spectrometry plate and left to dry. MALDI-TOF mass spectrometry was performed with the dried samples on a Voyager-DE STR BioSpectrometry Workstation (PerSeptive Biosystems).
Isothermal titration calorimetric titration
Isothermal titrations were performed on a VP-ITC microcalorimeter (MicroCal, MA, USA) at 32° C. The concentrations of ASR in the cell and ASRT in the syringe were 13.1 mu;M and 760 μM, respectively. Purified proteins were concentrated and dialyzed at 4° against 20 mM Tris buffer containing 150 mM NaCl, pH 7.8. Both proteins were supplemented with dodecylmaltoside at final concentration 0.05%. The concentration of ASR was calculated using an extinction coefficient of 53,000 mol−1cm−1 at 543nm and ASRT concentration was determined using an extinction coefficient of 13,610 mol−1cm−1 at 280 nm. 280 μl ASRT was titrated in 10 μl steps with interval time 5 min into a 1.43 ml solution of ASR. For control titrations detergent containing buffer was used in place of ASR. Data were evaluated by Origin-ITC software.
Acknowledgments
This work was supported by National Institutes of Health Grant R01-GM067808 (HL), a Chancellor’s Fellowship (HL), the Alexander von Humboldt Foundation (HL), the Russian Foundation for Basic Research Grant 05-04-48805 (OAS), National Institutes of Health Grant R37GM27750 (JLS), and the Robert A. Welch Foundation (JLS).
Footnotes
Publisher's Disclaimer: This is a PDF file of an unedited manuscript that has been accepted for publication. As a service to our customers we are providing this early version of the manuscript. The manuscript will undergo copyediting, typesetting, and review of the resulting proof before it is published in its final citable form. Please note that during the production process errors may be discovered which could affect the content, and all legal disclaimers that apply to the journal pertain.
Reference List
- 1.Jung KH, Trivedi VD, Spudich JL. Demonstration of a sensory rhodopsin in eubacteria. Mol Microbiol. 2003;47:1513–22. doi: 10.1046/j.1365-2958.2003.03395.x. [DOI] [PubMed] [Google Scholar]
- 2.Luecke H, Schobert B, Richter HT, Cartailler JP, Lanyi JK. Structural changes in bacteriorhodopsin during ion transport at 2 angstrom resolution. Science. 1999;286:255–61. doi: 10.1126/science.286.5438.255. [DOI] [PubMed] [Google Scholar]
- 3.Lanyi JK, Luecke H. Bacteriorhodopsin. Curr Opin Struct Biol. 2001;11:415–9. doi: 10.1016/s0959-440x(00)00226-8. [DOI] [PubMed] [Google Scholar]
- 4.Kolbe M, Besir H, Essen LO, Oesterhelt D. Structure of the light-driven chloride pump halorhodopsin at 1.8 A resolution. Science. 2000;288:1390–6. doi: 10.1126/science.288.5470.1390. [DOI] [PubMed] [Google Scholar]
- 5.Spudich JL. The multitalented microbial sensory rhodopsins. Trends Microbiol. 2006;14:480–7. doi: 10.1016/j.tim.2006.09.005. [DOI] [PubMed] [Google Scholar]
- 6.Luecke H, Schobert B, Lanyi JK, Spudich EN, Spudich JL. Crystal structure of sensory rhodopsin II at 2.4 angstroms: insights into color tuning and transducer interaction. Science. 2001;293:1499–503. doi: 10.1126/science.1062977. [DOI] [PMC free article] [PubMed] [Google Scholar]
- 7.Royant A, Nollert P, Edman K, Neutze R, Landau EM, Pebay-Peyroula E, Navarro J. X-ray structure of sensory rhodopsin II at 2.1-A resolution. Proc Natl Acad Sci U S A. 2001;98:10131–6. doi: 10.1073/pnas.181203898. [DOI] [PMC free article] [PubMed] [Google Scholar]
- 8.Gordeliy VI, Labahn J, Moukhametzianov R, Efremov R, Granzin J, Schlesinger R, et al. Molecular basis of transmembrane signalling by sensory rhodopsin II-transducer complex. Nature. 2002;419:484–7. doi: 10.1038/nature01109. [DOI] [PubMed] [Google Scholar]
- 9.Vogeley L, Sineshchekov OA, Trivedi VD, Sasaki J, Spudich JL, Luecke H. Anabaena sensory rhodopsin: a photochromic color sensor at 2.0 A. Science. 2004;306:1390–3. doi: 10.1126/science.1103943. [DOI] [PMC free article] [PubMed] [Google Scholar]
- 10.Hoff WD, Jung KH, Spudich JL. Molecular mechanism of photosignaling by archaeal sensory rhodopsins. Annu Rev Biophys Biomol Struct. 1997;26:223–58. doi: 10.1146/annurev.biophys.26.1.223. [DOI] [PubMed] [Google Scholar]
- 11.Sineshchekov OA, Trivedi VD, Sasaki J, Spudich JL. Photochromicity of Anabaena sensory rhodopsin, an atypical microbial receptor with a cis-retinal light-adapted form. J Biol Chem. 2005;280:14663–8. doi: 10.1074/jbc.M501416200. [DOI] [PubMed] [Google Scholar]
- 12.Bennett A, Bogorad L. Complementary chromatic adaptation in a filamentous blue-green alga. J Cell Biol. 1973;58:419–35. doi: 10.1083/jcb.58.2.419. [DOI] [PMC free article] [PubMed] [Google Scholar]
- 13.Mullineaux CW. How do cyanobacteria sense and respond to light? Mol Microbiol. 2001;41:965–71. doi: 10.1046/j.1365-2958.2001.02569.x. [DOI] [PubMed] [Google Scholar]
- 14.Grossman AR, Bhaya D, He Q. Tracking the light environment by cyanobacteria and the dynamic nature of light harvesting. J Biol Chem. 2001;276:11449–52. doi: 10.1074/jbc.R100003200. [DOI] [PubMed] [Google Scholar]
- 15.Vogeley L, Luecke H. Crystallization, X-ray diffraction analysis and SIRAS/molecular-replacenent phasing of three crystal forms of Anabaena sensory rhodopsin transducer. Acta Crystallograph Sect F Struct Biol Cryst Commun. 2006;62:388–91. doi: 10.1107/S1744309106008359. [DOI] [PMC free article] [PubMed] [Google Scholar]
- 16.Pollastri G, Przybylski D, Rost B, Baldi P. Improving the prediction of protein secondary structure in three and eight classes using recurrent neural networks and profiles. Proteins. 2002;47:228–35. doi: 10.1002/prot.10082. [DOI] [PubMed] [Google Scholar]
- 17.Noel JP, Hamm HE, Sigler PB. The 2.2 A crystal structure of transducin-alpha complexed with GTP gamma S. Nature. 1993;366:654–63. doi: 10.1038/366654a0. [DOI] [PubMed] [Google Scholar]
- 18.Lambright DG, Sondek J, Bohm A, Skiba NP, Hamm HE, Sigler PB. The 2.0 A crystal structure of a heterotrimeric G protein. Nature. 1996;379:311–9. doi: 10.1038/379311a0. [DOI] [PubMed] [Google Scholar]
- 19.Sondek J, Bohm A, Lambright DG, Hamm HE, Sigler PB. Crystal structure of a G-protein beta gamma dimer at 2.1A resolution. Nature. 1996 ;379:369–74. doi: 10.1038/379369a0. [DOI] [PubMed] [Google Scholar]
- 20.Arshavsky VY, Lamb TD, Pugh EN., Jr G proteins and phototransduction. Annu Rev Physiol. 2002;64:153–87. doi: 10.1146/annurev.physiol.64.082701.102229. [DOI] [PubMed] [Google Scholar]
- 21.Spudich JL, Yang CS, Jung KH, Spudich EN. Retinylidene proteins: structures and functions from archaea to humans. Annu Rev Cell Dev Biol. 2000;16:365–92. doi: 10.1146/annurev.cellbio.16.1.365. [DOI] [PubMed] [Google Scholar]
- 22.Perrakis A, Harkiolaki M, Wilson KS, Lamzin VS. ARP/wARP and molecular replacement. Acta Crystallogr D Biol Crystallogr. 2001;57:1445–50. doi: 10.1107/s0907444901014007. [DOI] [PubMed] [Google Scholar]
- 23.Jones TA, Bergdoll M, Kjeldgaard M. Crystallographic and Modeling Methods in Molecular Design. Springer-Verlag Press; 1990. O: A macromolecular modeling environment; pp. 189–195. [Google Scholar]
- 24.Emsley P, Cowtan K. Coot: model-building tools for molecular graphics. Acta Crystallogr D Biol Crystallogr. 2004;60:2126–32. doi: 10.1107/S0907444904019158. [DOI] [PubMed] [Google Scholar]
- 25.Murshudov GN, Vagin AA, Dodson EJ. Refinement of macromolecular structures by the maximum-likelihood method. Acta Crystallogr D Biol Crystallogr. 1997;53:240–55. doi: 10.1107/S0907444996012255. [DOI] [PubMed] [Google Scholar]
- 26.Brunger AT, Adams PD, Clore GM, DeLano WL, Gros P, Grosse-Kunstleve RW, et al. Crystallography & NMR system: A new software suite for macromolecular structure determination. Acta Crystallogr D Biol Crystallogr. 1998;54 ( Pt 5):905–21. doi: 10.1107/s0907444998003254. [DOI] [PubMed] [Google Scholar]
- 27.Yao M, Zhou Y, Tanaka I. LAFIRE: software for automating the refinement process of protein-structure analysis. Acta Crystallogr D Biol Crystallogr. 2006;62:189–96. doi: 10.1107/S0907444905038965. [DOI] [PubMed] [Google Scholar]
- 28.Adams PD, Grosse-Kunstleve RW, Hung LW, Ioerger TR, McCoy AJ, Moriarty NW, et al. PHENIX: building new software for automated crystallographic structure determination. Acta Crystallogr D Biol Crystallogr. 2002;58:1948–54. doi: 10.1107/s0907444902016657. [DOI] [PubMed] [Google Scholar]
- 29.Thompson JD, Higgins DG, Gibson TJ. CLUSTAL W: improving the sensitivity of progressive multiple sequence alignment through sequence weighting, position-specific gap penalties and weight matrix choice. Nucleic Acids Res. 1994;22:4673–80. doi: 10.1093/nar/22.22.4673. [DOI] [PMC free article] [PubMed] [Google Scholar]