

Abstract
MicroRNAs (miRNAs) are small (∼22 nucleotide) non-coding RNA strands that base pair with mRNA to degrade it or inhibit its translation. Because sleep and sleep loss induce changes in many mRNA species, we hypothesized that sleep loss would also affect miRNA levels in the brain. Rats were sleep-deprived for 8 h then decapitated; hippocampus, prefrontal and somatosensory cortices and hypothalamus tissues were harvested and frozen in liquid nitrogen. MiRNA was extracted and then characterized using microarrays. Several let-7 miRNA microarray results using hippocampus and prefrontal cortex samples were verified by PCR. From the array data it was determined that about fifty miRNA species were affected by sleep loss. For example, in the hippocampus of sleep-deprived rats, miRNA expression increased compared to cage control samples. In contrast, the majority of miRNA species in the somatosensory and prefrontal cortices decreased, while in the hypothalamus miRNA species were both up- and down-regulated after sleep deprivation. The number of miRNA species affected by sleep loss, their differential expression in separate brain structures and their predicted targets suggest that they have a role in site-specific sleep mechanisms. Current results are, to our knowledge, the first demonstration of the homeostatic process, sleep, altering brain miRNA levels.
MicroRNAs (miRNAs) are a class of small RNAs that regulate mRNA degradation and repress translation in plant and animal cells. MiRNAs bind multiple target mRNA species and are implicated in many biological functions [2]. In particular, miRNA are associated with synaptic plasticity in the brain, affecting processes such as developmental neurogenesis [17, 26], neurite outgrowth [43] and spine morphology [35]. Theories concerning the role of miRNAs in plasticity processes are rapidly developing [24]. MiRNAs are promising targets for modulating synaptic connectivity for several reasons: 1) many miRNA species are expressed in the brain and are structure specific. 2) miRNA/mRNA clusters are found at the synapse [25]. 3) some miRNA species appear to be activity-dependent [3, 24, 35]. 4) miRNAs associate with the RNA-induced silencing complex, a regulator of synaptic protein synthesis linked to memory formation [4].
A modern view of the brain organization of sleep posits that sleep is initiated within neuronal ensembles as a consequence of prior cellular activity. The molecules altered by sleep loss and cellular activity provide the mechanisms for the localization and targeting of sleep as well as for sleep homeostasis [27]. In this paradigm, neural activity triggers the production of sleep regulatory substances, such as tumor necrosis factor alpha (TNFα), that have both immediate and long-term effects in the brain. Sleep regulatory substances act on nearby neurons and glia and alter their electrical properties thereby changing network input-output relationships [8, 37]. At this network level, input-output oscillations manifest as functional state changes; one of these states has been characterized as localized sleep [33]. Local sleep intensity is activity-dependent in humans and animals as measured by EEG delta wave activity and cerebral blood flow [14, 19, 20, 44]. In addition, sleep regulatory substances alter gene expression of molecules (e.g., nerve growth factor, TNFα, interleukin-1 beta) involved in neural connectivity [7, 22, 23]. Further, many reports demonstrate that sleep, sleep loss, and wakefulness alter brain protein [1, 5, 13, 30] and gene expression [9, 18, 41, 42] including sleep regulatory substances [29]. The ability of miRNAs to interfere with mRNA translation gave rise to the hypothesis that sleep deprivation would produce concomitant changes of miRNA levels in the brain. We report herein that sleep loss is associated with region-specific changes in miRNA expression.
MATERIALS AND METHODS
Animals
Animal use was in compliance with NIH standards and approved by Washington State University's Institutional Animal Care and Use Committee. All protocols were designed to minimize animal discomfort. Thirty male Sprague Dawley rats (250-325 g; Taconic Laboratories, Hudson, NY) were housed in an AAALAC-approved vivarium on a 12 h light-dark cycle initiated at 0800 h, at 22 ± 1° C, with free access to food (Harlan, Madison, WI) and water. Rats were acclimated to their home room for a minimum of seven days proceeding sleep deprivation. Two experiments that differed in their miRNA analysis were performed. In the first experiment, beginning at light onset four rats were sleep-deprived (SD) for 8 h using gentle brush strokes when necessary to keep them awake and then euthanized. Four cage control CC rats were euthanized at the same time of day. A CC rat was matched with an SD rat. After euthanization, the hypothalamus, hippocampus, prefrontal (PFC) and somatosensory cortices were dissected, frozen in liquid nitrogen and stored at −80° C until extraction. In the second experiment 22 rats were used for primer-extension quantitative polymerase chain reaction (PEq-PCR). Rats were treated identical to those in experiment 1.
RNA Extraction
MicroRNAs were extracted with the mirVana™ miRNA Isolation Kit (manual #0503; Ambion, Austin, TX) according to the manufacturer's instructions. This procedure yields an RNA fraction of RNA species of less than 200 bp. Yield and purity of RNA was by measured by UV absorbance at OD260/280. In experiment 1, extracts used for microarrays were enriched through fractionation by polyacrylamide electrophoresis using the flashPAGE™ apparatus (Ambion); RNA species less than 40 bp were collected. Starting quantities of enriched small RNAs varied between structures (5.8-7.2 μg for hippocampus; 3.7-5.5 μg for the PFC; 4.1-5.3 μg for somatosensory cortex; and 2.1-3.6 μg for hypothalamus). However, equal amounts of miRNA extracts from CC and SD samples were applied to individual microarray slides. In second experiment, the small RNA fraction (less than 200 bp) was used for PE-qPCR. In this experiment, RNA samples obtained from the hippocampus (n = 11 SD and n = 11 CC) and the PFC (n = 8 SD and n =8 CC) were analyzed; six PFC samples (3 sleep deprived, 3 control) with low abundance and/or purity were eliminated from the second experiment.
MiRNA Microarray Expression Analyses
Enriched miRNA from CC or SD extracts were labeled with Cy5 (GE Healthcare, Little Chalfont St. Giles, Bucks, UK) using the mirVana™ miRNA Labeling Kit (manual #0603) according to the manufacturer's instructions and hybridized to mirVana™ V2 Bioarray slides (manual #0607; Ambion). The slides have 2 separate arrays, each with probes for 640 miRNA sequences, and individual arrays have quadruplicate spots for every miRNA probe. Four slides per brain region were used and each slide contained miRNA extracts from one CC and one SD rat, thus each slide represents an independent experiment in its own right.
Arrays were scanned with a ScanArray® 4000 (Perkin Elmer, Wellesley, MA) at a 5 μm resolution and saved in the TIFF file format. TIFF files were analyzed with GenePix Pro 6.0 using the 635 nm wavelength setting. Imported array templates were aligned to both arrays and then: 1) A local background subtraction function standardized inconsistent background pixel intensities in the 400 pixel circular perimeter of each feature spot. 2) A 156 pixel area was superimposed on each feature spot and the mean intensity of these 156 pixels was calculated. 3) These values were normalized by subtracting the mean pixel intensities of the 18 positive control spots on the CC array from the 18 positive control spots on the SD array, dividing by two and this quotient, or its reciprocal, became the standardization ratio for both arrays on a given slide. 4) The normalized spot intensity at each x, y coordinate of an array was averaged with the spot at the same position on the other three arrays of separate rat extracts in the same condition. Paired t-tests were performed on these data using Excel 2003. The ratios of these values (SD/CC) were calculated and ratios less than one were adjusted to a negative reciprocal to depict the fold change in miRNA species elicited by sleep deprivation (Table 1).
Table 1. Fold change (± SEM) in microRNAs from four brain structures resulting from sleep loss.
Data are expressed as the average ratio (sleep-deprived/cage control) of normalized mean pixel intensities. The negative reciprocal is reported for ratios less than one. Each value was obtained from four independent determinations. Bold typed miRNA species meet all three exclusion criteria.
| miRNA | Hippocampus | Prefrontal Cortex | Somatosensory Cortex |
Hypothalamus |
|---|---|---|---|---|
| ambi_miR_13124 | 2.05 (± 0.78) *** | −2.01 (± 0.05) ** | −1.77 (± 0.13) *** | −1.12 (± 0.34) |
| ambi_miR_13193 | 3.31 (± 0.99) *** | −1.01 (± 0.32) | −1.37 (± 0.25) * | 2.62 (± 0.68) |
| ambi_miR_13232 | 1.06 (± 0.16) | −1.55 (± 0.20) ** | −1.31 (± 0.17) * | −1.33 (± 1.04) |
| ambi_miR_917 | 1.26 (± 0.18) ** | 1.17(± 0.12) | 1.65 (± 0.51) ** | 1.18 (± 0.48) |
| hsa_let_7a | 2.16 (± 0.92) ** | −2.55 (± 0.48) ** | −2.04 (± 0.04) ** | 1.12 (± 0.32) |
| hsa_let_7b | 1.53 (± 0.27) *** | −2.50 (± 0.15) ** | −1.57 (± 0.15) ** | −2.38 (± 0.03) ** |
| hsa_let_7c | 2.00 (± 0.45) *** | −1.36 (± 0.44) * | −1.32 (± 0.09) | −1.15 (± 0.35) |
| hsa_let_7d | 2.19 (± 0.58) *** | −1.28 (± 0.39) * | −1.51 (± 0.17) ** | 1.09 (± 0.34) |
| hsa_let_7e | 2.89 (± 0.81) *** | 1.22 (± 0.64) | 1.04 (± 0.27) | 2.32 (± 1.17) ** |
| hsa_miR_100 | 2.33 (± 0.59) *** | −1.43 (± 0.14) | −1.39 (± 0.32) | 1.63 (± 0.51) |
| hsa_miR_103 | 1.54 (± 0.16) *** | −1.67 (± 0.11) * | −1.06 (± 0.21) | 1.67 (± 0.42) * |
| hsa_miR_107 | 1.96 (± 0.32) ** | −1.68 (± 0.12) * | −1.09 (± 0.24) | 1.53 (± 0.27) * |
| hsa_miR_125a | 2.39 (± 0.56) *** | −1.69 (± 0.12) ** | −1.58 (± 0.02) * | −1.57 (± 0.41) * |
| hsa_miR_125b | 1.60 (± 0.22) *** | 1.17(± 0.16) | 1.15 (± 0.07) | 1.27 (± 0.60) |
| hsa_miR_126 | 1.63 (± 0.30) *** | −1.69 (± 0.15) ** | −2.06 (± 0.10) ** | −1.50 (± 0.17) |
| hsa_miR_127 | 2.00 (± 0.36) *** | −2.71 (± 0.08) *** | −1.55 (± 0.11) ** | −1.54 (± 0.17) |
| hsa_miR_128a | 2.23 (± 0.65) *** | 2.04 (± 0.56) ** | 1.01 (± 0.15) | 1.63 (± 0.55) |
| hsa_miR_128b | 1.47 (± 0.39) *** | −1.32 (± 0.25) ** | −1.70 (± 0.11) ** | −2.29 (± 0.12) ** |
| hsa_miR_132 | 1.82 (± 0.37) *** | −1.91 (± 0.12) ** | −1.71 (± 0.05) ** | −1.64 (± 0.13) * |
| hsa_miR_138 | 2.44 (± 0.72) *** | −3.35 (± 0.12) *** | −2.35 (± 0.19) *** | −1.82 (± 0.34) * |
| hsa_miR_139 | 2.49 (± 0.63) *** | 1.19 (± 0.41) | 1.08 (± 0.07) | 2.31 (± 0.50) * |
| hsa_miR_143 | 2.64 (± 0.60) *** | −1.49 (± 0.25) ** | −1.52 (± 0.32) ** | 1.19 (± 0.33) |
| hsa_miR_145 | 2.38 (± 0.42) *** | −1.95 (± 0.05) ** | 1.03 (± 0.25) | 1.09 (± 0.84) |
| hsa_miR_150 | 2.43 (± 0.44) *** | −1.23 (± 0.26) | 1.20 (± 0.19) | 2.54 (± 1.48) |
| hsa_miR_16 | 4.07 (± 1.58) *** | −1.63 (± 0.35) * | −1.56 (± 0.17) * | 1.70 (± 0.44) |
| hsa_miR_181a | 2.08 (± 0.34) *** | 1.01 (± 0.17) | 1.17 (± 0.17) | 1.51 (± 0.60) * |
| hsa_miR_181b | 3.14 (± 0.96) *** | −1.41 (± 0.31) * | −1.54 (± 0.13) * | 1.20 (± 0.56) |
| hsa_miR_185 | 2.00 (± 0.58) *** | −2.70 (± 0.13) ** | −1.94 (± 0.13) ** | −1.96 (± 0.20) ** |
| hsa_miR_191 | 1.66 (± 0.21) *** | −1.06 (± 0.11) | 1.21 (± 0.19) | 1.97 (± 0.68) ** |
| hsa_miR_22 | 1.72 (± 0.38) *** | 1.07 (± 0.17) | −1.09 (± 0.22) | 2.82 (± 0.52) |
| hsa_miR_222 | 1.57 (± 0.27) *** | −1.79 (± 0.03) ** | −1.14 (± 0.09) | 1.37 (± 0.21) |
| hsa_miR_23a | 3.60 (± 0.92) *** | 1.32 (± 0.03) * | 1.08 (± 0.22) | 2.43 (± 0.39) |
| hsa_miR_23b | 2.37 (± 0.43) *** | 1.40 (± 0.53) | 1.04 (± 0.19) | 1.41 (± 0.44) |
| hsa_miR_24 | 1.86 (± 0.40) *** | −2.34 (± 0.10) *** | −2.34 (± 0.14) *** | −1.27 (± 0.23) |
| hsa_miR_26a | 2.57 (± 0.66) *** | −1.32 (± 0.44) * | −1.69 (± 0.14) ** | −1.38 (± 0.42) |
| hsa_miR_27b | 2.62 (± 0.65) *** | −2.82 (± 0.06) ** | −2.79 (± 0.13) *** | −1.47 (± 0.19) |
| hsa_miR_29a | 2.69 (± 0.72) *** | 1.57 (± 0.84) * | −1.45 (± 0.11) | 1.45 (± 0.82) * |
| hsa_miR_30a_5p | 1.70 (± 0.38) *** | −2.16 (± 0.07) *** | −2.20 (± 0.08) * | −1.13 (± 0.47) |
| hsa_miR_30c | 2.34 (± 0.85) *** | 1.08 (± 0.27) | −1.02 (± 0.29) | 2.46 (± 0.53) |
| hsa_miR_30d | 1.64 (± 0.18) *** | −1.75 (± 0.21) | −1.09 (± 0.10) | 1.86 (± 0.25) * |
| hsa_miR_30e_5p | 2.08 (± 0.47) *** | 1.19 (± 0.34) * | 1.09 (± 0.30) | 3.31 (± 1.09) |
| hsa_miR_342 | 1.55 (± 0.19) *** | −1.27 (± 0.14) | −1.06 (± 0.02) | 1.74 (± 0.74) |
| hsa_miR_422b | 1.61 (± 0.06) ** | −2.05 (± 0.09) ** | −1.01 (± 0.26) | 2.24 (± 0.35) |
| hsa_miR_487b | 1.78 (± 0.38) *** | −1.51 (± 0.30) | −1.72 (± 0.31) ** | 1.31 (± 0.32) |
| hsa_miR_99a | 2.62 (± 0.66) *** | 1.17 (± 0.20) | 1.21 (± 0.27) | 1.63 (± 0.64) |
| hsa_miR_99b | 2.91 (± 0.96) *** | −1.78 (± 0.10) *** | −1.23 (± 0.23) | 1.10 (± 0.60) |
| mmu_let_7a | 2.31 (± 0.98) *** | −2.19 (± 0.48) *** | −1.92 (± 0.04) * | −1.10 (± 0.32) |
| mmu_miR_127 | 1.89 (± 0.33) *** | −2.38 (± 0.10) ** | −1.08 (± 0.13) | 1.29 (± 0.24) |
| mmu_miR_221 | 2.78 (± 0.79) *** | 1.05 (± 0.45) | 1.22 (± 0.20) | 1.25 (± 1.87) |
| mmu_miR_487b | 1.71 (± 0.34) ** | −1.80 (± 0.20) *** | −1.41 (± 0.15) * | 6.97 (± 3.54) |
| mmu_miR_99a | 2.13 (± 0.70) ** | −1.95 (± 0.04) *** | −2.05 (± 0.21) ** | −1.96 (± 0.11) * |
| rno_miR_422b | 1.61 (± 0.37) ** | −2.40 (± 0.08) *** | −1.55 (± 0.25) * | 1.97 (± 0.95) |
MiRNA species in normal type are included for comparison with the caveat that they are excluded by signal-to-noise, difference and/or ratio criteria
= p < 0.05
= p < 0.01
= p < 0.001.
Elimination criteria were constructed to detect veridical changes between sleep-deprived and control miRNA levels. First, a spot's average signal-to-noise ratio (SNR) was greater than two. Second, the minimum difference between the CC and SD average pixel intensity of each miRNA was at least 10% of the average of the top two miRNA difference scores. Third, the adjusted ratios were greater than 1.5 or less than -1.5 for inclusion. Fourth, statistical significance was obtained with an alpha of less than 0.05.
MiRNA Detection by PE-qPCR
To measure let-7 miRNAs by PE-qPCR, we followed the primer extension method recently developed [32]. We examined let-7b -7c and -7d because they are expressed in brain at higher levels than other let-7 subtypes. The let-7 primers consisted of the Universal Primer sequence, CATGATCAGCTGGGCCAAGA, plus AACCACAC for let-7b, AACCATAC for let-7c and ACTATGCA for let-7d. This method uses locked nucleic acids (LNA) incorporated into the reverse primer sequences to increase the Tm of short length primers (∼15 bases). LNA primers sequences for let-7s were: T+GA+GGTAGTAGGTTG; T+GA+GGTAGTAGGTTG; and A+GA+GG+AGTAGGTTG for let-7 b-d, respectively (Integrated DNA Technologies, Coralville, IA).
Ribogreen (Invitrogen, Carlsbad, CA) was used to equalize miRNA concentrations by successive dilutions in extracts used for PE-qPCR. The reverse transcription reaction contained the following: 4 μl of 0.5 μM primer, 4 μl of miRNA, 4 μl of DEPC-treated water, 4 μl of 5X reaction buffer, 1 μl of 0.1 M DTT, 1 μl of 10 mM dNTP, 1 μl of RNAseOUT and 1 μl Superscript III. The mixture was incubated at 50° C for 30 min, followed by 85° C for 5 min. cDNA was diluted 10-fold in TE buffer (10 mM Tris [pH=7.5], 0.1 mM EDTA). Five μl of the diluted cDNA was added per PCR reaction. An iCycler iQ Multi-Color Detection System (BioRad, Hercules, CA) with the filter set at 490 was used to detect SYBR fluorescence.
Samples were assayed in triplicate and normalized to ribosomal 5S values (obtained using manufacturer's instructions for the mirVana™ qRT-PCR miRNA Detection Kit; manual #0610; Ambion). Each PCR reaction mix contained: 5 μl of cDNA, 3.25 μl of water, 0.25 μl of 1:1000 dilution of Fluoroscein (Bio-Rad), 2 μl of 10 μM universal primer, 2 μl of 10 μM LNA reverse primer and 12.5 μl of 2X SYBR green PCR mix (Applied Biosystems, Foster City, CA). The cycling conditions were: 95° C for 10 min followed by 40 cycles of 95° C for 15 seconds, 54° for 15 sec, 72° C for 15 sec. The melt curve (for distinguishing PCR products from primer-dimer formations) was generated by heating PCR products at 95° C for 1 min then decreasing to 55° C for 1 min, and incrementally increasing 0.5° C every 10 sec to 95° C.
For PE-qPCR data, Excel 2003 was used to perform t-tests on the delta Ct values, where delta Ct equals the triplicate mean cycle threshold (Ct) for SD animals minus triplicate mean Ct for CC animals. Delta Ct values represent PCR cycle differences between let-7b, -7c, or 7d and ribosomal 5S, in exponential form; 2−ΔΔCt represents linear fold changes in samples from SD animals relative to CC samples.
RESULTS
The greatest number of sleep loss-induced miRNA changes was observed in the hippocampus. After the first criterion (SNR > 2) was applied, only 62 of 640 miRNA remained under consideration. Following criterion 2 the number was reduced to 56. The third criterion eliminated another 4 miRNA species leaving 52, out of which 3 were not statistically significant. Thus, a total of 49 miRNA species were judged to be up-regulated in the hippocampus by sleep loss (Table 1).
In the PFC, 602 of 640 miRNA species were eliminated via the first criterion followed by an additional 6, 9 and 2 by criteria 2, 3 and 4, respectively. Hence, in the PFC 19 miRNA species were significantly down-regulated after SD while miR-128a and miR-29a were determined to be up-regulated. In the somatosensory cortex, 58 of 640 miRNA species remained after applying the first criterion, 31 after the second, and 22 after the third, all of which were statistically significant. Similar to the PFC, the majority of the remaining miRNA species were significantly decreased after SD in the somatosensory cortex; 21 miRNA species were significantly decreased and only miR-917 manifested a significant increase.
In hypothalamic extracts, miRNAs were lower in abundance and 621 of 640 were eliminated by the SNR criterion. An additional 2 miRNAs were eliminated by the difference criterion and 7 more did not meet the ratio criterion. Two of the remaining 10 were not statistically significant resulting in five miRNA species significantly up-regulated (let-7e, miR-30d, -103, -107, and -181a) and three significantly down-regulated (let-7b, miR-125a and -128b) after SD.
Several interesting trends emerged from the microarray data: 1) Let-7b and miR-125a were the only two miRNA species that met all elimination criteria and significantly changed in all four brain structures. 2) All of the miRNA species that were down regulated in the cortex were up-regulated in the hippocampus, except miR-128a and 29a. 3) The directionality of miRNA levels in the somatosensory cortex is consistent with that of the PFC in the 12 co-expressed miRNA species (e.g., let-7b, miR-16, -125a, -132).
PE-qPCR performed on let-7 subtypes using hippocampus and PFC samples supported the microarray findings (Fig. 1). In the hippocampus, let-7b through -7d increased with SD, however, only let-7b (t19 = 1.95, p< 0.05) and let-7d (t19 = 2.14, p< 0.05) were statistically significant. In the PFC, both let-7b and -7c were attenuated by SD, but only let-7c (t13 = 2.55, p< 0.05) manifest statistical significance.
Figure 1. Primer extension-quantitative PCR of let-7 expression following sleep-deprivation.
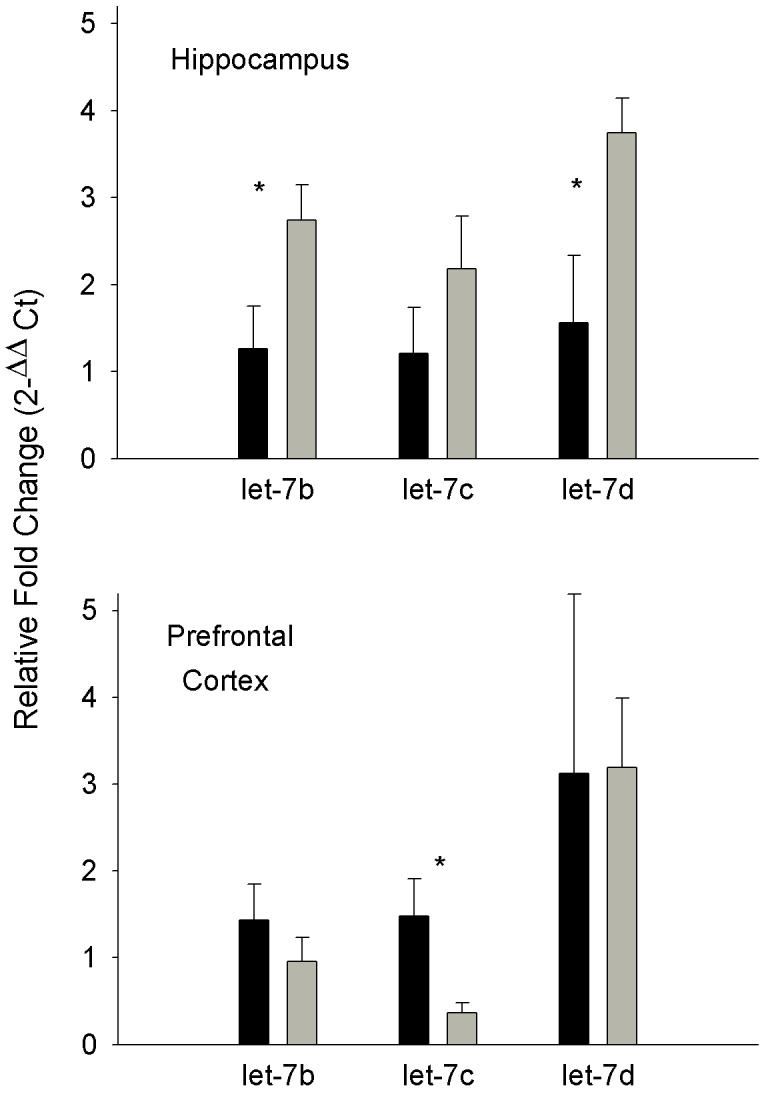
Mean (± SEM) let-7 expression of cage controls (dark bars) and rats sleep-deprived for 8 h (light bars) in the hippocampus (upper panel; n = 11) and prefrontal cortex (lower panel; n = 8). Asterisk indicates p < 0.05.
DISCUSSION
The two major findings reported herein are that sleep loss is associated with changes in expression of about 50 miRNA species and that the specific miRNAs that changed and the direction of change is dependent upon the brain area examined. These data are the first step in a much larger experimental process needed to establish if miRNAs are involved in site-specific translational regulation of mRNA species and their subsequent protein expression for molecules involved in either sleep regulation or in the fulfillment of sleep function. Nevertheless, current data provide an attractive list of miRNA species because sequence alignment analyses (http://cbio.mskcc.org/cgi-bin/mirnaviewer/mirnaviewer.pl#mirna) of many miRNA species altered by SD, including let-7s, demonstrate complementarities with key sleep regulatory substances such as TNFα, interleukins and IkB, an inhibitor of nuclear factor kappa B. For instance, SD procedures similar to those used in the present study result in enhanced cortical TNF protein [40] and inhibition of TNF, e.g. using siRNAs, inhibits electroencephalographic delta power, an indicator of sleep intensity [40]. In brain, TNF acts in the plasticity scaling process [37] and its neuronal expression is dependent upon prior activity (e.g. prolonged whisker stimulation enhances the number of TNF-immuno-positive cells in layers II-IV in the somatosensory cortex that received the afferent input [15]). Such data suggest that TNF is involved in sleep regulation and sleep organization and current data add to this literature because the miRNAs identified as being altered by sleep loss may provide an additional level of regulation to TNF-sleep relationships.
The sleep-loss induced changes in hippocampal and cortical miRNA species reported herein suggest a role for miRNA in the relationship between sleep and memory. One highly expressed neural-specific miRNA, miR-125a, is altered in all four tissues following prolonged wakefulness. MiR-125a has an extensive list of sequence alignments with plasticity-related molecules with purported roles in sleep (e.g. NGFI-A [9], BDNF [18] and T-type calcium channels [6]). Another miRNA, miR-132, is also perturbed after sleep loss in both the hippocampus and cortex. Unlike miR-125, miR-132 is directly implicated as a mediator of synaptic plasticity. For instance, miR-132 is induced by neurotrophic factors and is regulated by CREB [43]. MiR-132 expression enhances neurite growth and inhibition of miR-132 curtails the growth of these extensions [43]. Thus, the attenuation of miR-132 in the PFC following SD could potentially compromise regional synaptic plasticity. Sleep is posited to influence neural connectivity [6, 21, 27, 28] including gene and protein regulation germane to memory formation and consolidation [11, 12, 31, 36, 38]; miRNA may regulate these processes [35, 39, 45].
That several miRNA species expressed in the hippocampus and PFC are altered in opposite directions by SD is intriguing. Similar bidirectional differences between the hippocampus and the PFC are observed in long-term potentiation following SD [34], and may represent structure-specific memory functions (e.g. short-term vs. long-term storage). The complexity of miRNA regulation is illustrated by their numerous putative targets. Further, the task of target prediction is compounded when multiple miRNA species are requisite for activity. The net result to the biological relevance of a particular miRNA function is determined by the mRNA targets. For example, an increase in miR-132 (as observed in the hippocampus) could also hinder plasticity by down-regulating its predicted rhoGAP gene target which is involved with catenin-N-cadherin and NMDA receptor signaling. Thus, miRNA presence in two structures could be expressed as polar opposites, but maintain the same net biological effect.
In many microarray studies of cDNA prepared from mRNA, PCR is used to verify the array results (e.g. [42]). PCR is inherently variable due to the many cycles of amplification. To use PCR to verify miRNA levels, it is necessary to add a step of strand elongation for PE-qPCR [32]; this increases the variability of the subsequent PCR amplification cycles. Thus, verification by PCR is in our view less reliable than miRNA microarray analyses [10]. PE-qPCR performed was consistent with the array data, let-7 levels were elevated in the hippocampus and let-7b and -7c decreased in the PFC; statistical significance was reached only with the hippocampal let-7b and -7d and the PFC let-7c data due to high variance.
One caveat relevant to the current results is the difficulty in isolating sleep as an independent variable, thus exclusively ascribing changes in miRNA to sleep per se is speculative. There are numerous concurrent physiological changes that accompany sleep and the changes in miRNA observed may reflect processes such as increased stress and/or stimulation due to the SD procedure [16]. Indeed, future experiments need to characterize miRNA expression during periods of extended sleep whether induced by methods such as acute increases in ambient temperature [41] or by pathology. Identifying the specific miRNA targets and their effectors will also be necessary in elucidating the relationship between sleep and miRNA. Regardless, current results indicate that sleep loss differentially alters miRNA expression in various brain regions. The hypothesis that miRNAs regulate synaptic plasticity and sleep regulatory substances is exciting because it provides a way to link the molecular mechanisms of sleep and memory. In addition, miRNA offers a novel approach for investigating sleep-related memory events such as memory replay during sleep [31] and the targeting of sleep to areas disproportionately activated during prior waking [27].
Acknowledgements
This research was supported by the National Institutes of Health grant numbers NS25378 and NS31453 to J. M. K.
Footnotes
Publisher's Disclaimer: This is a PDF file of an unedited manuscript that has been accepted for publication. As a service to our customers we are providing this early version of the manuscript. The manuscript will undergo copyediting, typesetting, and review of the resulting proof before it is published in its final citable form. Please note that during the production process errors may be discovered which could affect the content, and all legal disclaimers that apply to the journal pertain.
REFERENCES
- 1.Adam K, Oswald I. Protein synthesis, bodily renewal and the sleep-wake cycle. Clin Sci. 1983;65:561–567. doi: 10.1042/cs0650561. [DOI] [PubMed] [Google Scholar]
- 2.Ambros V. The functions of animal microRNAs. Nature. 2004;431:350–355. doi: 10.1038/nature02871. [DOI] [PubMed] [Google Scholar]
- 3.Ashraf SI, Kunes S. A trace of silence: memory and microRNA at the synapse. Curr Opin Neurobiol. 2006;16:535–539. doi: 10.1016/j.conb.2006.08.007. [DOI] [PubMed] [Google Scholar]
- 4.Ashraf SI, McLoon AL, Sclarsic SM, Kunes S. Synaptic protein synthesis associated with memory is regulated by the RISC pathway in Drosophila. Cell. 2006;124:191–205. doi: 10.1016/j.cell.2005.12.017. [DOI] [PubMed] [Google Scholar]
- 5.Basheer R, Brown R, Ramesh V, Begum S, McCarley RW. Sleep deprivation-induced protein changes in basal forebrain: implications for synaptic plasticity. J Neurosci Res. 2005;82:650–658. doi: 10.1002/jnr.20675. [DOI] [PubMed] [Google Scholar]
- 6.Benington JH, Frank MG. Cellular and molecular connections between sleep and synaptic plasticity. Prog Neurobiol. 2003;69:71–101. doi: 10.1016/s0301-0082(03)00018-2. [DOI] [PubMed] [Google Scholar]
- 7.Churchill L, Taishi P, Wang M, Brandt J, Cearley C, Rehman A, Krueger JM. Brain distribution of cytokine mRNA induced by systemic administration of interleukin-1beta or tumor necrosis factor alpha. Brain Res. 2006;1120:64–73. doi: 10.1016/j.brainres.2006.08.083. [DOI] [PubMed] [Google Scholar]
- 8.Churchill L, Yasuda K, Yasuda T, Blindheim KA, Falter M, Garcia-Garcia F, Krueger JM. Unilateral cortical application of tumor necrosis factor alpha induces asymmetry in Fos- and interleukin-1beta-immunoreactive cells within the corticothalamic projection. Brain Res. 2005;1055:15–24. doi: 10.1016/j.brainres.2005.06.052. [DOI] [PubMed] [Google Scholar]
- 9.Cirelli C, Gutierrez CM, Tononi G. Extensive and divergent effects of sleep and wakefulness on brain gene expression. Neuron. 2004;41:35–43. doi: 10.1016/s0896-6273(03)00814-6. [DOI] [PubMed] [Google Scholar]
- 10.Couzin J. Genomics. Microarray data reproduced, but some concerns remain. Science. 2006;313:1559. doi: 10.1126/science.313.5793.1559a. [DOI] [PubMed] [Google Scholar]
- 11.Crick F, Mitchison G. The function of dream sleep. Nature. 1983;304:111–114. doi: 10.1038/304111a0. [DOI] [PubMed] [Google Scholar]
- 12.Davis BD. Sleep and the maintenance of memory. Perspect Biol Med. 1985;28:457–464. doi: 10.1353/pbm.1985.0003. [DOI] [PubMed] [Google Scholar]
- 13.Davis CJ, Meighan PC, Taishi P, Krueger JM, Harding JW, Wright JW. REM sleep deprivation attenuates actin-binding protein cortactin: a link between sleep and hippocampal plasticity. Neurosci Lett. 2006;400:191–196. doi: 10.1016/j.neulet.2006.02.046. [DOI] [PubMed] [Google Scholar]
- 14.Ferrara M, De Gennaro L, Curcio G, Cristiani R, Bertini M. Regional differences of the temporal EEG dynamics during the first 30 min of human sleep. Neurosci Res. 2002;44:83–89. doi: 10.1016/s0168-0102(02)00085-8. [DOI] [PubMed] [Google Scholar]
- 15.Fix C, Churchill L, Hall S, Krueger JM. The number of tumor necrosis factor alpha-immunoreactive cells increases in layer IV of the barrel field in response to whisker deflection in the rats. Sleep. 2006;29:A11. [Google Scholar]
- 16.Gip P, Hagiwara G, Sapolsky RM, Cao VH, Heller HC, Ruby NF. Glucocorticoids influence brain glycogen levels during sleep deprivation. Am J Physiol Regul Integr Comp Physiol. 2004;286:R1057–1062. doi: 10.1152/ajpregu.00528.2003. [DOI] [PubMed] [Google Scholar]
- 17.Giraldez AJ, Cinalli RM, Glasner ME, Enright AJ, Thomson JM, Baskerville S, Hammond SM, Bartel DP, Schier AF. MicroRNAs regulate brain morphogenesis in zebrafish. Science. 2005;308:833–838. doi: 10.1126/science.1109020. [DOI] [PubMed] [Google Scholar]
- 18.Guzman-Marin R, Ying Z, Suntsova N, Methippara M, Bashir T, Szymusiak R, Gomez-Pinilla F, McGinty D. Suppression of hippocampal plasticity-related gene expression by sleep deprivation. J Physiol. 2006;575:807–819. doi: 10.1113/jphysiol.2006.115287. [DOI] [PMC free article] [PubMed] [Google Scholar]
- 19.Huber R, Ghilardi MF, Massimini M, Ferrarelli F, Riedner BA, Peterson MJ, Tononi G. Arm immobilization causes cortical plastic changes and locally decreases sleep slow wave activity. Nat Neurosci. 2006;9:1169–1176. doi: 10.1038/nn1758. [DOI] [PubMed] [Google Scholar]
- 20.Kattler H, Dijk DJ, Borbely AA. Effect of unilateral somatosensory stimulation prior to sleep on the sleep EEG in humans. J Sleep Res. 1994;3:159–164. doi: 10.1111/j.1365-2869.1994.tb00123.x. [DOI] [PubMed] [Google Scholar]
- 21.Kavanau JL. Memory, sleep, and dynamic stabilization of neural circuitry: evolutionary perspectives. Neurosci Biobehav Rev. 1996;20:289–311. doi: 10.1016/0149-7634(95)00019-4. [DOI] [PubMed] [Google Scholar]
- 22.Kelly A, Conroy S, Lynch MA. Evidence that nerve growth factor plays a role in long-term potentiation in the rat dentate gyrus. Neuropharmacology. 1998;37:561–570. doi: 10.1016/s0028-3908(98)00048-3. [DOI] [PubMed] [Google Scholar]
- 23.Kelly A, Vereker E, Nolan Y, Brady M, Barry C, Loscher CE, Mills KH, Lynch MA. Activation of p38 plays a pivotal role in the inhibitory effect of lipopolysaccharide and interleukin-1 beta on long term potentiation in rat dentate gyrus. J Biol Chem. 2003;278:19453–19462. doi: 10.1074/jbc.M301938200. [DOI] [PubMed] [Google Scholar]
- 24.Kosik KS. The neuronal microRNA system. Nat Rev Neurosci. 2006;7:911–920. doi: 10.1038/nrn2037. [DOI] [PubMed] [Google Scholar]
- 25.Krichevsky AM, Kosik KS. Neuronal RNA granules: a link between RNA localization and stimulation-dependent translation. Neuron. 2001;32:683–696. doi: 10.1016/s0896-6273(01)00508-6. [DOI] [PubMed] [Google Scholar]
- 26.Krichevsky AM, Sonntag KC, Isacson O, Kosik KS. Specific microRNAs modulate embryonic stem cell-derived neurogenesis. Stem Cells. 2006;24:857–864. doi: 10.1634/stemcells.2005-0441. [DOI] [PMC free article] [PubMed] [Google Scholar]
- 27.Krueger JM, Obal F. A neuronal group theory of sleep function. J Sleep Res. 1993;2:63–69. doi: 10.1111/j.1365-2869.1993.tb00064.x. [DOI] [PubMed] [Google Scholar]
- 28.Krueger JM, Obal F., Jr. Sleep function. Front Biosci. 2003;8:d511–519. doi: 10.2741/1031. [DOI] [PubMed] [Google Scholar]
- 29.Krueger JM, Obal FJ, Fang J, Kubota T, Taishi P. The role of cytokines in physiological sleep regulation. Ann N Y Acad Sci. 2001;933:211–221. doi: 10.1111/j.1749-6632.2001.tb05826.x. [DOI] [PubMed] [Google Scholar]
- 30.Naidoo N, Giang W, Galante RJ, Pack AI. Sleep deprivation induces the unfolded protein response in mouse cerebral cortex. J Neurochem. 2005;92:1150–1157. doi: 10.1111/j.1471-4159.2004.02952.x. [DOI] [PubMed] [Google Scholar]
- 31.Poe GR, Nitz DA, McNaughton BL, Barnes CA. Experience-dependent phase-reversal of hippocampal neuron firing during REM sleep. Brain Res. 2000;855:176–180. doi: 10.1016/s0006-8993(99)02310-0. [DOI] [PubMed] [Google Scholar]
- 32.Raymond CK, Roberts BS, Garrett-Engele P, Lim LP, Johnson JM. Simple, quantitative primer-extension PCR assay for direct monitoring of microRNAs and short-interfering RNAs. RNA. 2005;11:1737–1744. doi: 10.1261/rna.2148705. [DOI] [PMC free article] [PubMed] [Google Scholar]
- 33.Rector DM, Topchiy IA, Carter KM, Rojas MJ. Local functional state differences between rat cortical columns. Brain Res. 2005;1047:45–55. doi: 10.1016/j.brainres.2005.04.002. [DOI] [PubMed] [Google Scholar]
- 34.Romcy-Pereira R, Pavlides C. Distinct modulatory effects of sleep on the maintenance of hippocampal and medial prefrontal cortex LTP. Eur J Neurosci. 2004;20:3453–3462. doi: 10.1111/j.1460-9568.2004.03808.x. [DOI] [PubMed] [Google Scholar]
- 35.Schratt GM, Tuebing F, Nigh EA, Kane CG, Sabatini ME, Kiebler M, Greenberg ME. A brain-specific microRNA regulates dendritic spine development. Nature. 2006;439:283–289. doi: 10.1038/nature04367. [DOI] [PubMed] [Google Scholar]
- 36.Smith C. Sleep states, memory processes and synaptic plasticity. Behav Brain Res. 1996;78:49–56. doi: 10.1016/0166-4328(95)00218-9. [DOI] [PubMed] [Google Scholar]
- 37.Stellwagen D, Malenka RC. Synaptic scaling mediated by glial TNF-alpha. Nature. 2006;440:1054–1059. doi: 10.1038/nature04671. [DOI] [PubMed] [Google Scholar]
- 38.Stickgold R, Hobson JA, Fosse R, Fosse M. Sleep, learning, and dreams: Off-line memory reprocessing. Science. 2001;294:1052–1057. doi: 10.1126/science.1063530. [DOI] [PubMed] [Google Scholar]
- 39.Strauss WM, Chen C, Lee CT, Ridzon D. Nonrestrictive developmental regulation of microRNA gene expression. Mamm Genome. 2006;17:833–840. doi: 10.1007/s00335-006-0025-7. [DOI] [PubMed] [Google Scholar]
- 40.Taishi P, Churchill L, Wang M, Kay D, Davis CJ, Guan X, De A, Yasuda T, Liao F, Krueger JM. TNFalpha siRNA reduces brain TNF and EEG delta wave activity in rats. Brain Res. doi: 10.1016/j.brainres.2007.04.072. in press. [DOI] [PMC free article] [PubMed] [Google Scholar]
- 41.Taishi P, Sanchez C, Wang Y, Fang J, Harding JW, Krueger JM. Conditions that affect sleep alter the expression of molecules associated with synaptic plasticity. Am J Physiol Regul Integr Comp Physiol. 2001;281:R839–845. doi: 10.1152/ajpregu.2001.281.3.R839. [DOI] [PubMed] [Google Scholar]
- 42.Terao A, Wisor JP, Peyron C, Apte-Deshpande A, Wurts SW, Edgar DM, Kilduff TS. Gene expression in the rat brain during sleep deprivation and recovery sleep: an Affymetrix GeneChip study. Neuroscience. 2006;137:593–605. doi: 10.1016/j.neuroscience.2005.08.059. [DOI] [PMC free article] [PubMed] [Google Scholar]
- 43.Vo N, Klein ME, Varlamova O, Keller DM, Yamamoto T, Goodman RH, Impey S. A cAMP-response element binding protein-induced microRNA regulates neuronal morphogenesis. Proc Natl Acad Sci U S A. 2005;102:16426–16431. doi: 10.1073/pnas.0508448102. [DOI] [PMC free article] [PubMed] [Google Scholar]
- 44.Vyazovskiy V, Borbely AA, Tobler I. Unilateral vibrissae stimulation during waking induces interhemispheric EEG asymmetry during subsequent sleep in the rat. J Sleep Res. 2000;9:367–371. doi: 10.1046/j.1365-2869.2000.00230.x. [DOI] [PubMed] [Google Scholar]
- 45.Wulczyn FG, Smirnova L, Rybak A, Brandt C, Kwidzinski E, Ninnemann O, Strehle M, Seiler A, Schumacher S, Nitsch R. Post-transcriptional regulation of the let-7 microRNA during neural cell specification. FASEB J. 2007;21:415–426. doi: 10.1096/fj.06-6130com. [DOI] [PubMed] [Google Scholar]