

Abstract
Cell growth and osmotic volume regulation are undoubtedly linked to the progression of the cell cycle as with each division, a newly generated cell must compensate for loss of half of its volume to its sister cell. The extent to which size influences cell cycle decisions, however, is controversial in mammalian cells. Further, a mechanism by which cells can monitor and therefore regulate their size has not been fully elucidated. Despite an ongoing debate, there have been few studies which directly address the question in single cell real-time experiments. In this study we used fluorescent time-lapse imaging to quantitatively assess volume in individual spontaneously dividing cells throughout the cell cycle. Together with biophysical studies, these establish that the efflux of salt and water brings about a condensation of cytoplasmic volume as glioma cells progress through mitosis. As cells undergo this pre-mitotic condensation (PMC) they approach a preferred cell volume preceding each division. This is functionally linked to chromatin condensation, suggesting that PMC plays an integral role in mitosis.
Keywords: cancer, cell cycle, chloride channels, chromatin condensation, intracellular chloride, glioma, proliferation, volume regulation
INTRODUCTION
The concept of a cell size checkpoint in the cell cycle has been well established in yeast1–4 and other organisms,5 yet remains controversial in mammalian cells.5–8 In 1965 Killander and Zetterberg showed that fibroblasts altered the length of time spent in G1 in order to accommodate differential starting masses while cell size at S phase remained constant.9 They hypothesized that the initiation of DNA synthesis was dependent on cell mass and started a mammalian size checkpoint debate that remains unresolved after 40 years. More recently, population studies in rodent10–12 and non mammalian avian cells13 have demonstrated that proliferation is most efficient within defined size ranges and that mean cell size remains constant over time, yet a mechanism for cell autonomous sizing has not been elucidated.
When considering cell volume in relation to the cell cycle, it should be recognized that it is determined by two related but distinct processes. The first is the accumulation of cellular synthesis products, which depends on translational rates and lipid synthesis within the cell. The second is cytoplasmic water volume determined by the balance between mechanical and osmotic pressures. As a result of cell division, cell volume is reduced by half. Over the course of the subsequent cell cycle, in addition to mass accumulation, cells increase the osmotically determined water volume as they import or generate cytoplasmic osmolytes. This aspect of cell volume is dynamic as water movement can be rapidly regulated by the directed movement of osmolytes, specifically potassium and chloride, through membrane expressed channels and transporters. This movement has been well characterized in response to osmotic challenges where cells display regulatory volume decrease (RVD)14 and a growing body of evidence indicates that such volume control is important in cell proliferation15–17 especially during mitosis (M).18–21
The need for cell cycle regulation is most evident in the contexts of development and cancer. This is emphasized in the brain where there are very low levels of normal proliferation after development, yet where some of the most aggressively proliferating cancers are found. Immature proliferating cells in the developing brain actively accumulate Cl−.22 This increased intracellular chloride concentration ([Cl−]in) creates an outwardly directed driving force for the movement of chloride. While postmitotic neurons have [Cl−]in levels determined by passive distribution and postmitotic astrocytes, accumulate Cl− but have a minimal conductance for it,23 the brain tumor, Glioblastoma multiforme (glioma) recapitulates the immature phenotype and has both increased [Cl−]in and chloride conductance.24,25 Similarities between glioma and developing cells, suggest a common dependence on chloride driven volume regulation for proliferation as has been proposed for other proliferating cell types. However, the biological significance of osmotic volume regulation in the cell cycle has not been explicitly studied.
In this investigation, we directly measured cell volume in spontaneously dividing cells with real time fluorescent imaging. Unexpectedly, our results demonstrate a dramatic volume condensation as cells progress through M phase such that they assumed a common volume for division. This preferred volume at division was achieved by the efflux of osmotically driven water. This phenomenon is functionally linked to the rate of cell division and the condensation of chromatin at M phase in glioma cells and provides a possible explanation for the observed link between RVD and proliferation in other cell types.
MATERIALS AND METHODS
Cell culture and pharmacology
D54-MG glioma cells (WHO IV, glioblastoma multiforme) were a gift from Dr. D. Bigner (Duke University, Durham, NC). The stable cell line, D54-GFP was generated from D54-MG cells transfected with peGFP-N1 (Clontech, Mountain View, CA). Cells were maintained at 37°C, 10% CO2 in 1:1 DMEM-F12 (Mediatech, Hendon, VA) supplemented with 7% FBS and 2 mM Gln. Hypertonic media contained an additional 48mM NaCl and 1.7mM KCl for 30% challenge or 96 mM NaCl and 3.4 mM KCl for 60% challenge. NPPB was used at 40 μM in 2D time-lapse experiments and 200 μM in for electrophysiology. Unless otherwise stated, all reagents were purchased from Sigma (St. Louis, MO).
Imaging
Cells were plated on 0.170 mm thick glass bottom dishes to reach 50% confluence after 24 to 36 hours for 3D experiments. For 2D experiments, cells where grown in #1 German borosilicate 2 or 4 well chamber slides (Nunc, Rochester, NY). All experiments where performed 24–48 hrs after plating. Hoechst 33342 was loaded into cells at 100 ng/mL in normal media for 25 minutes. Vybrant DiI cell labeling solution (Molecular Probes, Eugene, Oregon) was used at 7 μl/1 mL of culture media or extracellular bath solution, loaded into cells 20 minutes at room temperature.
Time-lapse images were acquired with an Axiocam MRm camera mounted on an Axiovert 200M inverted microscope with a motorized stage and filter cube turret (Carl Zeiss, Thornwood, NJ). The microscope was housed in an incubator maintained at 37°C and 5% CO2 (Carl Zeiss). Wide field fluorescence was generated from a metal halide X-cite 120 light source (EXFO Photonics Solutions Inc., Mississauga, Ontario, Canada) and reflected through a FITC (excitation = 480 ± 15 nm, emission = 535 ± 20 nm) filter cube for GFP fluorescence or a DAPI (excitation = 350 ±25 nm, emission = 460 ± 25 nm) filter cube (Chroma Technologies, Burlington, VT) for Hoechst 33342 fluorescence. Neutral density filters were used to attenuate light and prevent phototoxity. For 3D experiments, a Fluar 40 X/1.35 NA oil immersion lens was used to acquire 180–200 images at intervals of 0.375 μm throughout the depth of the object. Z-stacks were acquired at 30 to 90 minute intervals for 24 to 72 hours at a time. 2D experiments were conducted with a 20 X/0.75 NA Fluar air objective. Phase and fluorescent images where obtained at 10 minute intervals for ≥ 48 hours and multiple fields per treatment condition were imaged at each time point.
Laser scanning confocal images were obtained using an Olympus Flouview 300 system equipped with a 60 X/0.90 NA water immersion lens (Olympus America Inc., Center Valley, PA). GFP and DiI were excited by the argon (excitation 488 nm) and krypton (excitation 568 nm) lasers respectively. Z-spacing was set a t 0.325–0.5 μm and volume measurements were made in Image Pro 3D Suite (Media Cybernetics, Inc., Bethesda, Maryland).
3-D time-lapse volume determination
Image stacks containing 1388 × 1040 pixel images were converted to a series of 16 bit TIFF files and imported into Image Pro 3D Suite. The 3D Blind deconvolution algorithm was used to remove out of focus light and generate digital confocal images. To compensate for spherical aberration we calibrated distance in the z dimension along the depth of fluorescent microspheres of known diameter. 10 μm (Beckman-Coulter, Miami, FL) or 20 μm (Molecular Probes) fluorescent beads were added to the imaging dish after each experiment. The volume was captured and the images were deconvolved as described for cells. With the final image stack, four image planes were identified and assigned a true distance in the z-direction (depth) based on the diameter of the section of the bead imaged at that depth. The number of images needed to capture depth (z) was used to calculate the spacing (s) between each image. These s values were then entered as the z-spacing for the volume calculations made in Image Pro.
2-D time-lapse relative volume and nuclear condensation determination
Intensity measurements for GFP and Hoechst 33342 were made within regions of interest (ROI) selected to reflect the mean cytoplasmic or nuclear intensity using Image J 1.370 software (NIH, USA). Measurements were normalized by creating a ratio of the intensity at a given time to the intensity at the last imaged time point prior to division (M).
Suspended culture volume measurements
After 48 hours in normal or treated media, M phase cells were mechanically isolated as previously described.26 Volume was determined with a Coulter Counter Multisizer-3 cell sizer (Beckman-Coulter, Miami, FL) using a 100 μM aperture and the purity of the isolated cells was determined by fluorescence activated cell sorting (FACS) of sister cultures.
Electrophysiology
Whole cell patch clamp recordings were acquired with an Axopatch 200A amplifier (Axon Instruments, Foster City, CA) using standard whole cell patch clamp techniques. Patch pipettes were pulled from thin walled borosilicate glass (World Precision Instruments (TW150F-4), Sarasota, FL) to a resistance of 3–5 MΩ. Currents were digitalized online at 10 kHz and low-pass filtered at 1 kHz using a Digidata 1322A (Axon Instruments). Data was acquired and stored with pClamp 8 (Axon Instruments). Whole cell capacitance and series resistance were measured from the amplifier and resistance compensation was adjusted to 80%. Standard pipette KCl pipette solution contained (in mM): 145 KCl. 1 MgCl2, 10 EGTA, 10 Hepes Sodium salt pH adjusted to 7.2 with tris base. Extracellular Bath solution contained (in mM): 130 NaCl, 5 KCl, 1 CaCl2, 10.5 Glucose, 32.5 Hepes acid, pH adjusted to 7.4.
RESULTS
Cell volume decreases as cells approach a common size prior to division
The controversy over how cell size and division are coordinated in mammalian cells is confounded by the fact that most studies to date are based on measurements of populations of cells which have been altered experimentally to obtain synchrony. Moreover, prior studies examining the relationship between cell size and the cell cycle have employed measurement techniques which require the suspension of adherent cells. Under these conditions, the disruption of the cytoskeletal and adhesional forces alters cells native volumes. Further, such measurements are static in that each population can only be measured at one time point and it has been argued that a greater emphasis needs to be placed on single cell techniques27 as has been done in the current study where we examined dynamic volume changes in spontaneously dividing cells using real-time 3D time-lapse microscopy. With a microscope contained in an environmentally controlled chamber, we obtained cytoplasmic volume measurements of individual D54-MG glioma (D54) cells which stably express soluble GFP (D54-GFP). Volume measurements were generated from z-stacks of fluorescent images at specific time points relative to cell division allowing for reconstruction in calibrated z space.
A series of 3D projections with corresponding 2D images for a representative cell is shown in Figure 1A (images not to scale). These depict the chronological progression from shortly after birth (top) to division (bottom). Figure 1B shows a graph of volume over time for the same cell (green triangles) as well as others imaged in the same experiment. Contrary to an intuitive model where a cell starts out small, grows to reach a maximum size, and then divides, this cell reached its maximum volume (9869 fL) 320 minutes prior to division and then condensed to a final volume of 6389 fL at M phase (Fig. 1B, position 4). This volume change coincided with a change in morphology from a bipolar G/S phase cell to a rounded cell with minimal attachments at M phase (Fig. 1A, positions 3 and 4). We observed a volume decrease in all cells investigated, challenging the concept of a continuous increase in cell size throughout the cell cycle. We refer to this as pre-mitotic condensation (PMC).
Figure 1.
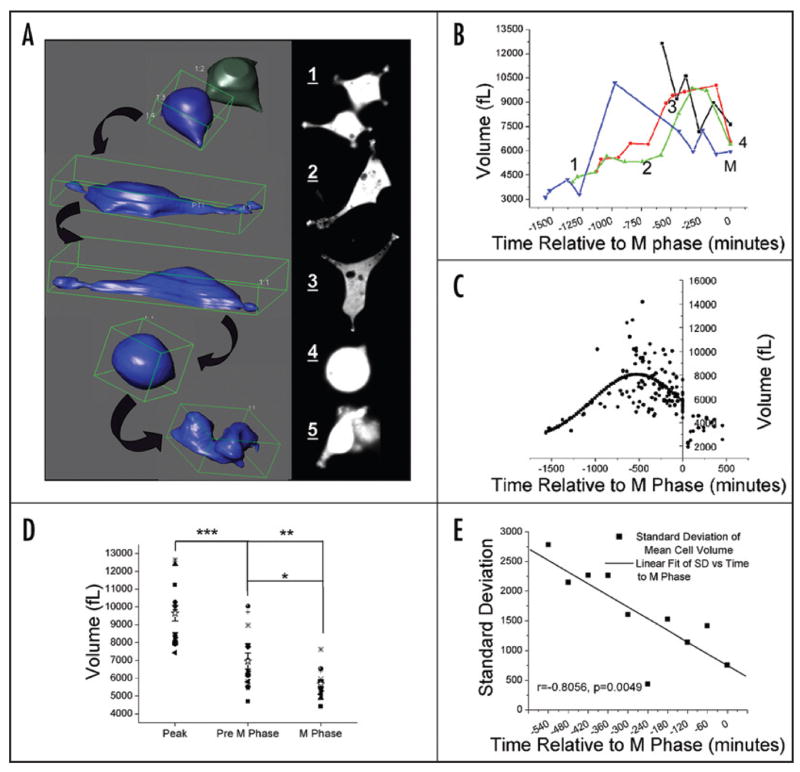
3D imaging of individual cells through the cell cycle demonstrates a decrease in cell volume and an approach to a common volume as they proceed to division (A) 3D projections created from image z-stacks are shown in the left panel. Images in the right panel are sections from the z-stack used to generate the corresponding projections to the left. Images are in chronological order from 1 to 5. (B) Volume measurements at specific time points relative to division are shown for 4 cells including the cell in A (triangle symbols). Time points 1 through 4 correspond to projections 1–4 in (A). For each cell, M phase (M) was set at t = 0 minutes with time prior to designated as negative time and time after division as positive time. (C) Gaussian fit to all time points prior to division for n = 14 cells from 3 separate experiments indicates a peak cell volume at −526 minutes (chi2 = 2.82055E6, r2 = 0.30974). (D) Volume at M phase, the last imaged time point prior to M phase and peak volume for each individual cell are compared. Repeated measures analysis of variance followed by a Tukey-Kramer Multiple comparisons test demonstrates a significant difference between all three time points. *** indicates a mean difference between Peak and Pre M of 2681.0 fL, p < 0.001. **indicates a mean difference between peak and M phase of 3955.4 fL, p < 0.001. * indicates a mean difference between pre M and M phase of 1274.3 fL, p < 0.05. (D) The standard deviation of cell volumes decreases linearly over time. Standard deviations are generated from data in (B) grouped by 60 minute intervals.
To quantify these observations, we followed fourteen cells in three independent experiments to obtain volume data throughout the cell cycle (Fig. 1C–E). As was the case for the individual cell traces, the peak cell volume of the population was not at M phase but well before. A Gaussian curve fit of all time points prior to M phase generated a peak at −527 minutes (Fig. 1C). From this peak, there was a significant inverse correlation between time and volume as cells approached M phase (r = −0.3958, p = 0.0002). Significantly, when we compared the peak volume to the last measured time point prior to M phase (pre M) and the M phase volume of individual cells for all cells in the data set, there was a significant difference between the means with Peak > Pre M > M phase cells and a mean M phase volume of 5690 fL ± 787 s.d. (Fig. 1D). These results contradict the concept of maximum cell volume being reached just prior to division and demonstrate that the final M phase volume is the result of a significant condensation of cell volume.
Importantly, the data in Figure 1D demonstrates that, in addition to the decrease in cell volume at M phase, the range of volumes for the M phase cells is smaller than at either of the preceding time points. In order to examine this further, we grouped all volume measurements into 60 minute intervals. From the time at peak volume, the standard deviation from the mean decreased linearly as cells approached division (Fig. 1E, r = −0.80562, p = 0.0049). All cells approached a common final cell volume, suggesting that there exists an optimum cell volume for division, and implicating cell volume as an integral regulator of the cell cycle.
Plasma membrane thickness is increased as cytoplasmic volume decreases
The results described above seem counter-intuitive as it appears energetically wasteful to increase cell size in preparation for division only to decrease cell volume just prior to doing so. However, this paradox can be eliminated if one differentiates between osmotic volume regulation and cellular synthesis. It is conceivable that during PMC, only the cytoplasmic volume, specifically the water content of the cytosol, decreases without altering protein and lipid mass content. If this were the case, one would expect an increase in the ratio of plasma membrane volume to cytoplasmic volume in the condensed mitotic cells. We tested this hypothesis by labeling live D54-GFP cells with DiI, a membrane associated dye. Representative 3D reconstructions of confocal images of the membrane (red) and cytoplasm (green) are shown in Figure 2A and Supplementary Movie 1. The majority of the membrane inserted DiI was external to the cytoplasmic GFP in both the bipolar and the M phase cells (Fig. 2B). However, the membrane appeared markedly thicker in the M phase cells than in the bipolar cells. To quantify this, the membrane and cytoplasmic volumes were determined by 3D measurements and a ratio of the membrane to cytoplasmic volume was generated for a bipolar and M phase cell from each field imaged. The mean data from seven experiments are summarized in Figure 2C and indicate a greater than two fold increase in the membrane:cytoplasm ratio in the M phase cells (p = 0.0035). This suggests that PMC is not due to a loss of cellular dry mass, but a decrease of the cytoplasmic water volume.
Figure 2.

Plasma membrane thickening accompanies cytoplasmic contraction at M phase. (A) 3D renderings of an example field containing a contracted M phase cell (arrows) and several growth phase cells. Left panel depicts the cytoplasm alone (green). The right panel is the merged stacks of the cytoplasm (green) enveloped by the cell membrane (red). Arrowheads identify an M phase cell in the field. Each grid square is 10 μm2. (B) 2D sections of image stacks for bipolar and M phase cells distinguish between cytoplasm (top) and membrane (bottom) and demonstrate a thicker membrane in the M phase cells. Scale bar is 10 μm for both cells. (C) Membrane volume (Vmembrane) determined by reconstructing total cell volume in DiI images and subtracting cytoplasmic volume (V cytoplasm) determined from GFP images. Data represents paired data from an M phase and a bipolar cell from each field with n = 7 fields. Two-tailed value p = 0.0035.
Pre-mitotic volume decrease is essential for cell cycle progression
To determine that the above observations are broadly applicable, we employed a 2D microscopic imaging approach that allowed for the analysis of large numbers of cells yet retained the ability to examine individual adherent cells over time. Within each GFP expressing cell, a decrease in cytoplasmic volume will increase the GFP concentration, and as a result, increase the intensity of emitted light under the same excitation conditions. In this way, relative volume changes can be determined.28 This is illustrated in Figure 3A for a representative D54-GFP cell prior to (left), during (center), and after M Phase (right). The fluorescent images demonstrate an increase in the intensity of GFP at M phase which corresponds to a concentration of the protein and hence a decrease in cell volume. Multiple cells were imaged over the course of two cell divisions and intensity measurements were made within a selected region of interest. The intensity values were normalized to intensity at M Phase of the second cell division and the resultant ratio, F/Fm, was plotted against time relative to division (Fig. 3B, N = 15). From this data three related observations can be made. The first is that the PMC observed in the 3D experiments was confirmed in all cells examined in the 2D experiments. Second, the time course and magnitude of the decrease was similar between mother and daughter cells over consecutive divisions. Finally, the decrease was rapid and was followed by a similarly rapid increase in volume in the newly formed daughter cells, demonstrating a change in fluid content rather than degradation and synthesis of cellular components. Importantly, the PMC observed in the D54 glioma cells by 2D time-lapse microscopy was similarly seen in U251 glioma cells as well as the non glioma line, Hek-293 (data not shown).
Figure 3.
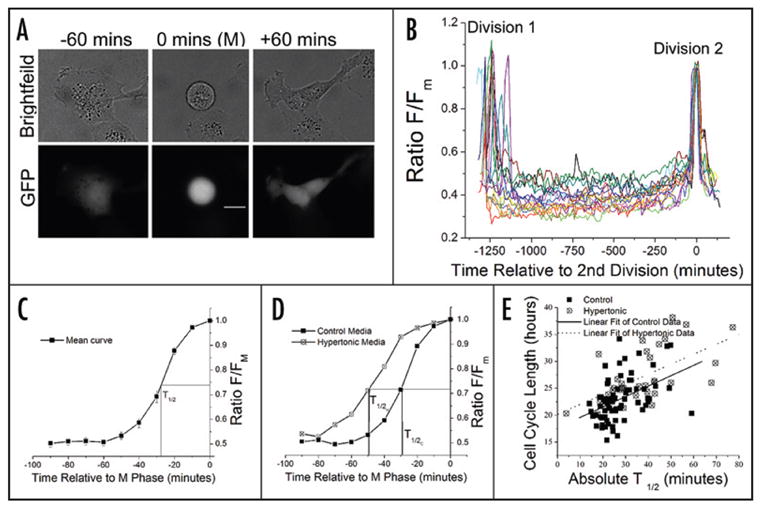
2D microscopy demonstrates that pre-mitotic contraction is rapid, of similar magnitude between cells and over consecutive divisions, and is correlated with cell cycle progression (A) Representative cell in 2D before (−60 minutes), during (0 minutes), and after (+60 minutes) M phase is shown. The increased intensity at 0 minutes in the GFP image indicates a decrease in cell volume. Scale bar is 20 μm. (B) F/Fm indicates average intensity within a specified region of interest normalized to last imaged time point prior to division (M phase) of Division 2. F/Fm traces are shown for 15 individual cells over 2 consecutive divisions. (C) Curve represents the averaged data from 69 untreated cells at the 2nd division observed within 48 hours. Error bars represent s.e.m., n = 3 separate experiments with N ≥ 20 cells each. T1/2 indicates the time at which half maximal intensity achieved. For the mean curve this value was 27.8 minutes prior to M phase. (D) Mean PMC curves for control and hypertonic wells from a representative experiment (control N = 45; hypertonic N = 12). (E) Cell cycle length is correlated with absolute T1/2 under both control (n = 69, r = 0.4351, p = 0.0002) and Hypertonic (n = 33, r = 0.6052, p = 0.0002) conditions.
We analyzed the kinetics of PMC in the last 90 minutes of the cell curve was generated cycle. To extract a time constant, a mean F/Fm (Fig. 3C) and a sigmoid curve was fit to the data. The time at which the cells reached half maximal intensity (T1/2) was then extrapolated. The absolute value of T1/2 corresponds to the amount of time the cells spent at or greater than half maximal condensation and hence is reflective of rate. In these experiments, we were also able to measure the cell cycle length for each individual cell by counting time between two divisions. When we analyzed the T1/2 and cell cycle lengths for each cell individually, and plotted them against each other (Fig. 3E, Control), a correlation between the rate of contraction and the cell cycle length was apparent (r = 0.4351, p = 0.0002). Cells which had longer cell cycles also had increased T1/2’s corresponding to decreased condensation rates. This demonstrates a covariation between cell cycle length and the rate of PMC and suggests that the PMC is a fundamental part of the cell cycle.
Since these cells appear to condense to a preferred volume as they enter M phase and cell cycle length varies with the rate of condensation, we speculated that challenges that hinder cells from obtaining this volume would impede cell division. To investigate this hypothesis, we forced the cells to become larger than normal. Chronic treatment with hypertonic media has been shown to increase cell volume.10 We challenged D54 GFP cells with media that had a 30% increased NaCl content (Hypertonic), and confirmed, by Coulter Counter cell sizing of mechanically isolated cells, that M phase cell volume was 13.5% +/− 1.8% greater than control sister cultures at 48 hours (n = 3 independent experiments, one tailed paired t-test p-value = 0.0228). In 2D time-lapse experiments of cells grown either in normal (320 mOsm) or hypertonic media (400 mOsm), we found a 36% decrease in the total number of cell divisions relative to starting number of cells per field in the hypertonic treatment (n= 3 independent experiments, one tailed paired t-test p value = 0.0029). An absence of cell death in either condition, determined by morphology and a lack of membrane blebbing (data not shown), suggested that this decrease was due to increased cycle length. We selected cells which could be followed through two divisions and determined the mean cell cycle length. As hypothesized, this was longer in the hypertonic wells compared to controls (con = 22.2 hrs ± 1.0 s.e.m., hypertonic = 26.9 hrs ± 1.2 s.e.m., one-tailed paired t-test p value = 0.0103).
Having established the differential volume and cell cycle lengths between conditions, we examined the pre-mitotic volume decrease in the context of altered cell cycle parameters. We plotted the averaged F/Fm curves for control and hypertonic treatments and determined T1/2 values. When compared to the control condition, T1/2 for the cells grown in the hypertonic media was shifted to the left (T1/2 H = −49.3 minutes vs. T1/2 C = −29.1 minutes), indicating an overall decreased rate of change as well as an increased amount of time spent at or near minimal volume (Fig. 3D). Additionally, as for control cells, there was a positive correlation between T1/2 and cell cycle length for treated cells (Fig. 3E). This indicates that in both conditions, the rate at which cells contract is a critical factor in determining cell cycle length. The increased time spent at a volume near but not quite at minimal volume in the treated cells may reflect a decreased ability to attain a preferred volume and therefore sub-optimal conditions for division.
Regulated Cl− efflux is a likely mechanism behind pre-mitotic volume condensation
Having established the phenomenon of cell volume decrease prior to M phase and a link to the progression of the cell cycle, we next sought to elucidate a mechanism by which such a rapid change in volume could be achieved. In pursuit of this, we looked for guidance in processes in which large, rapid and regulated volume changes take place. One such process is the regulatory volume decrease (RVD) that occurs in response to osmotic challenges. In glioma cells, RVD requires activation of NPPB sensitive chloride channels.29,30 To examine a role for these channels in PMC, we conducted a series of 2D experiments which show that treatment with NPPB at two times the published IC5030 indeed impairs PMC. NPPB treated cells demonstrated significantly less volume contraction in the 200 minutes leading up to division than do control cells (Fig. 4A). During this time F/Fm ratios changed by 59% in untreated cells and only 46% (n = 10, p = 0.0001) in NPPB treated cells. This difference suggests that NPPB treated cells take longer to achieve the same degree of volume condensation as control cells. This is supported by the example cells in Figure 4B. The resultant increase in cell cycle length explains the observed decrease in the number of divisions per field relative to controls (n = 3, mean decrease = 29.2%, s.d. = 12.5%, one-tailed paired t-test p value = 0.0280). This data implies that inhibition of Cl− channels with NPPB hinders PMC and as a consequence, lengthens the cell cycle.
Figure 4.

Inhibition of Cl− channels hinders PMC and impairs cell proliferation. (A) Mean control (N = 10) and NPPB (N = 10) traces of F/Fm in the 200 minutes preceding M phase for a representative 2D time-lapse experiment. (B) Individual control (filled symbols) and NPPB treated (open symbols) cell traces spanning two divisions each. Asterisks indicate time at which the NPPB treated cell (*) or Control cell (**) F/Fm ratio = 0.45, the starting ratio for PMC in controls. (C) Representative M phase (top) and bipolar (bottom) cells distinguished by cell body and nuclear morphology for electrophysiological recordings. (D) Representative voltage clamp traces from whole cell patch clamp recordings of an M phase cell in the presence of Paxilline (left) and after the application of 200μM NPPB (center). The subtracted NPPB sensitive current is shown to the right. Cells were stepped from a −40 mV holding potential to 0mV before making steps from −140 to 100mV in 20 mV increments. (E) Mean steady state current/voltage curves for M phase (n = 17) and bipolar cells (n = 11). (F) Mean current at +100 mV and −140 mV. Significant difference between M phase and M phase with NPPB (*), p = 0.0004 at +100 mV, p = 0.0021 at −140 mV; between M Phase and Bipolar (**), p = 0.0082 at +100 mV, = 0.0404 at −140 mV. (G) Mean NPPB sensitive current traces. Current is significantly larger at both +100 mV and −140 mV in the M phase cells (one tailed p value = 0.0474 and 0.0291 respectively). E–G error bars represent s.e.m.
To directly demonstrate functional Cl− channels associated with M phase, whole cell patch clamp recordings were obtained. Hoechst 33342 labeling of nuclear organization and morphological characterizations were used to distinguish between M phase and growth phase cells (Fig. 4C). Whole cell capacitance measurements confirmed a significantly decreased cell size at M phase (M phase capacitance = 39.1 pF ± 1.3 s.e.m., n = 17; Bipolar capacitance = 49.7 pF ± 2.15 s.e.m., n=12; two-tailed p-value = 0.0002). Furthermore, entrance potential measurements showed that the M phase cell membranes were 6.3 mV more depolarized than the bipolar cells (p = 0.01), consistent with an increased chloride conductance at rest.
Whole cell currents were evoked in bipolar and M phase cells in order to assess Cl− currents. Figure 4D depicts a representative trace of a current elicited from an M phase cell before and after the addition of NPPB. The mean current-voltage (IV) plot shown in Figure 4E illustrates that the M phase currents prior to NPPB application were significantly larger at both positive and negative potentials than they were in bipolar cells. Additionally, there was a rightward shift of the current’s reversal potential in M phase cells confirming the observed depolarized entrance potentials and providing further evidence that these cells have a chloride conductance at rest. Application of NPPB, diminished both the inward and the outward components of the M phase current (Fig. 4D—F) such that by magnitude and reversal potential, it was indistinguishable from the whole cell current in bipolar cells (Fig. 4E and F). In turn, application of NPPB to bipolar cells caused a slight but insignificant decrease in current. For both conditions, the NPPB sensitive currents reverse at 0mV which is the chloride equilibrium potential for these recording conditions (Fig. 4G). This current is likely responsible for the efflux of osmotically active Cl− which in turn causes the efflux of water and cell shrinkage at M phase.
Pre-mitotic volume condensation is functionally related to nuclear condensation
Mitosis is a complex and highly regulated process and it is not likely that a potentially disruptive change in cell volume would take place prior to each division unless it provided some advantage. This warranted further examination of the nuclear changes during PMC. An essential event in mitosis is chromatin condensation. This can be visualized with the nucleic acid bound Hoechst 33342 dye which will condense along with the chromatin, and as a result, emit more intensity in a defined region. When we compared F/Fm ratios for the GFP and the Hoechst fluorescence from 2D time-lapse experiments, the volume decrease occurred with the same time course relative to division as the nuclear condensation did (Fig. 5A and B). As shown in Figure 5B, the Hoechst F/Fm ratio increased drastically between −30 and 20 minutes. This was the same-time in which the GFP ratio increased significantly, indicating a temporal relationship between PMC and nuclear condensation.
Figure 5.

Chromatin condensation is linked to pre-mitotic volume condensation. (A) Representative cells treated with control (320 mOsm) or hypertonic (500 mOsm) media. For each condition the left panel is a merge of the GFP and Hoechst image. The right panel shows Hoechst labeling alone. Scale bar is 40 μm for. (B) Mean traces of F/Fm values generated from GFP (closed symbols) or Hoechst (open symbols) under control and hypertonic conditions. Error bars represent s.e.m., n = 3 experiments, N ≥10.
In order to further examine the interdependence of PMC and DNA condensation, we experimentally slowed the rate of PMC by subjecting cells to a hypertonic challenge of 500 mOsm/kg. Under these conditions the cells were noticeably larger and divided infrequently (divisions relative to control = 0.390 ± 0.137 s.d., n = 3, N ≥ 10, one-tailed paired p-value = 0.0044) with substantially altered PMC kinetics (Fig. 5B). The GFP F/Fm curve for the treated cells was distinctly shifted to the left compared to control and the sigmoid nature of the change was replaced by a slow, gradual and more linear rise. Significantly, the rate and time course of nuclear condensation exactly paralleled that of the volume change with an equal shift to the left (Fig. 5B, triangles). As would be expected of a change in volume determined by the flux of water, altering extracellular osmolarity impaired PMC. The observed change in the rate of nuclear condensation, however, would not be expected unless the two events were functionally related. This suggests that PMC is a fundamental part of cell division which facilitates nuclear condensation during M phase and provides further evidence for osmotically determined cell volume as a critical regulator of the cell cycle.
DISCUSSION
These studies elucidate a large rapid and regulated decrease in cell volume that occurs as cells enter mitosis, which we have termed pre-mitotic condensation (PMC). Kinetics and pharmacology demonstrate that the mechanism behind this process involves the outward directed movement of chloride followed by water. Importantly, hindering this process equally hinders the condensation of chromatin into chromosomes prior to division. This observation is significant as it not only provides evidence for, but also a mechanism by which a cell may translate a change in volume into a signal to proceed with division.
Chromatin condensation is one of the first events of M phase. The transition into M phase, in turn, is regulated by the binding, activation and nuclear localization of the cyclin dependent kinase 1 (cdk1)/cyclin B complex.31–33 Cdk1 is expressed at fairly constant levels throughout the cell cycle34 while cyclin B synthesis is not initiated until the end of S phase in mammalian cells.33,35 Activation of the complex requires both the accumulation of threshold levels of the complex as well as regulation of phosphorylations on both Cdk1 and cyclin B.36–38 Although not directly addressed here, PMC may facilitate progression through the cell cycle by concentrating the cytoplasm and therefore bringing regulatory kinases and phosphatases into closer proximity to the Cdk/cyclin complex. Alternatively, it may decrease the threshold levels of activated complex required to effect downstream factors such as the condensin complexes themselves. Blocking a cell’s ability to decrease its volume or increasing the precondensed volume such that sufficient condensation is impossible, would then postpone chromatin condensation until threshold activity levels could be achieved through a secondary mechanism. This would enable cells of a certain size to enter mitosis more readily than others and may determine the size limits for a specific cell population.
The data indicate that the mechanism behind PMC is similar to that employed in RVD, i.e., through coordinated salt and water secretion, and provide a functional explanation for the linkage between RVD and proliferation that has been indirectly implied in previous studies. Specifically, inhibition of swelling activated chloride currents has been shown to inhibit the progression of the cell cycle in other cell types15,20 and upregulation of a spontaneous current20 as well as hypotonically elicited currents have been reported during mitosis.21 The involvement of these currents in a PMC which is an integral part of the chromatin condensation process would explain the observed association.
Our studies took advantage of dynamic single cell measurements in real time and revealed a pre-mitotic condensation (PMC) that has not been previously described. Although we focus here on glioma, inhibition of the volume regulated chloride channels, that we believe are responsible for PMC, has been shown to block cell cycle progression in proliferating mouse liver, lung, and fibroblast cells as well as human cervical, prostate, and nasopharyngeal cancer cells.15,20,21,39,40 This suggests that this may be a common mechanism in cell division. With regards to the cell size checkpoint debate, this study suggests that in addition to the translational checkpoints postulated at the G1/S transition6–8,41 which set the lower limits for cell size, regulation of water volume plays an important role in progression through M phase and may set the upper limits on cell volume for proliferating cells.
Acknowledgments
This work was supported by NIH grants RO1-NS313234, RO1-NS36692 and P50-CA97247.
ABBREVIATIONS
- [Cl−]in
intracellular chloride
- D54
D54-MG human glioblastoma multiforme cell line
- M
mitosis
- NPPB
5-nitro-2(3-phenylpropylamino) benzoic acid
- PMC
pre-mitotic condensation
- ROI
region of interest
- RVD
regulatory volume decrease
Footnotes
Supplemental information can be found at:
References
- 1.Sveiczer A, Novak B, Mitchison JM. The size control of fission yeast revisited. J Cell Sci. 1996;109:2947–57. doi: 10.1242/jcs.109.12.2947. [DOI] [PubMed] [Google Scholar]
- 2.Fantes PA, Nurse P. Control of the timing of cell division in fission yeast: Cell size mutants reveal a second control pathway. Exp Cell Res. 1978;115:317–29. doi: 10.1016/0014-4827(78)90286-0. [DOI] [PubMed] [Google Scholar]
- 3.Rupes I. Checking cell size in yeast. Trends Genet. 2002;18:479–85. doi: 10.1016/s0168-9525(02)02745-2. [DOI] [PubMed] [Google Scholar]
- 4.Kellogg DR. Wee1-dependent mechanisms required for coordination of cell growth and cell division. J Cell Sci. 2003;116:24–90. doi: 10.1242/jcs.00908. [DOI] [PubMed] [Google Scholar]
- 5.Cooper S. Control and maintenance of mammalian cell size. BMC Cell Biol. 2004;5:35. doi: 10.1186/1471-2121-5-35. [DOI] [PMC free article] [PubMed] [Google Scholar]
- 6.Wells WA. Does size matter? J Cell Biol. 2002;158:1156–9. doi: 10.1083/jcb.200209042. [DOI] [PMC free article] [PubMed] [Google Scholar]
- 7.Saucedo LJ, Edgar BA. Why size matters: Altering cell size. Curr Opin Genet Dev. 2002;12:565–71. doi: 10.1016/s0959-437x(02)00341-6. [DOI] [PubMed] [Google Scholar]
- 8.Jorgensen P, Tyers M. How cells coordinate growth and division. Curr Biol. 2004;14:R1014–27. doi: 10.1016/j.cub.2004.11.027. [DOI] [PubMed] [Google Scholar]
- 9.Killander D, Zetterberg A. A quantitative cytochemical investigation of the relationship between cell mass and initiation of DNA synthesis in mouse fibroblasts in vitro. Exp Cell Res. 1965;40:12–20. doi: 10.1016/0014-4827(65)90285-5. [DOI] [PubMed] [Google Scholar]
- 10.Dubois JM, Rouzaire-Dubois B. The influence of cell volume changes on tumour cell proliferation. Eur Biophys J. 2004;33:227–32. doi: 10.1007/s00249-003-0364-1. [DOI] [PubMed] [Google Scholar]
- 11.Rouzaire-Dubois B, O’Regan S, Dubois JM. Cell size-dependent and independent proliferation of rodent neuroblastoma × glioma cells. J Cell Physiol. 2005;203:243–50. doi: 10.1002/jcp.20240. [DOI] [PubMed] [Google Scholar]
- 12.Rouzaire-Dubois B, Malo M, Milandri JB, Dubois JM. Cell size-proliferation relationship in rat glioma cells. Glia. 2004;45:249–57. doi: 10.1002/glia.10320. [DOI] [PubMed] [Google Scholar]
- 13.Dolznig H, Grebien F, Sauer T, Beug H, Mullner EW. Evidence for a size-sensing mechanism in animal cells. Nat Cell Biol. 2004;6:899–905. doi: 10.1038/ncb1166. [DOI] [PubMed] [Google Scholar]
- 14.Hoffmann EK, Simonsen LO. Membrane mechanisms in volume and pH regulation in vertebrate cells. Physiol Rev. 1989;69:315–82. doi: 10.1152/physrev.1989.69.2.315. [DOI] [PubMed] [Google Scholar]
- 15.Shen MR, Droogmans G, Eggermont J, Voets T, Ellory JC, Nilius B. Differential expression of volume-regulated anion channels during cell cycle progression of human cervical cancer cells. J Physiol. 2000;529(Pt 2):385–94. doi: 10.1111/j.1469-7793.2000.00385.x. [DOI] [PMC free article] [PubMed] [Google Scholar]
- 16.Shen MR, Lin AC, Hsu YM, Chang TJ, Tang MJ, Alper SL, Ellory JC, Chou CY. Insulin-like growth factor 1 stimulates KCl cotransport, which is necessary for invasion and proliferation of cervical cancer and ovarian cancer cells. J Biol Chem. 2004;279:40017–25. doi: 10.1074/jbc.M406706200. [DOI] [PubMed] [Google Scholar]
- 17.Wang L, Chen L, Zhu L, Rawle M, Nie S, Zhang J, Ping Z, Kangrong C, Jacob TJ. Regulatory volume decrease is actively modulated during the cell cycle. J Cell Physiol. 2002;193:110–9. doi: 10.1002/jcp.10156. [DOI] [PubMed] [Google Scholar]
- 18.Zheng YJ, Furukawa T, Ogura T, Tajimi K, Inagaki N. M phase-specific expression and phosphorylation-dependent ubiquitination of the ClC-2 channel. J Biol Chem. 2002;277:32268–73. doi: 10.1074/jbc.M202105200. [DOI] [PubMed] [Google Scholar]
- 19.Rutledge E, Denton J, Strange K. Cell cycle- and swelling-induced activation of a Caenorhabditis elegans ClC channel is mediated by CeGLC-7alpha/beta phosphatases. J Cell Biol. 2002;158:435–44. doi: 10.1083/jcb.200204142. [DOI] [PMC free article] [PubMed] [Google Scholar]
- 20.Wondergem R, Gong W, Monen SH, Dooley SN, Gonce JL, Conner TD, Houser M, Ecay TW, Ferslew KE. Blocking swelling-activated chloride current inhibits mouse liver cell proliferation. J Physiol. 2001;532:3–72. doi: 10.1111/j.1469-7793.2001.0661e.x. [DOI] [PMC free article] [PubMed] [Google Scholar]
- 21.Chen L, Wang L, Zhu L, Nie S, Zhang J, Zhong P, Cai B, Luo H, Jacob TJ. Cell cycle-dependent expression of volume-activated chloride currents in nasopharyngeal carcinoma cells. Am J Physiol Cell Physiol. 2002;283:C1313–23. doi: 10.1152/ajpcell.00182.2002. [DOI] [PubMed] [Google Scholar]
- 22.Yamada J, Okabe A, Toyoda H, Kilb W, Luhmann HJ, Fukuda A. Cl- uptake promoting depolarizing GABA actions in immature rat neocortical neurones is mediated by NKCC1. J Physiol. 2004;557:3–41. doi: 10.1113/jphysiol.2004.062471. [DOI] [PMC free article] [PubMed] [Google Scholar]
- 23.Walz W. Chloride/anion channels in glial cell membranes. Glia. 2002;40:1–10. doi: 10.1002/glia.10125. [DOI] [PubMed] [Google Scholar]
- 24.Ullrich N, Bordey A, Gillespie GY, Sontheimer H. Expression of voltage-activated chloride currents in acute slices of human gliomas. Neurosci. 1998;83:1161–73. doi: 10.1016/s0306-4522(97)00456-9. [DOI] [PubMed] [Google Scholar]
- 25.Olsen ML, Schade S, Lyons SA, Amarillo MD, Sontheimer H. Expresssion of voltage-gated chloride channels in human glioma cells. J Neurosci. 2003;23:5572–82. doi: 10.1523/JNEUROSCI.23-13-05572.2003. [DOI] [PMC free article] [PubMed] [Google Scholar]
- 26.Johnson RT, Downes CS, Meyn RE. The synchronization of mammalian cells. In: Brooks R, Fantes P, editors. The Cell Cycle; A Practical Approach. New York, NY: Oxford University Press; 1993. pp. 1–44. [Google Scholar]
- 27.Mitchison J. Single cell studies of the cell cycle and some models. Theor Biol Med Model. 2005;2:4. doi: 10.1186/1742-4682-2-4. [DOI] [PMC free article] [PubMed] [Google Scholar]
- 28.Alvarez-Leefmans FJ, Herrera-Perez JJ, Marquez MS, Blanco VM. Simultaneous measurement of water volume and pH in single cells using BCECF and fluorescence imaging microscopy. Biophys J. 2006;90:608–18. doi: 10.1529/biophysj.105.069450. [DOI] [PMC free article] [PubMed] [Google Scholar]
- 29.Ernest NJ, Weaver AK, Van Duyn LB, Sontheimer HW. Relative contribution of chloride channels and transporters to regulatory volume decrease in human glioma cells. Am J Physiol Cell Physiol. 2005;288:C1451–60. doi: 10.1152/ajpcell.00503.2004. [DOI] [PMC free article] [PubMed] [Google Scholar]
- 30.Ransom CB, O’Neal JT, Sontheimer H. Volume-activated chloride currents contribute to the resting conductance and invasive migration of human glioma cells. J Neurosci. 2001;21:7674–83. doi: 10.1523/JNEUROSCI.21-19-07674.2001. [DOI] [PMC free article] [PubMed] [Google Scholar]
- 31.Lamb NJ, Fernandez A, Watrin A, Labbe JC, Cavadore JC. Microinjection of p34cdc2 kinase induces marked changes in cell shape, cytoskeletal organization, and chromatin structure in mammalian fibroblasts. Cell. 1990;60:151–65. doi: 10.1016/0092-8674(90)90725-t. [DOI] [PubMed] [Google Scholar]
- 32.O’Farrell PH. Triggering the all-or-nothing switch into mitosis. Trends Cell Biol. 2001;11:512–9. doi: 10.1016/s0962-8924(01)02142-0. [DOI] [PMC free article] [PubMed] [Google Scholar]
- 33.Pines J, Hunter T. Isolation of a human cyclin cDNA: Evidence for cyclin mRNA and protein regulation in the cell cycle and for interaction with p34cdc2. Cell. 1989;58:833–46. doi: 10.1016/0092-8674(89)90936-7. [DOI] [PubMed] [Google Scholar]
- 34.Smits VA, Medema RH. Checking out the G2/M transition. Biochim Biophys Acta. 2001;1519:1–12. doi: 10.1016/s0167-4781(01)00204-4. [DOI] [PubMed] [Google Scholar]
- 35.Piaggio G, Farina A, Perrotti D, Manni I, Fuschi P, Sacchi A, Gaetano C. Structure and growth-dependent regulation of the human cyclin B1 promoter. Exp Cell Res. 1995;216:396–402. doi: 10.1006/excr.1995.1050. [DOI] [PubMed] [Google Scholar]
- 36.Yuan J, Eckerdt F, Bereiter-Hahn J, Kurunci-Csacsko E, Kaufmann M, Strebhardt K. Cooperative phosphorylation including the activity of polo-like kinase 1 regulates the sub-cellular localization of cyclin B1. Oncogene. 2002;21:8282–92. doi: 10.1038/sj.onc.1206011. [DOI] [PubMed] [Google Scholar]
- 37.Hagting A, Jackman M, Simpson K, Pines J. Translocation of cyclin B1 to the nucleus at prophase requires a phosphorylation-dependent nuclear import signal. Curr Biol. 1999;9:680–9. doi: 10.1016/s0960-9822(99)80308-x. [DOI] [PubMed] [Google Scholar]
- 38.Kramer A, Mailand N, Lukas C, Syljuasen RG, Wilkinson CJ, Nigg EA, Bartek J, Lukas J. Centrosome-associated Chk1 prevents premature activation of cyclin-B-Cdk1 kinase. Nat Cell Biol. 2004;6:884–91. doi: 10.1038/ncb1165. [DOI] [PubMed] [Google Scholar]
- 39.Wang L, Chen L, Jacob TJ. The role of ClC-3 in volume-activated chloride currents and volume regulation in bovine epithelial cells demonstrated by antisense inhibition. J Physiol. 2000;524:35. doi: 10.1111/j.1469-7793.2000.t01-1-00063.x. [DOI] [PMC free article] [PubMed] [Google Scholar]
- 40.Doroshenko P, Sabanov V, Doroshenko N. Cell cycle-related changes in regulatory volume decrease and volume-sensitive chloride conductance in mouse fibroblasts. J Cell Physiol. 2001;187:65–72. doi: 10.1002/1097-4652(200104)187:1<65::AID-JCP1052>3.0.CO;2-A. [DOI] [PubMed] [Google Scholar]
- 41.Umen JG. The elusive sizer. Curr Opin Cell Biol. 2005;17:435–41. doi: 10.1016/j.ceb.2005.06.001. [DOI] [PubMed] [Google Scholar]