

Abstract
Common organic MALDI matrices, 2,5-dihydroxybenzoic acid, 3,5-dimethoxy-4-hydroxycinnamic acid, and alpha-cyano-4-hydroxy-cinnamic acid were found to undergo sublimation without decomposition under conditions of reduced pressure and elevated temperature. This solid to vapor phase transition was exploited to apply MALDI matrix onto tissue samples over a broad surface in a solvent-free application for mass spectrometric imaging. Sublimation of matrix produced an even layer of small crystals across the sample plate. The deposition was readily controlled with time, temperature and pressure settings and was highly reproducible from one sample to the next. Mass spectrometric images acquired from phospholipid standards robotically spotted onto a MALDI plate yielded a more intense, even signal with fewer sodium adducts when matrix was applied by sublimation relative to samples where matrix was deposited by an electrospray technique. MALDI matrix could be readily applied to tissue sections on glass slides and stainless steel MALDI plate inserts as long as good thermal contact was made with the condenser of the sublimation device. Sections of mouse brain were coated with matrix applied by sublimation, and were imaged using a Q-q-TOF mass spectrometer to yield mass spectral images of very high quality. Image quality is likely enhanced by several features of this technique including the microcrystalline morphology of the deposited matrix, increased purity of deposited matrix, and evenness of deposition. This inexpensive method was reproducible, and eliminated the potential for spreading of analytes due to solvent deposition during matrix application.
Introduction
Mass spectrometric imaging (MSI) has recently been developed as a method for determining and visualizing the distribution of biological molecules across sections of dissected tissue. This technique has been applied toward the determination of protein molecular markers of cancer [1], the analysis of small molecule metabolites of experimental pharmaceutical agents [2], and in studies of lipid distribution in rat brain tissue [3]. In these studies and others, MALDI matrix has been applied to tissue sections by microspotter [4], electrospray deposition [5], or artistic airbrush [3] all of which employ solutions of matrix dissolved in a water/organic solvent mixture in the deposition of matrix. Image resolution could be affected by inadvertent spreading of analytes that might occur during matrix deposition from blending of analytes in microdroplets of deposited matrix solution. This potential could be exacerbated in studies of lipids present in tissues because of their relatively low molecular weight and increased solubility in organic solvents. As MSI technology and methods improve along with the demand for higher resolution and greater detail of images, the reality of analyte spreading from tissue treatments becomes of greater concern and possible impediment to reliable image interpretation of those compounds most susceptible to migration during the MALDI matrix deposition step. Other factors such as tissue section preparation, matrix uniformity, matrix crystal size [6], and laser spot size [5] also affect image resolution in MALDI-MSI. While the highest lateral resolution with MSI methods has been achieved by secondary ion mass spectrometry [7–9], potential signal enhancements using matrix enhanced-SIMS depend on uniform matrix application [10].
The identification and characterization of lipids as well as determination of lipid distribution in tissues has emerged as an important goal in understanding the role of specific lipids in systemic biologic approaches [11]. Issues of analyte spreading in MSI are a heightened concern given that many lipids have partial to full solubility in methanol, ethanol, or acetonitrile, the common solvents used in matrix application and tissue section preparation. We have therefore developed a novel method for matrix deposition that avoids the use of solvents, and eliminates the question of analyte spreading during the matrix application step of MSI. Vapor phase deposition of matrix through sublimation techniques was examined and found to be a reliable means to apply a uniform coating of matrix over a large sample plate. Additionally, we believe that increased purity of matrix through sublimation increases the analyte signal and that the fine microcrystals formed from the condensed vapor reduce the limitation of image resolution caused by crystal size. We have applied this method to the mass spectrometric imaging of spots of phospholipid chemical standards, and to sections of mouse brain to explore the quality of images generated with this technique.
Methods
All solvents used in this study were of HPLC grade, and were purchased from Fisher Scientific (Fair Lawn, NJ). Water was purified using a Millipore purification system to resistance of 18 megaohms. Phospholipid standards 1-palmitoyl-2-stearoyl-sn-glycero-3-phosphocholine (16:0a/18:0-GPCho), and 1-palmitoyl-2-oleoyl-sn-glycero-3-phosphoethanolamine (16:0a/18:1-GPEtn) used for this study were purchased from Avanti Polar Lipids (Alabaster, AL). Organic matrices 2,5-dihydroxybenzoic acid (DHB), alpha-cyano-4-hydroxycinnamic acid (α-CHCA), and 3,5-dimethoxy-4-hydroxycinnamic acid (sinapinic acid) were purchased from Aldrich Chemicals (Milwaukee, WI). All lipids were initially dissolved in chloroform to make stock solutions of 1 mM, and were subsequently diluted into working solutions at 100 μM in CH3CN: methanol: CHCl3 (4:4:1). Glass microscope coverslips (22 mm × 0.25 mm) were purchased from Fisher Scientific, MALDI plate inserts were purchased from Applied Biosystems (Foster City, CA).
Mouse brains used for tissue sections were flash frozen in liquid nitrogen immediately after dissection, and stored at −70 °C. The tissue was warmed to −15 °C, mounted onto a cutting chock with a mound of ‘Optimal Cutting Temperature Compound’ (OCT, Sakura Finetek, Torrence, CA) on the base of the tissue, sliced at 10 μm thickness with a cryostat (Leica CM 1900) , placed directly onto glass coverslips or MALDI plate inserts, and stored at −20 °C until matrix application and imaging.
A general description of the vacuum sublimation technique applied to this work is provided in an organic chemistry laboratory textbook [12]. The specific device used here to apply matrix to sectioned tissue samples was constructed over twenty years ago (Figure 1). A very similar device is commercially available (Sublimation apparatus 8023, Ace Glass, Vineland, NJ). A key component of the device was the flat bottom condenser to which the glass coverslips or MALDI plate inserts could be affixed using double sided thermally conductive tape (Product number 8865, 3M, St. Paul, MN). Matrix (300 mg) was added to the bottom section of the apparatus, the two pieces were assembled with an O-ring seal and connected to a direct drive vacuum pump (8 m3/hr). After 15 min at reduced pressure, the condenser was filled with cold water (15°C). After five additional min, heat was applied to the base of the sublimator via a heating mantle, the temperature was monitored using a thermocouple attached to the heating mantle, and time was measured from the onset of heat application. The sublimation of the solid matrix gradually progressed upon application of heat. The variable voltage regulator was set to 45 V and the temperature of the heating mantle increased gradually from 25 to 120 °C in 10 min. The deposition of matrix was visually observed to slowly move up the sides of the glassware to the level of the sample plate. Optimization of the amount of matrix that condensed onto the tissue was empirically determined by adjusting parameters of pressure, temperature at the condenser, amount of matrix, heat applied to matrix, and time of sublimation. A matrix layer that was too thin yielded very few ions and a matrix layer that was too thick yielded only matrix ions. Our optimal conditions were found to be 0.05 Torr pressure during sublimation, condenser temperature of 15°C, 45 V applied to the heating mantle, and 300 mg DHB as matrix added to the sublimator. A period of 10–11 min from the onset of heat application resulted in a thin uniform layer of matrix that yielded high quality images by MALDI mass spectrometry. After this time, the heat and condenser coolant were both removed, and the system was allowed to slowly come to room temperature while still under vacuum. Once equilibrated to room temperature, the system was brought to ambient pressure, opened, and the sample plate was carefully removed from the sublimation condenser and transferred to a MALDI plate holder for analysis by MALDI-TOF mass spectrometry.
Figure 1.
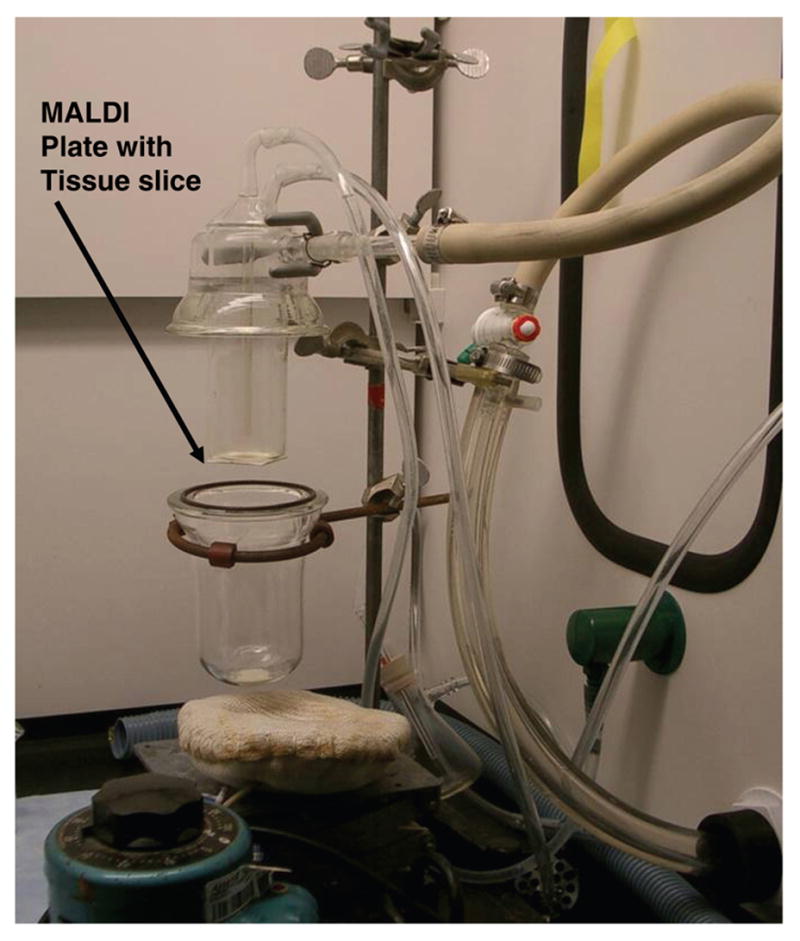
Photograph of sublimation device used to apply matrix to tissue samples for MALDI-MSI experiments. The tissue slice on the MALDI plate insert is attached to the underside of the condenser by thermal conducting tape.
The electrospray apparatus used for comparative matrix application consisted of a fixed position microspray needle, matrix solutions at 30 mg/mL made up in 1:1 H2O: CH3CN, 250 μL syringe, syringe pump set to flow at 1 μL/min, voltage of 1000 V applied to the spray needle. The sample plate was grounded, and moved mechanically at a rate of one mm/sec at a distance of 3 cm from the spray needle. Only plate regions with observably even electrospray deposition were used for imaging experiments.
Images were acquired using a quadrupole-TOF tandem mass spectrometer with an orthogonal MALDI source attached (QSTAR XL, Applied Biosystems/MDS Sciex, Thornhill, Ontario, Canada). MALDI mass spectra were obtained using standard conditions and 10 laser pulses from a nitrogen laser (337 nm) per image spot with a 0.5 sec accumulation time. Collisional activation of selected ions was carried out using relative collision energy of 40 volts with argon as collision gas. Mass spectrometric data were processed using software provided by Applied Biosystems/MDS Sciex at 10 units per amu, and images were visualized using BioMap software (Novartis, Basel, Switzerland).
Microscope images were taken with a Zeiss 510 laser scanning confocal microscope using an argon laser (488 nm) at 63× magnification.
Result and Discussions
Sublimation is a technique that has been utilized for centuries by chemists and alchemists seeking to enhance the quality of fermented products, or to improve the preparation of medicinal compounds [13]. Sublimation refers to the direct solid to gas phase transition which is an inherent property of individual molecular species. Heat and reduced pressure increase the mean free path of the subliming solid, and thereby enhance the rate of this phase transition, although many organic solids will decompose or melt prior to observing visible evidence of sublimation. When a substance sublimes, the deposition of the substance is at a molecular level as gaseous molecules recrystallize at the relatively cold surface of the condenser. The evenness of the coating onto the condenser surface reflects the random Brownian motion of the released gaseous matrix molecules. Sublimation has previously been reported as a method of MALDI matrix deposition for the analysis of insoluble compounds [14], but has not yet been reported for the analysis of tissue sections by MSI. Sublimation has been noted as a limiting factor in vacuum MALDI applications [15], but the MALDI ion source used in the experiments herein was operated at approximately 10 mTorr. Sublimation of matrix such as DHB onto tissue slices can be readily achieved using a glass sublimator and typical laboratory hardware.
The finely dispersed coating of the organic MALDI matrices that results from sublimation was visually evident on both the glass and metal surfaces used in this study. An example of this is shown in Figure 2A where DHB was applied by sublimation onto a sample section of mouse brain. Common matrices DHB, α-CHCA, and sinapinic acid were the only matrices tested at this time and all sublimed under reduced pressure (0.05 Torr) at temperatures between 120 °C and 140 °C without decomposition. An optimal coating of matrix was thick enough to yield abundant ions upon laser irradiation, yet sufficiently thin to utilize the spot overlap technique reported by Sweedler and coworkers [5]. The optimal amount of DHB (0.05 mg/cm2) was found by experiment to require 10 min of heating, at 0.05 Torr with the apparatus (Figure 1), and resulted in a layer between 4–5 μm thick. A close-up view of matrix deposited onto a glass coverslip is shown in Figure 2B. This image was captured with a confocal microscope using excitation light from an argon laser (488 nm) through a 63× objective.
Figure 2.
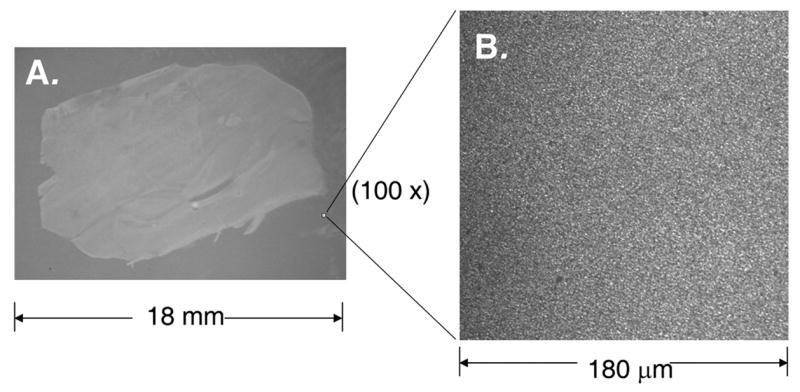
(A) Photograph (3x magnification) of a sagittal section (10 μm thickness) of a mouse brain placed on a stainless steel MALDI plate insert and coated with DHB matrix (4–5 μm thickness) by sublimation. (B) Confocal microscopic image of DHB crystals deposited onto a glass coverslip by sublimation.
A solution (100 μM) of a standard phospholipid compound 16:0/18:0-GPCho ([M+H]+ m/z 762.6) was applied to MALDI plates by robotic spotter. DHB was applied to one plate by ESI deposition and to another by sublimation. Images of these standard spots were acquired with 50μm × 50μm plate movement/pixel in positive ion mode and a comparison of these data is shown in Figure 3A–3D. The image of the GPCho standard with sublimed matrix (Figure 3A) was more uniform in appearance relative to the image of the GPCho standard with electrosprayed matrix (Figure 3C). The sublimed matrix standard also gave a significantly more intense signal (more ions upon laser irradiation), and fewer sodium adduct ions ([M+Na]+ m/z 784.6) when compared to the sample with ESI matrix deposition (Figure 3B and 3D).
Figure 3.

(A) Mass spectrometric image (MSI) of 1-palmitoyl-2-stearoyl-sn-glycero-3-phosphocholine standard (16:0, 18:0 GPCho) [M+H]+ m/z 762.6, spotted by robotic microspotter (100 pmol/ spot); DHB matrix was applied by sublimation. The image was acquired with 50 μm pixel size, smoothed and is displayed relative to the intensity scale shown to the left of the image. (B) Mass spectrum averaged over 100 pixels from the MSI of 1-palmitoyl-2-stearoyl-sn-glycero-3-phosphocholine standard (16:0, 18:0 GPCho) [M+H]+ m/z 762.6, [M+Na]+ m/z 784.6; DHB matrix was applied by sublimation. (C) MSI of 1-palmitoyl-2-stearoyl-sn-glycero-3-phosphocholine standard (16:0, 18:0 GPCho) [M+H]+ m/z 762.6, spotted by robotic microspotter (100 pmol/ 2 mm diameter spot); DHB matrix was applied by electrospray (30 mg/mL in 1:1 H2O:CH3CN). The image was acquired with 50 μm plate movements, smoothed, and is displayed relative to the intensity scale shown to the left of the image. (D) Mass spectrum averaged over 100 pixels from the MSI of 1-palmitoyl-2-stearoyl-sn-glycero-3-phosphocholine standard (16:0, 18:0 GPCho) [M+H]+ m/z 762.6, [M+Na]+ m/z 784.6; DHB matrix was applied by electrospray (30 mg/mL in 1:1 H2O:CH3CN)
The laser spot used in these imaging experiments was oval shaped with experimentally determined dimensions 400 × 200 μm. Sample plate movement at 50 μm × 50 μm/pixel with full ablation of the preceding spot resulted in a crescent shaped sampling area for each pixel with dimensions (assessed graphically) 250 μm × 150 μm at the edge of the laser spot where laser fluence was at fringe values. Furthermore, the pixelation of acquired data caused artifactual image broadening as in the example of a 50 μm analyte spot that might be analyzed with a single mass spectrum, or more likely from two consecutive spectra each with partial coverage of that 50 μm area. Therefore, although plate movement was controlled at 50μm × 50 μm, it was difficult to assess the image resolution based on applied instrument parameters.
A sagittal section (10 μm) of mouse brain was coated with DHB matrix by the sublimation method described and imaged in the positive ion mode by MALDI-TOF mass spectrometry. An average mass spectrum of the entire tissue region was calculated from the image database (Figure 4A). The mass range recorded in this image database was m/z 500–1100, but no ions with significant abundance appeared above m/z 900. In a separate experiment with this tissue slice, collisional activation of the most abundant ion observed at m/z 760.6 generated a product ion spectrum (Figure 4B) that supported the identity of this ion as a phosphocholine lipid, the molecular weight being consistent with 16:0a/18:1-GPCho, previously identified as a major glycerophosphocholine lipid component of rat and mouse brain [16,17]. The ion at m/z 826.6 in the region of the corpus callosum generated product ions upon collisional activation at m/z 767.6 (loss of 59 u, N(CH3)3) and m/z 163.1 (Figure 4C) indicative of a kaliated phosphocholine lipid adduct 18:1/18:1-GPCho [16]. Collisional activation of the ion at m/z 834.6 in the cerebellar region of the mouse brain tissue slice (Figure 4D) generated an abundant product ion at m/z 184.1 which supported its identity as 18:0a/22:6-GPCho.
Figure 4.
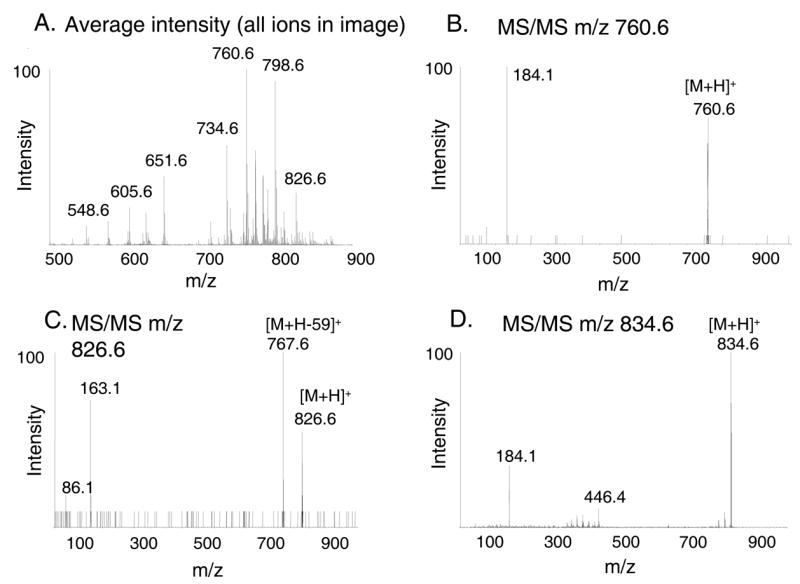
(A) The averaged full scan mass spectrum for the entire region of the brain tissue slice generated by MALDI. Matrix (DHB) was applied by sublimation, and the tissue was imaged as described in the text. (B) Product ions acquired in the cerebellar region of a sagittal section of mouse brain following collisional activation of the ion at m/z 760.6. Fragmentation to m/z 184 supports the identification of this molecule (imaged in Figure 5B) as a phosphocholine. The molecular mass was consistent with 1-palmitoyl-2-oleoyl-sn-glycero-3-phosphocholine (16:0, 18:1 GPCho, [M+H]+ m/z 760.6) (C) Product ions acquired in the corpus callosum region of the mouse brain section following collisional activation of the ion at m/z 826.6. The fragmentation pattern was consistent with identification as kaliated 18:0a/18:1-GPCho (imaged in Figure 5C). (D) Product ions acquired in the cerebellar region of a sagittal section of mouse brain from collisional activation of the ion at m/z 834.6. Fragmentation to m/z 184 supports the identification of this molecule (imaged in Figure 5D) as a phosphocholine. The molecular mass was consistent with 1-steroyl-2-dodecyl-sn-glycero-3-phosphocholine (18:0, 22:6 GPCho, [M+H]+ m/z 834.6)
A brain slice stained by Oil-Red-O (Figure 5A) taken 100 μm lateral to the imaged slice was used to evaluate the general anatomy of these sections analyzed by MALDI imaging along with a mouse brain atlas [18]. Mass spectrometric images of mouse brain (Figure 5B–D) appeared with high definition, texture, and discernable fine anatomical structure. The pattern delineated for the distribution of the ion at m/z 760.6 (Figure 5B) in a mouse brain sagittal section was clearly demarcated along the distinct subsections of the tissue when compared to Oil-Red-O stained tissue slice particularly in the region of the corpus callosum, striatum, and cerebellum. There was an appearance of mottling in the striatum region just beneath the corpus callosum, and underneath this was a long j-shaped region highlighting greater intensity of the ion at m/z 760.6. This region, the corpus callosum and the pyramidal tract at the base of the brain were highlighted specifically by the ion at m/z 826.6 (Figure 5C). These regions correspond to myelinated nerve fiber bundles connected one region of the brain to another. The prevalent appearance of specific phospholipids in defined regions was especially notable in the image generated by the ion at m/z 834.6 that is abundant in the cerebellum. The apparent increase of these phospholipid molecular species related to anatomical features of the mouse brain is under further investigation.
Figure 5.

(A) Mouse brain, sagittal section, stained with Oil Red O. Section was taken 100 μm lateral from the imaged slice. A tear in the tissue occurred in the pons region during the tissue cutting process. (B) Mass spectrometric image of mouse brain sagittal section acquired in positive ion mode, displayed at m/z 760.6. The image shown was acquired with 50 μm plate movements, and is displayed smoothed, relative to the intensity scale shown at the left of the image. The white bar indicates a 1 mm distance. (C) Mass spectrometric image of mouse brain sagittal section acquired in positive ion mode, displayed at m/z 826.6. The image shown was acquired with 50 μm plate movements, and is displayed smoothed with the scale intensity normalized to the most abundant ion at m/z 760.6. (D) Mass spectrometric image of mouse brain sagittal section acquired in positive ion mode, displayed at m/z 834.6. The image shown was acquired with 50 μm plate movements, and is displayed smoothed with the scale intensity normalized to the most abundant ion at m/z 760.6.
The sublimation technique for matrix application has several notable features. It was very reproducible, relatively inexpensive, and generated a high purity organic matrix directly applied onto the sample. How the gaseous matrix mixes with the phospholipids on the tissue surface is not clear and requires further study. The microcrystalline and highly pure nature of the matrix clearly enhanced the MALDI process for phospholipids and created good image definition when applying partial spot ablation with sequential plate movements. Also, the potential for spreading of analyte molecules due to solvents used in spray deposition was eliminated with this method. Matrix can be sublimated onto a variety of surfaces; glass coverslips, metallic tape, and stainless steel MALDI inserts were all used successfully in this initial work.
In summary, sublimation of matrix was found to be a facile technique that can be applied to mass spectrometric imaging of tissue samples with good results. The enhanced purity of matrix applied to the sample, the very small crystal size, and uniformity of deposition are factors that contribute to images with high definition. It is possible that this mode of matrix deposition may improve other techniques of imaging such as matrix assisted SIMS because of the small crystal size and uniformity of deposition.
Acknowledgments
This work was supported, in part, by the Lipid MAPS Large Scale Collaborative Grant (GM069338) and a grant from the Heart, Lung, and Blood Institute (HL034303), both from the National Institutes of Health. Technical assistance was provided by the University of Colorado at Denver Health Sciences Center Light Microscopy Facility, the University of Colorado at Denver Health Sciences Center Prostate Cancer Research Laboratories (M. Scott Lucia M.D. and E. Erin Genova, B.A.), and loan of equipment by the University of Colorado at Denver Chemistry Department (Robert Damrauer Ph.D.).
Footnotes
Publisher's Disclaimer: This is a PDF file of an unedited manuscript that has been accepted for publication. As a service to our customers we are providing this early version of the manuscript. The manuscript will undergo copyediting, typesetting, and review of the resulting proof before it is published in its final citable form. Please note that during the production process errors may be discovered which could affect the content, and all legal disclaimers that apply to the journal pertain.
References
- 1.Schwartz SA, Weil RJ, Johnson MD, Toms SA, Caprioli RM. Protein Profiling in Brain Tumors Using Mass Spectrometry: Feasibility of a New Technique for the Analysis of Protein Expression. Clin Cancer Res. 2004;10:981–987. doi: 10.1158/1078-0432.ccr-0927-3. [DOI] [PubMed] [Google Scholar]
- 2.Khatib-Shahidi S, Andersson M, Herman JL, Gillespie TA, Caprioli RM. Direct Molecular Analysis of Whole-Body Animal Tissue Sections by Imaging MALDI Mass Spectrometry. Anal Chem. 2006;78:6448–6456. doi: 10.1021/ac060788p. [DOI] [PubMed] [Google Scholar]
- 3.Garrett TJ, Prieto-Conaway MC, Kovtoun V, Bui H, Izgarian N, Stafford G, Yost RA. Imaging of Small Molecules in Tissue Sections With a New Intermediate-Pressure MALDI Linear Ion Trap Mass Spectrometer. Intl J Mass Spectrom. 2007;260:166–176. [Google Scholar]
- 4.Aerni HR, Cornett DS, Caprioli RM. Automated Acoustic Matrix Deposition for MALDI Sample Preparation. Anal Chem. 2006;78:827–834. doi: 10.1021/ac051534r. [DOI] [PubMed] [Google Scholar]
- 5.Jurchen JC, Rubakhin SS, Sweedler JV. MALDI-MS Imaging of Features Smaller Than the Size of the Laser Beam. J Am Soc Mass Spectrom. 2005;16:1654–1659. doi: 10.1016/j.jasms.2005.06.006. [DOI] [PubMed] [Google Scholar]
- 6.Chaurand P, Norris JL, Cornett DS, Mobley JA, Caprioli RM. New Developments in Profiling and Imaging of Proteins From Tissue Sections by MALDI Mass Spectrometry. J Proteome Res. 2006;5:2889–2900. doi: 10.1021/pr060346u. [DOI] [PubMed] [Google Scholar]
- 7.Touboul D, Kollmer F, Niehuis E, Brunelle A, Laprevote O. Improvement of Biological Time-of-Flight-Secondary Ion Mass Spectrometry Imaging With a Bismuth Cluster Ion Source. J Am Soc Mass Spectrom. 2005;16:1608–1618. doi: 10.1016/j.jasms.2005.06.005. [DOI] [PubMed] [Google Scholar]
- 8.Winograd N. The Magic of Cluster SIMS. Anal Chem. 2005;77:143A–149A. [Google Scholar]
- 9.Lechene C, Hillion F, McMahon G, Benson D, Kleinfeld AM, Kampf JP, Distel D, Luyten Y, Bonventre J, Hentschel D, Park KM, Ito S, Schwartz M, Benichou G, Slodzian G. High-Resolution Quantitative Imaging of Mammalian and Bacterial Cells Using Stable Isotope Mass Spectrometry. J Biol. 2006;5:20.1–20.30. doi: 10.1186/jbiol42. [DOI] [PMC free article] [PubMed] [Google Scholar]
- 10.Altelaar AF, van Minnen J, Jimenez CR, Heeren RM, Piersma SR. Direct Molecular Imaging of Lymnaea Stagnalis Nervous Tissue at Subcellular Spatial Resolution by Mass Spectrometry. Anal Chem. 2005;77:735–741. doi: 10.1021/ac048329g. [DOI] [PubMed] [Google Scholar]
- 11.Milne S, Ivanova P, Forrester J, Brown AH. Lipidomics: An Analysis of Cellular Lipids by ESI-MS. Methods. 2006;39:92–103. doi: 10.1016/j.ymeth.2006.05.014. [DOI] [PubMed] [Google Scholar]
- 12.Pavia DL, Lampman GM, Kriz GS., Jr . Introduction to Organic Laboratory Techniques: A Contemporary Approach. 2. Saunders College Publishing; New York: 1982. [Google Scholar]
- 13.French J. The art of distillation or a treatise of the choicest spagyrical preparations, experiments, and curiosities, performed by way of distillation. In: Cotes E, editor. Art of Distillation. Vol. 1667. T. Williams; London: pp. 1616–1657. [Google Scholar]
- 14.Kim SH, Shin CM, Yoo JS. First Application of Thermal Vapor Deposition Method to Matrix-Assisted Laser Desorption Ionization Mass Spectrometry: Determination of Molecular Mass of Bis(p-Methyl Benzylidiene) Sorbitol. Rapid Commun Mass Spectrom. 1998;12:701–704. [Google Scholar]
- 15.Jackson SN, Wang HY, Woods AS. In Situ Structural Characterization of Glycerophospholipids and Sulfatides in Brain Tissue Using MALDI-MS/MS. J Am Soc Mass Spectrom. 2007;18:17–26. doi: 10.1016/j.jasms.2006.08.015. [DOI] [PubMed] [Google Scholar]
- 16.Jackson SN, Wang HY, Woods AS. In Situ Structural Characterization of Phosphatidylcholines in Brain Tissue Using MALDI-MS/MS. J Am Soc Mass Spectrom. 2005;16:2052–2056. doi: 10.1016/j.jasms.2005.08.014. [DOI] [PubMed] [Google Scholar]
- 17.Sjovall P, Lausmaa J, Johansson B. Mass Spectrometric Imaging of Lipids in Brain Tissue. Anal Chem. 2004;76:4271–4278. doi: 10.1021/ac049389p. [DOI] [PubMed] [Google Scholar]
- 18.Paxinos G, Franklin KBJ. The Mouse Brain in Stereotaxic Coordinates. 2. Academic Press; San Diego, CA: 2001. [Google Scholar]