Abstract
A range of immune parameters were measured during a primary infection of Strongyloides ratti in its natural rat host. The immune parameters measured were IL-4 and IFN-γ from both the spleen and MLN cells; parasite specific IgG1, IgG2a and IgG2b in serum and in intestinal tissue; parasite specific IgG and total IgE in serum; parasite specific and total IgA in intestinal tissue and rat mast cell protease II in intestinal tissue. Parasite specific IgG1, IgG2a and total IgE in serum and parasite specific IgA and rat mast cell protease II in intestinal tissue all occurred at significantly greater concentrations in infected animals, compared with non-infected animals. Similarly, the production of IL-4 by MLN cells stimulated with parasitic female antigen or ConA occurred at significantly greater concentrations in infected animals, compared with non-infected animals. In all, this suggests that there is a Th2-type immune response during a primary S. ratti infection. These data also show the temporal changes in these components of the host immune response during a primary S. ratti infection.
Keywords: Strongyloides, T-helper 2
Introduction
Host immune responses reduce the fitness of parasitic nematodes. For Strongyloides ratti in its rat host, this is manifest as a reduction in the size of the parasitic female stages, a consequent reduction in their per capita fecundity, the adoption of a more posterior position in the host gut and, ultimately, the death of these stages1,2,3. That these effects are dependent on the host immune response is shown because these effects do not occur in athymic, nude rats; are reversible if the parasitic stages are transferred surgically to naïve hosts, or if hosts are immunosuppressed1,2,4,5,6. The host immune response is also required for negative density-dependent effects on the survival and per capita fecundity of S. ratti7. In addition, the host immune response also affects the developmental route of the free-living stages of the S. ratti life-cycle8,9. All of these effects mean that, ultimately, the host immune response will have significant effects on the population biology of S. ratti.
In the S. ratti life-cycle, free-living infective third stage larvae (iL3s) infect hosts by penetrating their skin, after which they migrate via the naso-frontal region of the head,10 from where, presumably, they are swallowed; during this migration they moult via the L4 stage into parasitic stages. The parasitic stages of S. ratti are female only, which reproduce by parthenogenesis11; reproduction commences from approximately four days post infection (p.i.). The parasitic females are embedded in the mucosa of the small intestine of the host, through which they migrate, producing eggs which then pass out of the host in faeces.
In S. ratti infections in rats there are distinct immune responses that act against the migratory and enteric phases12. The presence of intestinal parasitic females induces protection against parasitic stages that are either implanted directly or develop naturally from subcutaneous iL3s13. However, the presence of the migratory phase of the S. ratti life-cycle only induces partial protection against directly implanted parasitic stages14. Protection against migrating larvae can be induced by the transfer of serum from S. ratti-infected to recipient S. ratti-naïve rats and this protective effect is greater for an IgG1 enriched fraction15. Analogous transfer of mesenteric lymph node (MLN) cells also transfers an anti-S. ratti effect that is effective against intestinal parasitic females16.
The immunoglobulin response of rats to S. ratti infections is biased towards IgG and IgE isotypes. Temporal analysis of the immune response to repeated S. ratti infections of different doses has shown that IgG responses are observed to occur in a dose-dependent manner from approximately two weeks p.i., asymptotically approaching its maximum approximately four weeks p.i.17. The IgE response is also related to dose, but was not observed to develop until three weeks p.i., after which it rapidly increases17. Rats infected with a high dose of S. ratti have raised MLN cell and peripheral blood lymphocyte blastogenesis prior to and approximately co-incident, respectively, with the loss of S. ratti stages passed in faeces18. In these same animals, anti-S. ratti iL3-specific IgG was greatest approximately 30 days p.i., after which it declined18. However, the S. ratti-specificity of these effects is not clear because no non-S. ratti infected controls were used in these observations. Passive cutaneous anaphylaxis assays have shown that anti-S. ratti IgE titres were greatest 30 days p.i., after which they declined though, again, the S. ratti-specificity of these effects is not clear because no non-S. ratti infected controls were used19. Repeated administration of S. ratti iL3s reduced these IgE responses; these responses also appear to be greatest in response to the intestinal parasitic stages, rather than the iL3, or subsequent migrating larval stages19.
There has been extensive immunological analyses of S. ratti infections in mice. Mice are a non-natural host of S. ratti and infections of mice are shorter lived compared with infections in rats. The significance of immunological findings in this abnormal host-parasite combination must therefore be in question20.
Experimental work with S. ratti infections in mice has implicated intestinal mast cells in limiting the course of such infections, as has been observed for a number of other helminth infections21. Administration of IL-13 both increased small intestine mastocytosis and decreased survival of parasitic stages transferred directly to the gut22. S. ratti infections of mast cell deficient mice are more fecund and longer lived compared with infections of normal, control mice23. Administration of IL-13 to S. ratti-infected nude mice resulted in an increased loss of S. ratti parasitic females concomitant with an increased intestinal mastocytosis, compared with control non-IL-13 treated nude mice24.
Given the relative paucity of immunological analysis of S. ratti infections in rats, we have undertaken a comprehensive analysis of the temporal change in a range of immunoglobulin isotypes, in both serum and tissue of the small intestine, as well as cytokine responses of lymphoid cells during a primary S. ratti infection. The purpose of doing this was therefore to determine which components of the host immune response changed in response to S. ratti infection, at what time these changes occurred and at which sites within a host these changes occurred. There are no such extant data, of which we are aware, and we therefore wished to determine this baseline information prior to undertaking other immunological analyses of S. ratti infections in rats. Immunological analysis of a range of parasitic nematode infections has shown that the immune response generated by these infections is typically of a T-helper 2 (Th2)-type response25,26. In view of this we particularly measured IgG1 and IgA immunoglobulins and the production of IL-4 as indicators of a Th2-type immune response and IgG2a and IgG2b immunoglobulins and the production of IFN-γ as indicators of a Th1-type immune responses. In all, these data therefore provide a firm foundation for other, future immunological analyses of S. ratti in its natural rat host.
Materials and Methods
Parasites and infections
Strongyloides ratti isofemale line ED321 Heterogonic was used throughout and maintained by serial passage in female Wistar rats as previously described27.
To investigate the immune response of rats during a S. ratti infection, 28 female Wistar rats (c. 100g) (B & K Universal, UK) were randomly allocated equally to one of two groups. The experimental group were infected with 500 iL3s of S. ratti by subcutaneous injection27. The control group were given a sham inoculation of phosphate buffered saline (PBS) only. To determine the reproductive output of the infections, faecal material was collected from two animals from each group on days 7, 9, 13, 16, 20, 23 & 27 p.i. and the faeces cultured and maintained for two days at 25°C after which the total number of worms that developed was determined, as previously described7. These analyses therefore encompass the time during which parasitic females are present in the host gut.
To prepare antigen from parasitic females for use in immunological assays (below) parasitic females were recovered from S. ratti-infected rats, concentrated by centrifugation and resuspension and cleaned on a Percoll gradient, resuspended in PBS, snap frozen in liquid nitrogen and stored at −20°C until required, as previously described3. Pools of such parasitic females were homogenised, the resulting homogenate centrifuged at 14,000g at 4°C for 5 min., the supernatant removed and the protein concentration determined against bovine serum albumin (BSA) standards using Bradford's reagent28. This parasitic female antigen was stored at −20°C until required. Infective third stage larvae antigen was also prepared. To do this, iL3s were obtained from faecal cultures, cleaned by repeated sedimentation and resuspension in water, after which they were resuspended in PBS and then treated as for the parasitic female antigen preparation (above).
To prepare hyperimmune rat serum, rats were infected at least twice with 1,000 S. ratti iL3s one month apart, the rats sacrificed one month after the last infection and blood taken by cardiac puncture. This was allowed to coagulate for one hour at room temperature (RT) and was then centrifuged at 14,000g at 4°C for 5 min., and the serum harvested and then stored as aliquots in fresh tubes at −20°C.
Serum and tissue sampling
Animals from which faeces were collected were sacrificed on the following day, i.e. days 8, 10, 14, 17, 21, 24 & 28 p.i., respectively. Blood samples were taken immediately after sacrifice by cardiac puncture and processed, as described above. The spleen and MLN were recovered by dissection and immediately placed in RPMI media (RPMI 1640, 10% v/v foetal calf serum, 2mM L-glutamine, 100U/ml penicillin, 100ug/ml streptomycin, 0.05 mM 2-mercaptoethanol) (Gibco, UK) on ice. Spleens cells were prepared by gently passing the spleen through a 100μm cell sieve and washing through with ice cold RPMI media; the cell suspension was centrifuged at 400g at 4°C for 5 min. and the sedimented cells resuspended in RPMI media. Red blood cells were lysed with 5ml ACK buffer (155mM NH4Cl, 10mM KHCO3, 0.1mM EDTA, pH 7.2-7.4) for 5 min., diluted with further RPMI media and the cells sedimented by centrifugation as above, after which they were finally resuspended in fresh RPMI media. MLN cells were prepared in the same manner except that there was no treatment with ACK buffer; instead of this step, the cells were sedimented and resuspended in RPMI media. Trypan blue exclusion was used to determine the concentration of viable spleen and MLN cells.
The small intestine was also collected by dissection and stored at −20°C prior to processing. At least four samples from along the small intestine to a total mass of approximately 1g were taken and homogenized in 4ml of ice cold PBS / 1g of tissue; the homogenate centrifuged at 5,500g at 4°C for 15 min., the supernatant removed to a fresh tube and then re-centrifuged at 16,100g at 4°C for 10 min. and the supernatant stored at −20°C.
Immunological assays
The components of the rats immune response that were measured are as follows: interleukin-4 (IL-4) and interferon-γ (IFN-γ) from both the spleen and MLN cells; parasite specific IgG1, IgG2a and IgG2b in serum and in intestinal tissue; parasite specific IgG in serum; total IgE in serum; parasite specific and total IgA in intestinal tissue and rat mast cell protease II (RMCPII) in intestinal tissue.
For assays of IL-4 and IFN-γ production from the spleen and MLN cells, 1 × 10⁶ cells (above) were stimulated, in triplicate, with (i) concanavalin A (ConA) (Sigma, UK), (ii) parasitic female antigen, both at a final concentration of 5μg/ml or (iii) RPMI media only in a total volume of 200μl. Cells were incubated at 37°C in a 5% carbon dioxide atmosphere for 48 hr. after which the resultant supernatants were recovered and stored at −20°C. The concentration of IL-4 and IFN-γ were assayed with commercially available sandwich ELISA kits (GE Healthcare, UK) following the manufacturer's instructions. The mean concentration of IL-4 and IFN-γ of the triplicate assays for the parasitic female antigen and ConA stimulations are reported as above the control background, i.e. stimulation with RPMI media only.
The concentration of parasite specific immunoglobulin was assayed using indirect capture ELISAs. Samples were used in duplicate in a doubling serial dilution; 100μl BSA-PBS-Tween (0.5% w/v BSA in 0.1% v/v Tween-20 in PBS) was used for negative controls. ELISA plates were coated with 100μl parasitic female antigen at a final concentration of 5μg/ml in 0.05M carbonate-bicarbonate buffer (pH 9.6) (Sigma, UK) and incubated overnight at 4°C. Plates were then washed in 300μl PBS-Tween three times and tapped dry; they were then blocked with 100μl BSA-PBS-Tween and incubated at RT for 1hr. Plates were washed again (as above) and then 100μl of sample or negative control were added and diluted in BSA-PBS-Tween. The plates were incubated at RT for 2hr. Plates were then washed, as above, and 100μl of detection antibody in BSA-PBS-Tween at the appropriate dilution (1:800, goat anti-rat IgA-Horseradish peroxidase conjugate (HRP); 1:3000, goat anti-rat IgG1, IgG2a, IgG2b and IgG-HRP conjugates) (Nordic, Netherlands) were added and the plates incubated at RT for 2hr. Plates were then washed again and 100μl 0.04% w/v o-phenylenediamine dihydrochloride (Sigma, UK), 1.2% v/v hydrogen peroxide in 0.05M phosphate-citrate buffer (pH 5.0) (Sigma, UK) added; plates were kept in the dark at RT for approximately 10 min. Reactions were stopped with 50μl of 3M sulphuric acid per well and optical densities were measured at 490nm with a background reading at 415nm, using a microplate reader (Bio-Rad, UK). For analysis of parasite specific IgA all incubation steps were for 1hr, rather than 2hr (above).
For analysis of total IgE and total IgA, the same procedure was used except that the plates were coated with IgE and IgA capture antibodies, respectively, at 2.5μg/ml (goat anti-rat IgE, IgA) (Nordic, Netherlands); the detection antibody was a 1:1600 dilution of goat anti-rat IgE-HRP conjugate and a 1:800 dilution of goat anti-rat IgA-HRP conjugate (Nordic, Netherlands), respectively, and the incubation steps were 1hr. rather than 2hr., as above.
For analysis of IgG and IgG1 (above), standard curves were constructed using a dilution series of hyperimmune rat serum in place of the experimental samples (above); otherwise, the ELISAs were performed exactly as described above. The concentrations of the experimental samples were expressed as proportions of the hyperimmune serum control. For analysis of IgG2a, IgG2b, IgA, IgE, standard curves were constructed using a dilution series of purified recombinant antibody. This was done because insufficient of these isotypes were detected in hyperimmune serum. To do this plates were coated with 5μg/ml goat anti-rat IgG2a, IgG2b or 2.5μg/ml goat anti-rat IgA or IgE (Nordic, Netherlands), respectively, overnight and in place of the samples (above) known concentrations of recombinant IgG2a, IgG2b, IgA or IgE (Serotec, UK), respectively, were used; otherwise, the ELISAs were performed exactly as described above. The concentrations of the experimental samples were expressed as equivalents of the standard, recombinant antibody in ng/ml.
The concentration of RMCPII in intestinal tissue was determined using a commercially available indirect sandwich ELISA kit (Moredun Scientific Ltd., UK) which was used following the manufacturer's instructions.
To compare the efficacy of parasitic female antigen and iL3 antigen as the coating antigen in the ELISA, plates were coated with 5μg/ml parasitic female antigen (as above) or with iL3 antigen at a range of concentrations from 1 - 50 μg/ml, inclusive. A dilution series of intestinal tissue homogenates and serum samples from two rats from which hyperimmune serum was prepared (above) were used as the test samples in the ELISA, which, otherwise, was performed exactly as described above; the detection antibody was goat anti-rat IgG-HRP conjugate (Nordic, Netherlands).
Statistical analysis
ELISA optical density readings below the limit of the respective standard curve were set to zero. This resulted in left censored data for all immune measures, such that a Tobit model29 was used with this skewed distribution. A Tobit model assumes that above the threshold for censored data, the data are independent and normally distributed. Where necessary, data were first normalised using a Box-Cox transformation and then fitted with a Tobit regression model using the Survreg function in R (www.r-project.org), according to procedures previously outlined30. For each immunological measure the factors of Treatment (i.e. infected or non-infected), Time p.i. and their interaction (Treatment*Time p.i.) were fitted and the minimal model determined by deletion testing to generate a χ2 statistic. The significance of the effect of these individual factors and their interactions are reported throughout the results section. In addition, for each of the immunological parameters the minimal model, and the significance of the difference between this and the null model, is reported in the figure legends. Day 21 p.i cytokine data were excluded from the analysis due to the interruption of the carbon dioxide supply to these cells during their stimulation.
Results
Infections
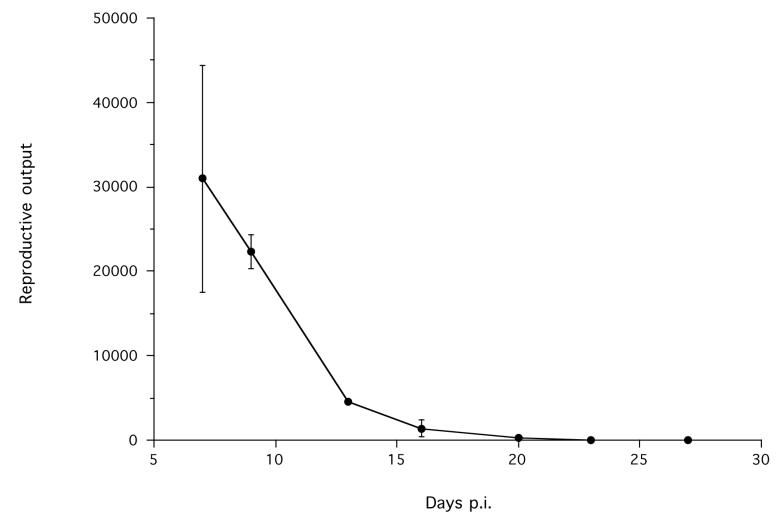
The mean S. ratti reproductive output was greatest at 7 days p.i., the first day of sample, after which it declined (Figure 1). At days 23 and 27 p.i., no S ratti stages were detected in faeces. Similarly, none were detected in the control, non-infected group at any time.
Figure 1.
The mean reproductive output of S. ratti infections. There were no S. ratti stages detected in non-infected control animals (not shown). Error bars are ±1 S.E.
Immunological assays
Serum
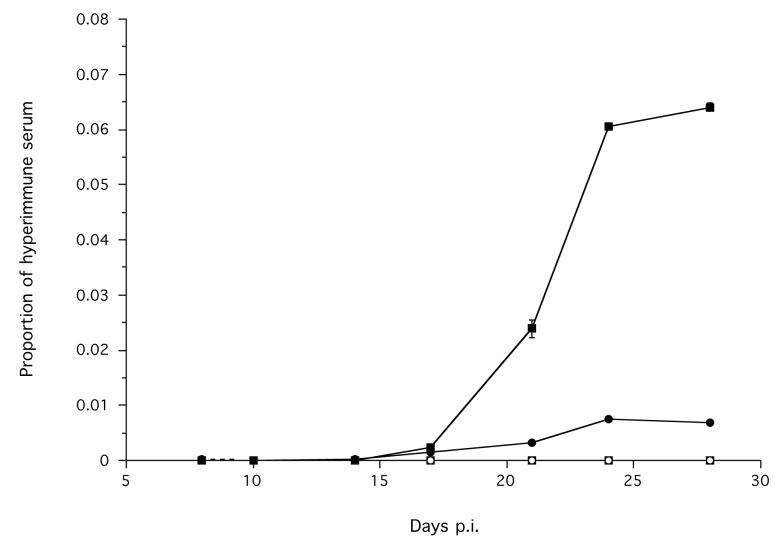
Parasite specific IgG, IgG1, IgG2a and IgG2b and total IgE were all detected in serum. Infected animals had a significantly greater concentration of parasite specific IgG1, compared with non-infected animals, which increased during the course of the infection to a maximum from day 24 p.i. (Treatment χ12 = 34.55, p < 0.0001; Time p.i. χ12 = 30.17, p < 0.0001) (Figure 2a). There was no statistically significant difference in the concentration of IgG between infected and non-infected animals (Figure 2a). However, visual inspection of the data suggests that there is some small increase in IgG during an infection in infected animals reaching its maximum at days 24 and 28 p.i. (Figure 2a). The temporal profile of IgG1 and IgG (Figure 2a) is qualitatively similar, which may suggest that IgG1 is the dominant feature of the measured IgG response.
Figure 2.
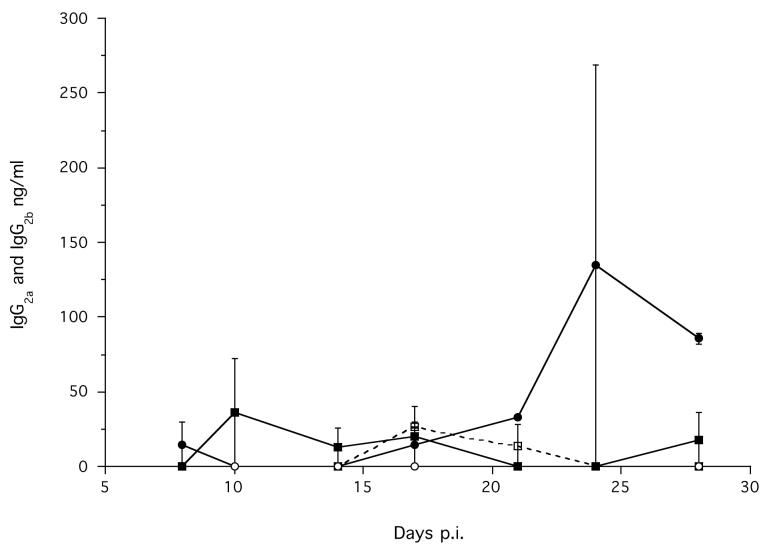
The mean serum concentration of parasite specific (a) IgG (●) and IgG1 (■), (b) IgG2a (●) and IgG2b (■) in infected (solid symbols, solid line) and non-infected control (hollow symbols, dashed line) animals during an infection. Error bars are ±1 S.E. Note the different scales. The mean values of proportion of hyperimmune serum in (a) were calculated from transformed data, but back transformed values are shown here. The minimum models are: IgG1 = −10.20 + 6.21×Treatment + 0.270×Time p.i., χ22 = 45.21, p < 0.0001; IgG2a = = −6.52 + 5.49×Treatment + 0.74× Time p.i., χ22 = 18.11, p = 0.00012.
2a.
2b.
Infected animals also had a significantly greater concentration of parasite specific IgG2a, compared with non-infected animals, which increased during the course of the infection (Treatment χ12 = 15.43, p < 0.0001; Time p.i. χ12 = 4.32, p = 0.037) (Figure 2b). There were no significant effects of Treatment or Time p.i. on parasite specific IgG2b (Figure 2b). The absolute concentration of parasite specific IgG2b was very low compared with IgG2a (Figures 2b).
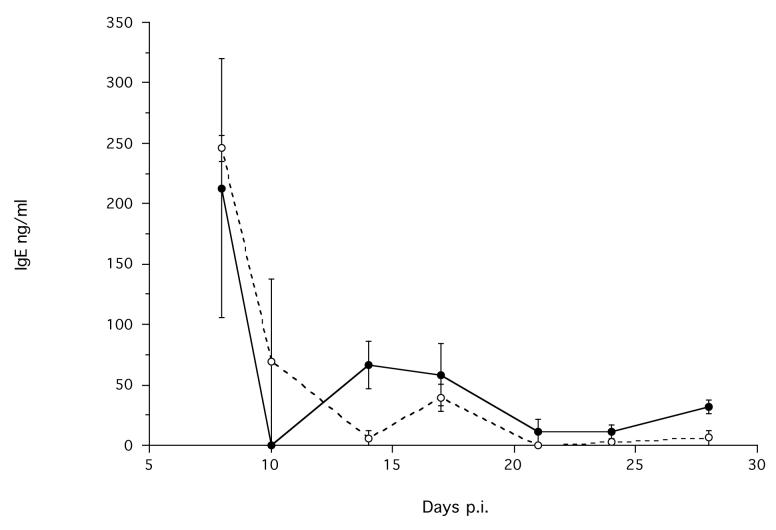
There was no difference in the concentration of total IgE produced by infected and non-infected animals, but the concentration did change during the experiment (Time p.i. χ12 = 4.24, p < 0.039) (Figure 3). Visual inspection shows that there is an apparent maximum production of IgE at the start of the experiment in both groups, perhaps due to the subcutaneous administration of material (parasites or PBS) (Figure 3).
Figure 3.
The mean serum concentration of total IgE in infected ( ) and non-infected control (--○--) animals during an infection. Error bars are ±1 S.E. The minimum model is IgE = −5.48 - 0.14×Time p.i., χ12 = 4.24, p = 0.039.
Intestinal tissue
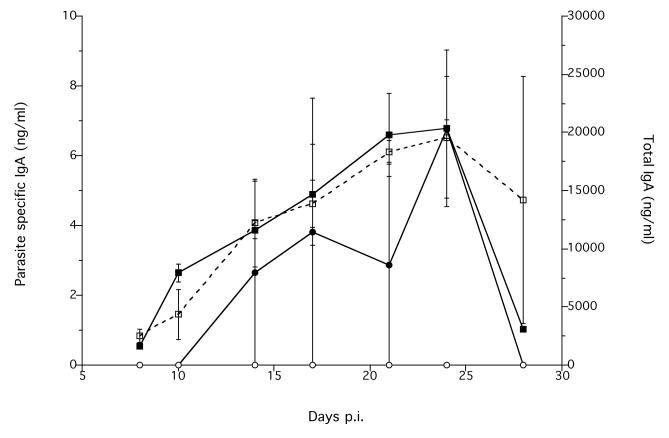
Infected animals had a significantly greater concentration of parasite specific IgA, compared with non-infected animals (Treatment χ12 = 6.83, p < 0.0089) (Figure 4). Visual inspection of the data suggest that this also increased during the infection (Figure 4). There was no difference between infected and non-infected animals in the concentration of total IgA, though there is a suggestion that this increased during the course of the experiment in both groups of animals (Figure 4).
Figure 4.
The mean intestinal tissue concentration of parasite specific (●) and total IgA (■) in infected (solid symbols, solid line) and non-infected control (hollow symbols, dashed line) animals during an infection. Error bars are ±1 S.E. Note the different scales. The minimum model is parasite specific IgA = −1.9×10⁻¹⁸ + 0.70×Treatment, χ12 = 6.83, p = 0.0089.
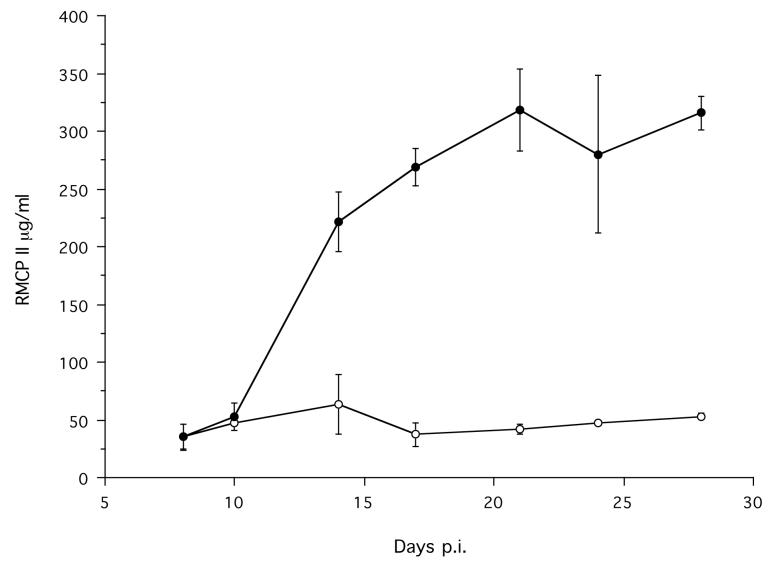
Infected animals had a significantly greater concentration of RMCPII, compared with non-infected animals (Treatment χ12 = 49.53, p < 0.0001) and this increased during the course of the infection (Time p.i. χ12 = 33.42, p < 0.0001; Treatment*Time p.i. χ22 = 23.90, p < 0.0001) (Figure 5). Essentially no parasite specific IgG1, IgG2a, or IgG2b was detected in intestinal tissue (data not shown).
Figure 5.
The mean intestinal tissue concentration of RMCPII in infected (●) and non-infected control (○) animals during an infection. Error bars are ±1 S.E. The minimum model is RMCPII = 64327 − 96814×Treatment −1391×Time p.i. + 16292×Treatment*Time p.i., χ32 = 53.6, p < 0.0001.
Comparison of parasitic female and iL3 antigen sources
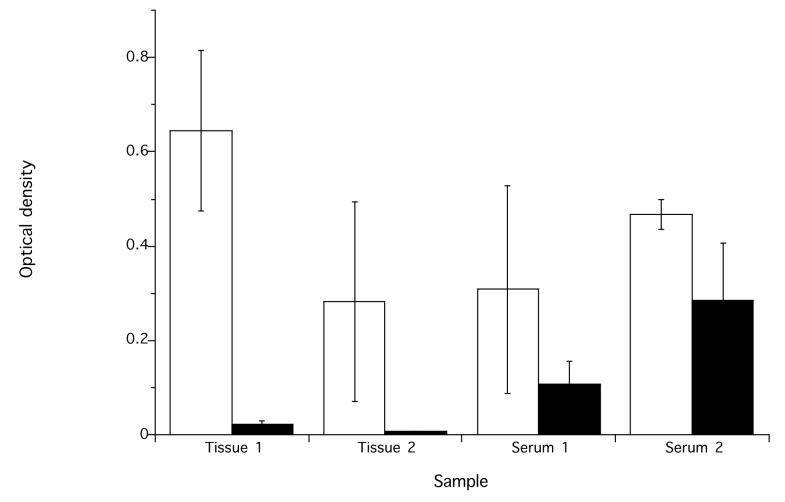
The use of parasitic female antigen resulted in greater detection of IgG, compared with the use of iL3 antigen (Figure 6). This shows either that there is IgG immunological cross reaction between these two antigen sources and, or that the rat anti-S. ratti IgG immune response is made in response to both the iL3 and parasitic female stages, but with the latter predominating.
Figure 6.
The optical densities of 1/32 dilutions of two intestinal tissue homogenates and 1/50 dilutions of two serum samples with parasitic female (open bars) and iL3 antigen (black bars) both at a concentration of 5μg/ml. Error bars are ± 1 S.E.
Cytokines
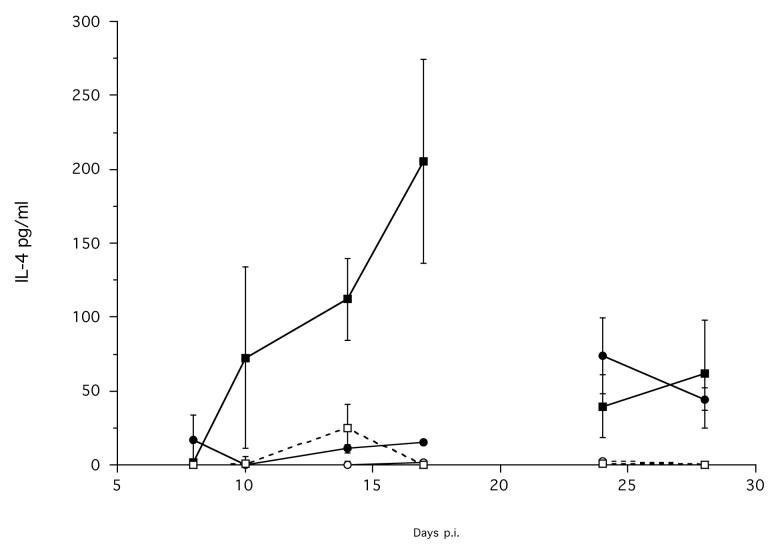
MLN cells of infected animals produced a significantly greater concentration of IL-4, compared with non-infected animals, when stimulated with S. ratti parasitic female antigen (Treatment χ12 = 16.02, p < 0.0001) (Figure 7a). This production of IL-4 increased rapidly from approximately day 10 p.i., to an apparent maximum on day 17 p.i. The MLN cells of infected animals also produced a significantly greater concentration of IL-4, compared with non-infected animals, when stimulated with ConA; this also increased during the infection (Treatment χ12 = 12.49, p = 0.0004; Time p.i. χ12 = 9.73, p = 0.0018) (Figure 7a). The absolute concentration of IL-4 produced in response to ConA stimulation was much lower compared to that produced in response to stimulation with parasitic female antigen.
Figure 7.
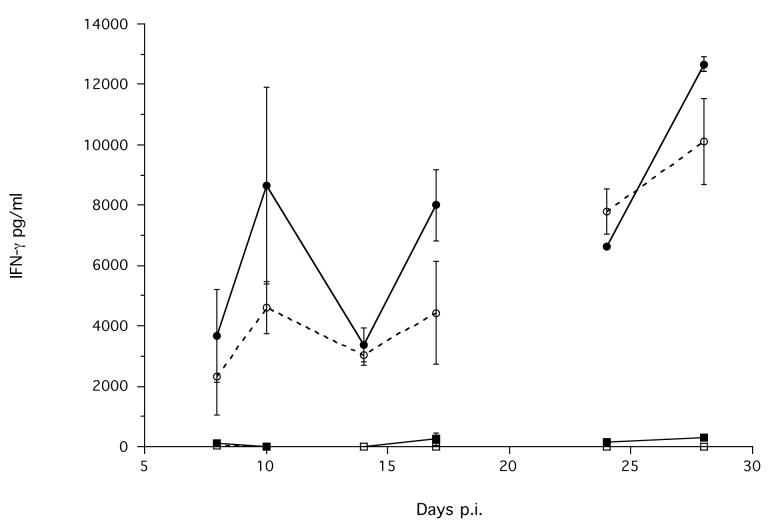
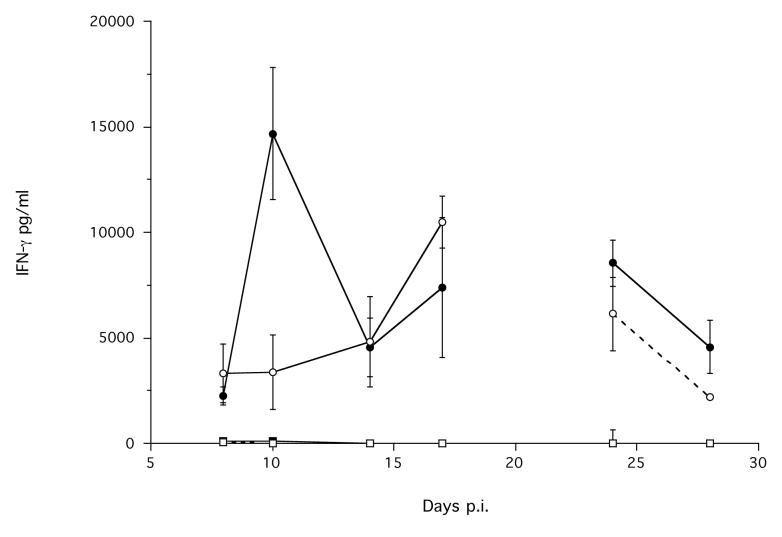
The mean concentration of (a) IL-4 produced by MLN cells; IFN-γ produced by (b) MLN and by (c) spleen cells, stimulated with parasitic female antigen (■ or □) or ConA (● or ○) from infected (solid symbols, solid lines) and non-infected control (hollow symbols, dashed lines) animals during an infection. Error bars are ±1 S.E. Note the different scales. Data are not shown for day 21 p.i., due to the interruption of the carbon dioxide supply to these cells during their stimulation; see materials and methods. The minimum models are: IL-4 MLN stimulated with parasitic female antigen = 0.107 + 4.1×Treatment, χ12 = 16.02, p < 0.0001; IL4 MLN stimulated with ConA = −1.33 + 1.65×Treatment + 0.093×Time p.i., χ22 = 18.61, p < 0.0001; IFN-γ MLN stimulated with ConA = 1195 + 320.8×Time p.i., χ12 = 14.9, p = 0.0001; IFN-γ MLN stimulated with parasitic female antigen = −0.31 + 0.95×Treatment, χ12 = 7.1, p = 0.0078.
7a.
7b.
7c.
The MLN cells also produced IFN-γ in response to stimulation with ConA, but there was no difference between infected and non-infected animals, and this production did change during the experiment (Time χ12 = 14.9, p = 0.0001). The MLN cells of infected animals produced a significantly greater concentration of IFN-γ, compared with non-infected animals, when stimulated with parasitic female antigen (Treatment χ12 = 7.1, p = 0.0077) (Figure 7b). However, the absolute concentration of IFN-γ produced by MLN cells in response to parasitic female antigen was very low compared to that produced in response to ConA (Figure 7b).
Spleen cells stimulated with ConA produced IFN-γ, though there was no difference between infected and non-infected animals, and this did not change during the experiment (Figure 7c). There was essentially no such response to stimulation with parasitic female antigen (Figure 7c). Spleen cells stimulated with ConA or with parasitic female antigen produced a very low concentration of IL-4 (data not shown).
Discussion
These results describe, for the first time, the immune response elicited by a primary S. ratti infection in rats, the host species in which the parasite has evolved. Overall, the observed immune response is consistent with the generation of a Th2-style response that becomes manifest some two to three weeks p.i. This is consistent with the now widely reported Th-2 response induced by helminth infections26.
There is a circulating specific anti-S. ratti IgG1 response that increases during the infection, but which peaks after the worms have been expelled (Figures 1 and 2)3. These data are consistent with the previous demonstration of the passive transfer of anti-S. ratti immunity with serum, principally IgG115. There is also a circulating specific anti-S. ratti IgG2a response that increases during the infection (Figure 2a). This IgG2a response is not fully consistent with a Th2-type immune response. Comparison of iL3 and parasitic female antigen sources, show that there is a greater measurable IgG response against the parasitic female antigen source (Figure 6), which is consistent with this being the main source and target of the host's IgG response. In intestinal tissue, there is a specific anti-S. ratti IgA response which increases during the infection, and which like IgG1, is at its maximum when the S. ratti infection is terminated (Figure 4). In the same tissue, there is an increase in the concentration of RMCPII, which approaches its maximum from approximately 17 days p.i., after which it remains elevated (Figure 5). This finding is consistent with the previous implication of mast cells in the clearance of S. ratti infections23,24. We observed an apparent total IgE response to both S. ratti infection and control sham infection (Figure 2). Previous studies also observed an increase in IgE titre following S. ratti infection, though, in view of our findings and the absence of control, non-infected animals in this previous work, this is unlikely to be S. ratti-specific19.
The principal cytokine response to stimulation with S. ratti parasitic female antigen of S. ratti-infected animals was the production of IL-4 by MLN cells, with this maximum at day 17 p.i., before the S. ratti infection is cleared (Figure 7a). MLN cells from S. ratti infected rats also produced a low level IL-4 in response to stimulation with ConA. In contrast, the dominant production of IFN-γ by these MLN cells was only in response to ConA, and this did not differ between infected and non-infected animals.
These findings have implications for understanding how hosts limit and terminate S. ratti infections. The peak anti-S. ratti circulating IgG1 and intestinal IgA responses are temporally co-incident with the elimination of S. ratti infections, suggesting a causal link. Antibody-containing plugs in the oesophagus of S. ratti have been observed1 which have been hypothesised to prevent feeding, and thereby, presumably, to reduce survival and reproduction; IgG1 and IgA may therefore be directly involved in this. The intestinal RMCPII response may also be an anti-S. ratti effector response21.
The statistical analyses of these data have identified significant differences between infected and non-infected animals, despite there being only two animals within each group at each time point. With the exception of the RMCPII data, we did not detect significant interactions between Treatment and Time p.i. However, visual inspection of many of these data suggest that these interaction effects may exist for some of the parameters measured (e.g. IgG1, IgG2a), but which may require greater sample size to be detected statistically.
The data presented here suggest that the relevant immunological measures of an S. ratti infection of this nature and duration are serum concentrations of parasite specific IgG1 and IgG2a; RMCPII and parasite specific IgA in intestinal tissue and IL-4 production by MLN cells stimulated with parasitic female antigen. Previously we have shown that there are immune-dependent negative density-dependent effects that act on S. ratti7 and it will therefore be important to investigate how the anti-S. ratti immune response described here is affected by parasite dose.
Acknowledgments
We thank Helena Helmby and Eleanor Riley for advice and support during this work. This work was funded by a grant from the Wellcome Trust.
Abbreviations
- BSA
bovine serum albumin
- ConA
concanavalin A
- HRP
Horseradish peroxidase
- IFN-γ
interferon gamma
- iL3s
infective third stage larvae
- IL-4
interleukin 4
- MLN
mesenteric lymph node(s)
- PBS
phosphate buffered saline
- p.i.
post infection
- RMCPII
rat mast cell protease II
- RT
room temperature
- Th2
T-helper 2
References
- 1.Moqbel R, McLaren DJ. Strongyloides ratti: structural and functional characteristics of normal and immune-damaged worms. Exp Parasitol. 1980;49:139–152. doi: 10.1016/0014-4894(80)90112-5. [DOI] [PubMed] [Google Scholar]
- 2.Kimura E, Shintoku Y, Kadosaka T, Fujiwara M, Kondo S, Itoh M. A second peak of egg excretion in Strongyloides ratti-infected rats: its origin and biological meaning. Parasitology. 1999;119:221–226. doi: 10.1017/s0031182099004631. [DOI] [PubMed] [Google Scholar]
- 3.Wilkes CP, Thompson FJ, Gardner MP, Paterson S, Viney ME. The effect of the host immune response on the parasitic nematode Strongyloides ratti. Parasitology. 2004;128:661–669. doi: 10.1017/s0031182004005062. [DOI] [PubMed] [Google Scholar]
- 4.Moqbel R, McLaren DJ, Wakelin D. Strongyloides ratti: reversibility of immune damage to adult worms. Exp Parasitol. 1980;49:153–166. doi: 10.1016/0014-4894(80)90113-7. [DOI] [PubMed] [Google Scholar]
- 5.Gardner MP, Gems D, Viney ME. Extraordinary plasticity in aging in Strongyloides ratti implies a gene-regulatory mechanism of lifespan evolution. Aging Cell. 2006;5:315–323. doi: 10.1111/j.1474-9726.2006.00226.x. [DOI] [PubMed] [Google Scholar]
- 6.Viney ME, Steer MD, Wilkes CP. The reversibility of constraints on size and fecundity in the parasitic nematode Strongyloides ratti. Parasitology. 2006;133:477–483. doi: 10.1017/S003118200600062X. [DOI] [PubMed] [Google Scholar]
- 7.Paterson S, Viney ME. Host immune responses are necessary for density-dependence in nematode infections. Parasitology. 2002;125:283–292. doi: 10.1017/s0031182002002056. [DOI] [PubMed] [Google Scholar]
- 8.Gemmill AW, Viney ME, Read AF. Host immune status determines sexuality of a parasite nematode. Evolution. 1997;51:393–401. doi: 10.1111/j.1558-5646.1997.tb02426.x. [DOI] [PubMed] [Google Scholar]
- 9.Harvey SC, Gemmill AW, Read AF, Viney ME. The control of morph development in the parasitic nematode Strongyloides ratti. Proc R Soc Lond B. 2000;267:2057–2063. doi: 10.1098/rspb.2000.1249. [DOI] [PMC free article] [PubMed] [Google Scholar]
- 10.Tindall NR, Wilson PA. Criteria for a proof of migration routes of immature parasites inside hosts exemplified by studies of Strongyloides ratti in the rat. Parasitology. 1988;96:551–563. doi: 10.1017/s0031182000080185. [DOI] [PubMed] [Google Scholar]
- 11.Viney ME. A genetic analysis of reproduction in Strongyloides ratti. Parasitology. 1994;109:511–515. doi: 10.1017/s0031182000080768. [DOI] [PubMed] [Google Scholar]
- 12.Bell RG, Adams LS, Gerb J. Strongyloides ratti: Dissociation of the rat's protective immunity into systemic and intestinal components. Exp Parasitol. 1981;52:386–395. doi: 10.1016/0014-4894(81)90097-7. [DOI] [PubMed] [Google Scholar]
- 13.Korenaga M, Nawa Y, Mimori T, Tada I. Strongyloides ratti: the role of enteral antigenic stimuli by adult worms in the generation of protective immunity in rats. Exp Parasitol. 1983;55:358–363. doi: 10.1016/0014-4894(83)90032-2. [DOI] [PubMed] [Google Scholar]
- 14.Korenaga M, Nawa Y, Mimori T, Tada I. Effects of preintestinal larval antigenic stimuli on the generation of intestinal immunity in Strongyloides ratti infection in rats. J Parasitol. 1983;69:78–82. [PubMed] [Google Scholar]
- 15.Murrell KD. Protective role of immunoglobulin G in immunity to Strongyloides ratti. J Parasitol. 1981;67:167–173. [PubMed] [Google Scholar]
- 16.Moqbel R, Wakelin D. Immunity to Strongyloides ratti in rats. 1. Adoptive transfer with mesenteric lymph node cells. Parasite Immunol. 1981;3:181–189. doi: 10.1111/j.1365-3024.1981.tb00397.x. [DOI] [PubMed] [Google Scholar]
- 17.Uchikawa R, Ichiki H, Komaki E. Antibody responses and protective immunity in rats receiving repeated inoculations of Strongyloides ratti. J Parasitol. 1991;77:737–741. [PubMed] [Google Scholar]
- 18.Genta RM, Ottesen EA, Gam AA, Neva FA. Immunologic responses to experimental strongyloidiasis in rats. Z Parasitenkd. 1983;69:667–675. doi: 10.1007/BF00926676. [DOI] [PubMed] [Google Scholar]
- 19.Korenaga M, Nawa Y, Tada I. IgE response in Strongyloides ratti-infected rats with special reference to the life cycle of the parasite. Z Parasitenkd. 1986;72:213–220. doi: 10.1007/BF00931148. [DOI] [PubMed] [Google Scholar]
- 20.Viney ME. Modelling nematode infections? Parasite Immunol. 2006;28:239–241. [Google Scholar]
- 21.Miller HRP. The protective mucosal response against gastrointestinal nematodes in ruminants and laboratory animals. Vet Immunol Immunopathol. 1984;6:167–259. doi: 10.1016/0165-2427(84)90051-5. [DOI] [PubMed] [Google Scholar]
- 22.Abe T, Sugaya H, Ishida K, Khan WI, Tasdemir I, Yoshimura K. Intestinal protection against Strongyloides ratti and mastocytosis induced by administration of interleukin-3 in mice. Immunology. 1993;80:116–121. [PMC free article] [PubMed] [Google Scholar]
- 23.Nawa Y, Kiyota M, Korenaga M, Kotani M. Defective protective capacity of W/Wv mice against Strongyloides ratti infection and its reconstitution with bone marrow cells. Parasite Immunol. 1985;7:429–438. doi: 10.1111/j.1365-3024.1985.tb00088.x. [DOI] [PubMed] [Google Scholar]
- 24.Abe T, Nawa Y. Worm expulsion and mucosal mast cell responses induced by repetitive IL-3 administration in Strongyloides ratti-infected nude mice. Immunology. 1988;63:181–185. [PMC free article] [PubMed] [Google Scholar]
- 25.Finkelman FD, Shea-Donohue T, Goldhill J, et al. Cytokine regulation of host defence against parasitic gastrointestinal nematodes: Lessons from studies with rodent models. Annu Rev Immunol. 1997;15:505–533. doi: 10.1146/annurev.immunol.15.1.505. [DOI] [PubMed] [Google Scholar]
- 26.Artis D, Grencis RK. In: In Parasitic nematodes. Molecular biology, biochemistry and immunology. Kennedy MW, Harnett W, editors. CABI publishing; Oxford: 2001. pp. 331–371. [Google Scholar]
- 27.Viney ME. Developmental switching in the parasitic nematode Strongyloides ratti. Proc R Soc Lond B. 1996;263:201–208. doi: 10.1098/rspb.1996.0032. [DOI] [PubMed] [Google Scholar]
- 28.Bradford MM. A rapid and sensitive method for the quantitation of microgram quantities of protein utilizing the principle of protein-dye binding. Anal Biochem. 1976;72:248–254. doi: 10.1016/0003-2697(76)90527-3. [DOI] [PubMed] [Google Scholar]
- 29.Tobin J. Estimation of relationships for limited dependent variables. Econometrica. 1958;26:24–36. [Google Scholar]
- 30.Han C, Kronmal R. Box-cox transformation of left-censored data with application to the analysis of coronary artery calcification and pharmocokinetic data. Statist Med. 2004;23:3671–3679. doi: 10.1002/sim.1925. [DOI] [PubMed] [Google Scholar]


