

Abstract
The proximal portion of the C-terminus of the CB1 cannabinoid receptor is a primary determinant for G-protein activation. A seventeen residue proximal C-terminal peptide (rodent CB1401–417), the intracellular loop 4 (IL4) peptide, mimicked the receptor’s G-protein activation domain. Because of the importance of the cationic amino acids to G-protein activation, the three-dimensional structure of the IL4 peptide in a negatively charged sodium dodecylsulfate (SDS) micellar environment has been studied by two-dimensional proton nuclear magnetic resonance (2D 1H-NMR) spectroscopy and distance geometry calculations. Unambiguous proton NMR assignments were carried out with the aid of correlation spectroscopy (DQF-COSY and TOCSY) and nuclear Overhauser effect spectroscopy (NOESY and ROESY) experiments. The distance constraints were used in torsion angle dynamics algorithm for NMR applications (DYANA) to generate a family of structures which were refined using restrained energy minimization and dynamics. In water, the IL4 peptide prefers an extended conformation, whereas in SDS micelles, 310-helical conformation is induced. The predominance of 310-helical domain structure in SDS represents a unique difference compared with structure in alternative environments, which can significantly impact global electrostatic surface potential on the cytoplasmic surface of the CB1 receptor and might influence the signal to the G-proteins.
Keywords: cell surface 7-transmembrane receptors, G-protein coupled receptors, two-dimensional proton nuclear magnetic resonance (2D 1H-NMR) spectroscopy, sodium dodecylsulfate (SDS) micelles, signal transduction mechanisms
Cannabinoid receptors are members of the G-protein coupled receptor (GPCR) superfamily. The CB1 cannabinoid receptor subtype is most prominently found in the CNS and appears to mediate the psychoactive properties of cannabinoid agents. The intracellular surface is able to interact with G-proteins of the pertussis toxin-sensitive Gi/o family to inhibit adenylyl cyclase, regulate Ca2+ channels and K+ channels, and to stimulate the mitogen-activated protein kinase pathway (see (Howlett et al., 2002) for overview and original references).
Studies of peptides that comprise the segments of GPCRs have proven to be successful for studying structure and making inferences regarding function (see (Albert and Yeagle 2002) for review). The ability of the intracellular loop regions of the CB1 receptor to interact with G-proteins was studied in vitro using peptides and site-directed antibodies (Howlett et al., 1998; 1999). It was found that peptide fragments from the N-terminal side of the 3rd intracellular loop (IL3) and the C-terminal juxtamembrane intracellular 4th loop region (IL4) autonomously inhibited adenylyl cyclase activity, which suggests that these peptides represent two domains on the receptor that interact with and contribute to the activation of Gi (Howlett et al., 1998). The synthetic peptide fragment of the C-terminal juxtamembrane region (rodent CB1 401–417 or human CB1 400–416), referred to as the IL4 peptide, mimicked the receptor’s response of inhibiting adenylyl cyclase. The cannabinoid receptor antagonist, SR141716, failed to block the response, and the peptide was able to evoke the response in membranes from Chinese hamster ovary (CHO) cells that do not express the CB1 receptor, consistent with a direct activation of Gi by the peptide (Mukhopadhyay et al., 1999).
Circular dichroism (CD) spectropolarimetry in an aqueous environment at neutral pH demonstrated that the IL4 peptide appeared to lack pronounced secondary structure (Mukhopadhyay et al. 1999). When molecular dynamics simulations were performed in aquo i.e. solvated state (Analysis and Decipher modules of the DISCOVER program), low energy conformations were observed that could be grouped into families of similar structure using an rmsd fitting analysis (Cowsik et al., 1997). These simulations suggest that the IL4 peptide can exist in a limited number of low energy conformational forms in the aqueous environment of the assay mixture. However, peptide in low concentrations of sodium dodecylsulfate (SDS) could readily form helical structure (Mukhopadhyay et al. 1999). For a number of GPCRs, a motif of BBXXB or BBXB (where B is a basic amino acid and X is any amino acid) has been proposed to be present on intracellular loops that couple to G-proteins (Lechleiter et al. 1990; Okamoto and Nishimoto 1992). Within the sequence of the CB1 C-terminal domain, there are three Arg and one Lys nonconsecutive residues, posing the possibility for a cationic patch. Charge neutralization of several key residues resulted in a loss of efficacy (Mukhopadhyay et al. 1999), supporting a role for charged residues in the G-protein activation step. If the IL4 peptide were to convert between two or more alternative conformations, the position of the charged residues would be displaced. This process might promote a successful induced-fit activation, or influence G-protein recognition and thereby influence which G-protein subtypes would interact with the receptor. It was hypothesized that a comparable negatively charged region on the G-protein surface could stabilize helical structure of the CB1 IL4 peptide.
With this rationale, we now report the conformations of the CB1 IL4 peptide in water and perdeuterated SDS micelles. Several homonuclear two-dimensional NMR experiments (Wuthrich 1986) have been carried out in order to complete the proton resonance assignments of the IL4 peptide, both in water and SDS. The experiments include TOCSY (Total Correlation Spectroscopy) (Braunschweiler and Ernst 1983; Davis and Bax 1985), DQF-COSY (double quantum filtered correlation Spectroscopy) (Griesinger et al., 1985), ROESY (rotating frame Overhauser enhancement spectroscopy) (Bothner-By and Noggle 1979; Bax and Davis 1985) and NOESY (nuclear Overhauser enhancement and exchange spectroscopy) (Macura et al. 1981; Macura and Ernst 1980; Kumar et al. 1980). Further, the NOESY cross-peak volumes have been used to determine the inter-proton distances in three-dimensional space. An ensemble of model conformations has been generated for the IL4 peptide in SDS using the torsion angle dynamics algorithm for NMR applications, DYANA (Guntert et al. 1997) and coordinates have been deposited in the Protein Data Bank [PDB ID code 2B0Y]. The predominance of 310-helical domain structure in SDS demonstrated herein differs from that reported in a zwitterionic micellar environment (Choi et al., 2005; Xie and Chen 2005). Implications are considered regarding the possible appearance of changes in the global electrostatic surface potential on the cytoplasmic surface of the CB1 receptor.
EXPERIMENTAL PROCEDURES
Peptide Synthesis
The IL4 peptide, R-S-K-D-L-R-H-A-F-R-S-M-F-P-S-S-E, was synthesized by fluromethoxycarbonyl chemistry and purified over a Microsorb C-18 reverse-phase HPLC column by Princeton Biomolecules (Columbus, OH). The structure of the peptide was verified by GC/MS at Princeton Biomolecules. This peptide differs from the sequence in the rat, mouse and human CB1 receptor by the replacement of peptide residue 16, which in the native form in the holoprotein is a cys that is expected to be palmitoylated. In the absence of palmitoylation, we wished to preclude the possibility of sporadic disulfide bond formation leading to dimerization. For this reason, we substituted a ser for this residue, resulting in a peptide that exhibited remarkably efficacy to inhibit adenylyl cyclase (Mukhopadhyay et al. 1999).
NMR Methods
The NMR experiments have been carried out on a 5 mM sample in H2O (9:1 H2O/2H2O, pH 3.0). The experiments in SDS environment were performed with an identical peptide sample to which perdeuterated solution of approximately 300 mM SDS was added. The lipid to peptide ratio of the NMR sample was 60:1, which was well above the critical micelle concentration. All NMR experiments were recorded at 293 K in water on a Bruker DRX-500 spectrometer operating at 500 MHz proton resonance frequency. The 2D spectra in SDS environment were recorded at 310 K. All the data were processed with XWINNMR software. Chemical shifts were calibrated with respect to an internal tetramethylsilane peak.
The complete amino acid spin systems were identified from DQF-COSY and TOCSY spectra. The TOCSY experiment utilized a MLEV-17 sequence, with 80 ms mixing time for the water sample and 110 ms for the SDS sample. Suppression of the solvent signal was achieved by applying the WATERGATE pulse sequence (Sklenar et al., 1993; Fulton and Ni 1997; Fulton et al., 1996) during the relaxation delay (1.5 s). NOESY experiments with mixing times at 100, 200, 300 and 340 ms were employed for the sequential assignment of the IL4 peptide in SDS. Rotating frame NOESY experiments recorded at 150 and 200 ms were utilized for the assignment of the IL4 peptide resonance in water. All the 2D spectra were acquired in the phase-sensitive mode, using the TPPI (time proportional phase incrementation) mode (Ernst et al., 1991). The homonuclear ROESY, NOESY and TOCSY spectra were recorded with 64 scans, a relaxation delay of 1.5s, a spectral width of 5020 Hz in both dimensions, 512 increments in t1 and 2K data points in t2. After zero-filling and Gaussian apodization in both t1 and t2, the final size of the analyzed data matrix was 2K × 2K. Different mixing times were used to evaluate the linear build-up of NOE and the appropriateness of the two-spin approximation.
Structure Determination
For the determination of inter-nuclear distances, the NOESY peak volumes from the 340 ms NOESY spectra were classified as strong, medium and weak, corresponding to upper-bound inter-proton distance restraints of 2.7, 3.5 and 5.0 Å, respectively. Appropriate pseudo-atom corrections were applied to non-stereospecifically assigned methylene and methyl protons. A total of 162 NOE constraints (68-intra, 55 i to i+1, 11 i to i+2 and 28 i to i+3) were originally applied. Dihedral angle (Φ restraints, which were derived from the measured 3JNH values from a 1D spectrum with high resolution, were also used as constraints for the dihedral angle values. A total of 50 structures were initially generated using torsion angle dynamics algorithm for NMR applications DYANA (Guntert et al. 1997) using these distance and dihedral angle constraints. The coordinates referenced herein have been deposited in the Protein Data Bank with PDB ID code 2B0Y.
Computational Method
In order to examine the influence of the solvent media in determining the side chain conformations of the IL4 peptide, energy minimizations and molecular dynamics (MD) simulations were performed for two alternative 310- and α-helical conformations with the consistent valence force field (CVFF) (Dauber-Osguthorpe et al., 1988) implemented in InsightII (Accelrys, Inc., San Diego, CA). The backbone atoms of the IL4 peptide were kept fixed while the side chain atoms moved freely during all the calculations.
For the 310-helical conformation of the IL4 peptide, the initial coordinates from the NMR experiments were subjected to energy minimization. The minimized structure was heated to 1000 K in 50 ps, cooled to 300 K, and then subjected to an MD simulation of 250 ps in vacuo. Structures were extracted from the trajectories at 300 K by sampling every 1 ps. The energy-minimized average structure over the last 100 structures was immersed in a rectangular cell of water molecules to produce a periodic box of dimension 48 × 36 × 32 Å3. The solvent in this initial box was minimized with the peptide fixed, followed by an additional minimization including the peptide. For MD simulations of the constant-volume, constant-temperature ensemble (NVT, canonical ensemble) in aqueous solvent, all bonds and water molecules were constrained by the rattle algorithm (Anderson 1983), the temperature was controlled initially by direct velocity scaling by Nose dynamics (Anderson 1983), non-bonding interactions were calculated with the Ewald particle mesh method (Essman et al., 1995), and the equations of motion were integrated by the Verlet velocity method. After imposing periodic boundary conditions, the system was heated to 300 K in 50 ps and subjected to an additional 133 ps MD simulation. Structures were extracted from the trajectories at 300 K by sampling every 0.5 ps. The average structure over the last 60 structures was minimized.
For the α-helical conformation of the IL4 peptide, the initial coordinates were constructed using Φ =57° and Ψ = 47° and, with the extended side chains, the structure was minimized and subjected to MD simulation for 300 ps at 300 K in vacuo. MD simulations of the α-helical form in aqueous solvent were performed by a procedure similar to that for the 310 form of the IL4 peptide.
It was assumed that the movement around the C416 palmitoylation locus of the IL4 peptide is greatly limited, showing no significant difference between 310- and α-helical forms. Thus, the side chain orientation of the IL4 peptide in 310- and α-helical forms from the above MD simulations was compared by superimposing the α carbons of the C-terminal four residues (i.e., P14, S15, S16, and E17). The electrostatic potential maps for the IL4 peptide were also calculated by solving the Poisson-Boltzman equation using the Delphi program (Honig and Nicholls 1995). Solute dielectric of 2.0 and a solvent dielectric of 80.0 with an ionic strength of 145 mM were set for the Delphi calculation. The distribution of the charged residues was analyzed by comparing the surface potential of the N-terminal positively charged residues.
RESULTS
The CD spectra recorded with the IL4 peptide in phosphate buffer, methanol, trifluoroethanol, SDS or dipalmitoylphosphatidylglycerol (DPPG) indicated that the peptide undergoes a conformational transition between a predominantly random coil state (in phosphate buffer) to a helical state in SDS (Mukhopadhyay et al. 1999). The present NMR study confirmed the presence of helical structure and located the secondary structure elements to the N- and C-termini of the peptide sequence. Assignment of the proton NMR spectra of the IL4 peptide in the presence of membrane-mimetic solvent (SDS) was accomplished using the technique of sequence-specific resonance assignment developed by Wüthrich (Wuthrich 1986). These assignments were carried out using the interactive interpretation of the two-dimensional DQF-COSY, TOCSY, NOESY/ROESY spectra. The NH- α, β, γ connectivity and assignment of each residue in SDS is shown in Figure 1. The sequential NOE connectivities in the NH-NH and fingerprint region of the NOESY spectrum (340 ms) in SDS are shown in Figure 2. The assignment of each residue is shown on the spectrum. The sequence assignment was obtained by following the sequential cross-peak pattern in the fingerprint region of the NOESY spectrum (340 ms). This was facilitated by the numerous cross-peaks between the NH’s in the backbone shown in the amide-amide region (Figure 2). The assignments were further confirmed with the DQF-COSY spectrum in water, as well as in SDS. Complete proton NMR assignments thus obtained are given in Tables 1 and 2 (supplementary material) for the IL4 peptide in water at 293 K and in SDS at 310 K, respectively.
Figure 1.
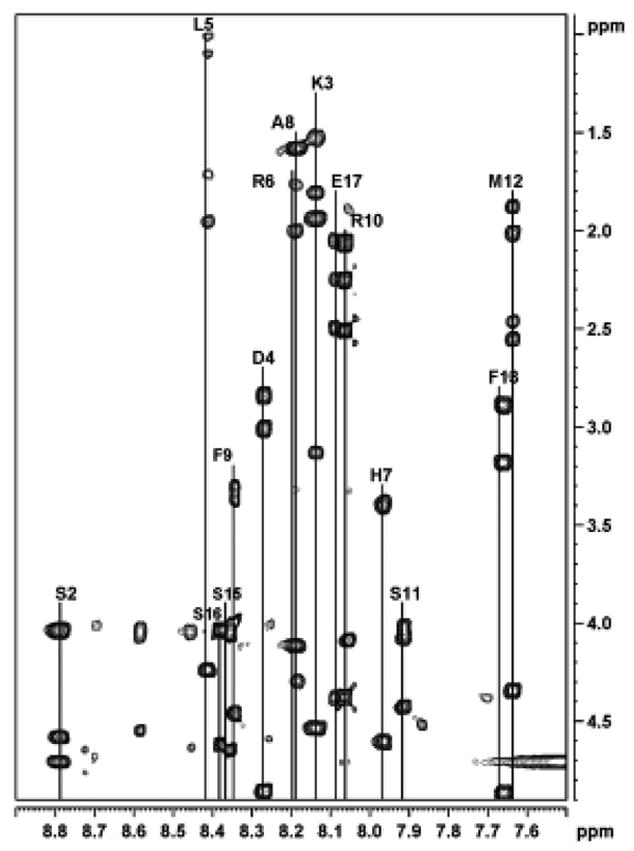
The amide region of the 500 MHz phase-sensitive TOCSY spectrum of the IL4 peptide in SDS micelles. The assignment of each residue is marked on the spectrum.
Figure 2.

The NH-NH (A) and finger print region (B) of the 500 MHz phase-sensitive NOESY spectrum of the IL4 peptide in SDS micelles. Mixing time = 340 ms.
Table 1.
Proton NMR Assignment of the IL4 peptide in Water at 293 K.
| Residue | NH | αH | βH | Others |
|---|---|---|---|---|
| Arg–1 | 4.17 | 1.82, 1.82 | γ CH2 1.71, 1.71
δ CH2 3.25, 3.25 NH 7.35 |
|
| Ser–2 | 8.85 | 4.57 | 3.96, 3.96 | |
| Lys–3 | 8.58 | 4.36 | 1.91, 1.83 | γ CH2 1.46, 1.46
δ CH2 1.75, 1.75 ε CH2 3.08, ε NH3 7.57 |
| Asp–4 | 8.40 | 4.71 | 2.86, 2.72 | |
| Leu–5 | 8.38 | 4.40 | 1.70, 1.70 | γ CH 1.71,
δ CH3 1.02, 0.95 |
| Arg–6 | 8.26 | 4.36 | 1.88, 1.88 | γ CH2 1.79, 1.79
δ CH2 3.24, 3.24 NH 7.17 |
| His–7 | 8.27 | 4.67 | 3.94, 3.86 | |
| Ala–8 | 8.30 | 4.38 | 1.33 | |
| Phe–9 | 8.29 | 4.65 | 3.18, 3.18 | 2,6H 7.27 |
| Arg–10 | 8.27 | 4.28 | 1.82, 1.82 | γ CH2 1.71, 1.71
δ CH2 3.25, 3.25 NH 7.35 |
| Ser–11 | 8.35 | 4.59 | 3.98, 3.98 | |
| Met–12 | 8.34 | 4.44 | 2.52, 2.52 | γ CH2 2.52, 2.43,
ε CH3 1.94 |
| Phe–13 | 8.14 | 4.96 | 3.19, 2.91 | 2,6H 7.30 |
| Pro–14 | 4.49 | 2.40, 2.40 | γCH2 2.04, 2.04
δCH2 3.86, 3.71 |
|
| Ser–15 | 8.56 | 4.49 | 3.97, 3.97 | |
| Ser–16 | 8.42 | 4.58 | 4.03, 3.96 | |
| Glu–17 | 8.15 | 4.34 | 2.19, 1.99 | γCH2 2.45, 2.45 |
Table 2.
Proton NMR Assignment of the IL4 peptide in SDS at 310 K.
| Residue | NH | αH | βH | Others |
|---|---|---|---|---|
| Arg–1 | 4.33 | 2.21, 2.21 | γ CH2 1.89, 1.89
δ CH2 3.42, 3.24 NH 7.34 |
|
| Ser–2 | 8.79 | 4.58 | 4.04, 4.04 | |
| Lys–3 | 8.14 | 4.53 | 1.95, 1.95 | γ CH2 1.54, 1.54
δ CH2 1.81, 1.81 ε CH2 3.14, 3.14 ε NH3 7.34 |
| Asp–4 | 8.27 | 4.86 | 3.01, 2.85 | |
| Leu–5 | 8.41 | 4.24 | 1.97, 1.88 | γ CH 1.73,
δ CH3 1.11, 1.02 |
| Arg–6 | 8.19 | 4.12 | 2.01, 2.01 | γ CH2 1.76, 1.76
δ CH2 3.34, 3.34 NH 7.23 |
| His–7 | 7.97 | 4.60 | 3.41, 3.41 | |
| Ala–8 | 8.18 | 4.29 | 1.58 | |
| Phe–9 | 8.35 | 4.46 | 3.38, 3.31 | 2, 6H 7.35 |
| Arg–10 | 8.06 | 4.09 | 2.07, 2.07 | γ CH2 1.91, 1.91
δ CH2 3.34, 3.34 NH 7.27 |
| Ser–11 | 7.91 | 4.43 | 4.07, 4.01 | |
| Met–12 | 7.64 | 4.34 | 2.02, 2.02 | γ CH2 2.57, 2.48,
ε CH3 1.88 |
| Phe–13 | 7.65 | 4.87 | 3.19, 2.89 | 2, 6H 7.30 |
| Pro–14 | 4.63 | 2.42, 2.42 | γ CH2 2.11, 2.11
δ CH2 3.75, 3.63 |
|
| Ser–15 | 8.35 | 4.65 | 4.05, 4.05 | |
| Ser–16 | 8.38 | 4.62 | 4.04, 4.04 | |
| Glu–17 | 8.06 | 4.38 | 2.27, 2.07 | γ CH2 2.52, 2.52 |
Analysis of Chemical Shift Values
The qualitative secondary structure can be predicted by comparing the chemical shift of the Hα protons with the random coil values for different amino acids in a random coil structure (Wishart et al., 1992). The larger the difference from the random coil value, the more pronounced the secondary structure element should be. A local helical structure is identified by a negative secondary shift (resonance shifted to high field relative to the corresponding random coil values). The chemical shift differences observed in the IL4 peptide indicate a helical region extending from residues L5 to M12. This is not observed in the case of the IL4 peptide in water, which further confirms the absence of any structure for the IL4 peptide in an aqueous media. A semi-quantitative estimation of the helical content of the IL4 peptide in SDS micelles may be obtained from the average up-field shifts of the Hα protons. The average value of the up-field shift of the Hα protons (assumed to be in the helical region) divided by 0.35 (0.35 ppm is assumed to correspond to 100% α-helix) yields the % α-helix (Rizo et al., 1993). In this way the percentage of helical content estimated semi-quantitatively from residues L5 through M12 was 43%.
Analysis of NOE connectivities
A group of specific sequential and medium range NOEs can be used to determine the existence of the secondary structural features (Wuthrich et al., 1984; Wuthrich 1986) of the IL4 peptide in the presence of SDS micelles (Figure 3). The presence of strong, continuous sequential HiN–Hi+1N NOEs (Figures 2 and 3) together with weaker Hiα - Hi+1N NOEs and a number of appropriate medium-range Hiα–Hi+2N, Hiα–Hi+3N and Hiα–Hi+3β are diagnostic of the presence of helical structure. The presence of weak Hiα–Hi+2N NOEs in addition to the standard Hiα–Hi+3N NOEs indicates the presence of a 310-helical structure, rather than the α-helical structure. Further support for the presence of a helical conformation is found in the relative intensity ratios for intra- and inter-residue Hα-HN cross-peaks. Extended conformations generally yield strong inter-residue cross peaks and weak intra-residue cross-peaks, whereas the intra-residue cross peaks are enhanced for helical conformations. Similarly, variations in relative intensities of dNN and dαN sequential NOEs support the presence of helical conformation for the IL4 peptide (L5 to F13) as dNN NOEs are stronger than dαN NOEs (Wuthrich et al. 1984; Wuthrich 1986). On the other hand, the ROESY spectrum of the IL4 peptide in water shows only intra-residue and αHi to NHi+1 ROEs, confirming the extended conformation of the IL4 peptide in water. All these NOEs indicate that the IL4 peptide is substantially folded from residues K3 to F13 in the SDS environment.
Figure 3.

A. The NOEs that are important to characterize the secondary structure of the IL4 peptide in the presence of SDS micelles. Filled triangles refer to a coupling constant of 4 to 5 Hz and filled circles to 7 Hz and above. B. Analysis of the α-H proton chemical shifts for the IL4 peptide in the presence of SDS micelles.
It is also possible to acquire information about the torsion angles (Φ) along the peptide chain by measuring 3JαN coupling constants (Smith et al., 1996). Helical structures result in coupling constants of 4 to 5 Hz, whereas extended structures have coupling constants in the range of 8 to 9 Hz (Wuthrich 1986; Pardi et al., 1984). Wüthrich has suggested that a series of three or more 3JαN coupling constants less than 6 Hz is diagnostic of helical structure. Figure 3 shows the coupling constants of the IL4 peptide in SDS micelles. Missing values are due to overlap of amide peaks. The coupling constants for the IL4 peptide were in the range of 4 to 6 Hz for L5 to S11, and were greater than 6 Hz for the other residues in the N- and C-termini of the IL4 peptide. Thus, in the mid-region of the IL4 peptide, helical conformation is favored (L5 to S11), and in the ends, extended conformation is preferred. The apparent 3JαN coupling constant is a weighted average of the populations and depends on the distribution of angles over the population (Kessler et al., 1988). Estimation of the fraction of molecules possessing folded conformation was obtained for the IL4 peptide from coupling constant data using the procedure of Bradley (Bradley et al., 1990). It is calculated that the residues L5 to S11 have a time average helical population of 89%.
From the above NMR results, it is concluded that the sequence between K3 and F13 clearly meets the criteria for the existence of folded/helical structure. However, the entire peptide is not helical. The absence of medium range cross peaks and large 3JαN coupling constants indicates that the ends prefer an extended conformation.
Generation of Three-Dimensional Structure
Given the indication of a helical structure along the central core of the IL4 peptide in SDS, it was of interest to use the observed NOEs to obtain the three-dimensional structure of the peptide. This was done using the torsion angle dynamics algorithm for NMR applications, DYANA (Guntert et al. 1997), by giving 162 distance constraints and 13 dihedral angle constraints. Initially, 50 structures were generated by DYANA using the simulated annealing protocol, which improves the convergence of the structure calculations by introducing redundant dihedral angle constraints. Ten conformations with the lowest target function value (i.e., least violations of experimental restraints and van der Waals distances) were chosen for further refinement, using restrained energy minimization. The resulting ten structures are shown in Figure 4, after superimposing the backbone heavy atoms. The backbone RMSD after superimposing the heavy atoms is 1.14 Å. The statistical analysis of structure calculations is given in Table 3. In a stable secondary structure, both ϕ and ψ dihedral angles should have well-defined values. The Ramachandran plots of all 50 structures (data given in supplementary material) indicate that the backbone dihedral angles consistently lie in the α-region and are solely within the allowed ranges. A helical type backbone arrangement is indicated for the central core of the IL4 peptide, in particular the stretch from L5 to F13, with some dynamic fraying of the helix termini. Measurement of C=Oi to NHi+3 versus C=Oi to NHi+4 distance along the stretch indicated the preference of the IL4 peptide for 310-helix over a regular α-helix. Two views of the IL4 peptide are shown in Figure 5. A detailed examination of the IL4 peptide sequence showed that the extent of the 310-helical structural motif is associated with the positively charged amino acid residues, K3, R6, H7, and R10. According to the x-ray structure of rhodopsin, the amino acid residues of the 8th helix (i.e., K311, R314, N315, and V318) equivalent to these charged residues are oriented toward the intracellular side where the G-proteins interact with the receptor. In the intact receptor, the positioning of the positively charged residues of the IL4 peptide could form a cationic cluster important in transferring the signal by interacting with negatively charged residues of the coupled G-proteins. It could be hypothesized that the positively charged side chains of these residues are involved in electrostatic interactions with the polar solvents for the formation of the 310-helical conformation.
Figure 4.

Stereo-view showing the superimposition of the IL4 peptide for ten structures generated by DYANA. The backbone RMSD after superimposing the heavy atoms is 1.14 Å. The side chain of positively charged residues are colored blue, negatively charged residues are colored red, and hydrophobic residues are colored yellow.
Table 3.
Structural Statistics for the Ensemble of 10 IL4 peptide Structures in SDS Micelles Calculated with DYANA
| No. of constraints | 183 |
| DYANA target function | 0.071 ± 0.09 Å2 |
| max distance violation | 0.12 ± 0.03 Å |
| Global backbone atom rmsd (Å) | 0.55 ± 0.20Å |
| Global heavy atom RMSD | 1.14 ± 0.34 Å |
| Ramachandran plot regions (%) | |
| most favored | 100.0 |
| allowed region | 0 |
| generously allowed | 0 |
| disallowed | 0 |
Figure 5.

A graphic representation of the IL4 peptide conformation viewed from two different angles. The peptide backbone is shown as a ribbon tube (cyan). Positively charged residues are blue, negatively charged residues are red, polar residues are purple and the hydrophobic residues are yellow. The helical segment in the central core and the turn in the N-terminus are clearly visible in both views.
It was shown from the present MD simulations that the positively charged residues of the N-terminal region of the 310- and α-helical forms of the IL4 peptide formed sterically and electrostatically distinct clusters (Figure 6). The α-helical conformation formed a compact cluster with the positively charged side chains of K3, R6, H7, and R10 in the N-terminus being closely packed (Figure 6A). In contrast, the 310-helical conformation formed a loose cluster of these positively charged residues, thereby creating a large surface area. Figure 6B shows that the inter-conversion of these distinctive helical structures of the IL4 could reorient the positively charged side chains, thereby altering the global electrostatic potential in a manner that could potentially transmit a different signal to the G-proteins or serve to turn on/off the signal.
Figure 6.

A. The electrostatic potential maps of the putative IL4 domain of the human CB1 receptor in its α-helical and 310-helical forms, calculated by the Delphi program. The Connolly surface of the IL4 is rendered in blue and red to illustrate electrostatically positive and negative regions, respectively, in the spectrum ranging from +5 to −5. B. Isopotential map of the IL4 peptide at the level of +2.0 kBT/e and −2.0 kBT/e. For the α-helical conformation, the electrostatically positive and negative potential contours are displayed in cyan and magenta lines. For the 310-helical conformation, the electrostatically positive and negative potential contours are displayed respectively as blue and red polyhedra.
DISCUSSION
Investigation of the IL4 domain of rhodopsin (Krishna et al., 2002), avian β-adrenoreceptor (Jung et al., 1996), human β2-adrenoreceptor (Katragadda et al., 2004) and the angiotensin II AT1A receptor (Franzoni et al., 1997) have demonstrated environment-dependent helical conformations. The IL4 region (residues 311 to 321) of rhodopsin’s crystal structure is helical, and represents the state of the receptor that is considered to be inactive (Krishna et al. 2002; Palczewski et al. 2000). In contrast, solution structures solved by NMR suggest that this region of rhodopsin is a loop having little intrinsic tendency to form a helix in the absence of an interface such as that provided by a lipid micelle or a hydrophobic core mimic such as trifluoroethanol (Krishna et al. 2002; Albert and Yeagle 2002). For the CB1 receptor IL4 domain and several peptide analogs, a negatively charged hydrophobic environment (SDS or DPPG) promoted helix formation (Mukhopadhyay et al. 1999). In our NMR studies, the CB1 IL4 peptide in SDS was found to exist as a 310-helix but with some probable population of α-helix. We propose that SDS may serve as a surrogate for the negative charge patches located on the interacting surface of G-proteins which function in concert with positively charged residues of the receptor in the G-protein activation-deactivation cycle.
Recent NMR studies reported helix extending from S402 to F413 for a similar CB1 peptide in dodecylphosphocholine (DPC) micelles, a zwitterionic membrane-mimetic environment (Choi et al. 2005; Xie and Chen 2005). Xie and Chen (Xie and Chen 2005) observed a pattern of dαN(i, i+4) NOEs between K403 and M412, suggesting a predominance of α-helical character which might have been stabilized by the DPC environment. In comparison, our data indicate that the helix in IL4 in SDS begins at L405 and extends to F413 predominantly in a 310-helix. The homologous region of rhodopsin’s crystal structure exhibits considerable 310 character between C316 and L321 as judged by the ideal ϕ and ψ angles of the 310 form (Shim, observations from Palczewski (Palczewski et al. 2000) data). Studies of other peptides in both SDS and DPC micelles have indicated that the micelle environment can make a significant difference in the peptide structure (Gao and Wong 2001a; Gao and Wong 2001b; Neidigh and Andersen 2002; Veeraraghavan et al., 1998).
Franzoni and colleagues (Franzoni et al. 1997) proposed that a helix to random coil transition in the IL4 domain of the AT1A receptor could be the most likely mechanism for the receptor interaction with G-protein. Sakmar and his coworkers proposed the IL4 region as a membrane-dependent conformational switch domain (Krishna et al. 2002). An α-helix to 310-helix transition would be a more conservative change than the total unfolding to a random coil. The helix to random coil transition may progress via the 310-helix as a thermodynamic intermediate structure (Millhauser 1995; Topol et al., 2001). Environmental factors of hydrophobicity, polarity and ionic charge could influence the conversion and stability of the α-helix versus 310-helix conformations (Long and Tycko 1998). These environmental changes might be provided by the interaction of the receptor with the G-protein.
We propose that a shift from α-helix to 310-helix in the IL4 domain of the CB1 receptor could occur by a sequential remodeling of the hydrogen bonding interactions beginning from a nucleation site at the N-terminal side of the IL4. Initiation of the transition at the nucleation site may have its origin by TM7 rigid body motion. In our analysis of the CB1 IL4 loop, we observed that the distance between the Cα carbons of R401 and E417 was 24.7 Ǻ for the α-helix, lengthening by 2.6 Ǻ to 27.3 Ǻ for the 310-helix. This 2.6 Ǻ increment would be consistent with the changes that occur during activation of rhodopsin, observed as 1) a 2 to 4 Ǻ increase in distance between the reference point at TM1 and the position at which TM7 emerges from the membrane, and 2) a 3 Ǻ increase in distance between positions N310 and C316 within the IL4 (Altenbach et al. 2001a,b). Thus, a small lateral movement of the cytoplasmic end of TM7 helix might be sufficient to stretch the IL4 helix and promote the initiation of transition to the longer 310 form, or stabilize the longer conformation.
The IL4 domain is restricted in its movement due to the covalently attached palmitoyl thioester of C415 on the CB1 receptor and C322–C323 on rhodopsin, which anchors the C-terminal side of the IL4 juxtamembrane domain into the phospholipid membrane. Thus, changes in the conformation might be expected to be initiated at the N-terminal side of the IL4 domain. According to CD studies, the development of helical character in the rhodopsin IL4 peptide requires the N-terminal side sequence N310-K311-Q312, proposed to be the helix nucleating site (Krishna et al. 2002; Natochin et al., 2003). The analogous CB1 receptor sequence (S402-K403-D404) possesses a charged lys in common with the rhodopsin sequence, which we propose to be the nucleation site as evidenced by the critical requirement for K403 in the regulation of G-protein-mediated activity (Mukhopadhyay et al. 1999).
Coordinated change in the receptor-G-protein interface is intrinsic to the activation-deactivation cycle of receptor-G-protein ternary complexes. For a number of GPCRs, a motif of BBXXB or BBXB has been proposed to be present on the N-terminal domains of intracellular loops that couple to G-proteins (Lechleiter et al. 1990; Okamoto and Nishimoto 1992; Wade et al., 1999). As shown in Figures 6 and 7, the positively charged residues, K3, R6, H7, and R10 of the N-terminal region of the 310- and α-forms of the IL4 peptide formed sterically and electrostatically distinct clusters. The α-helix formed a compact cluster of positively charged side chains being located in close proximity, whereas the 310-helix formed a loose cluster of these positively charged residues, thereby creating a large surface area. The positively charged residues K3 and R6 in the CB1 IL4 peptide are shifted, altering the net global charge at the protein surface that would be most likely to modulate the binding and selectivity for the G-protein subtype, or alter the activation process that allows nucleotide release from the Gα subunit.
In summary, a peptide comprising the amino acids of the CB1 cannabinoid receptor IL4 domain was found to achieve 310-helical structure over a segment between L405 and F413 in SDS micelles. This contrasts with the α-helical conformation observed in DPC micelles (Choi et al. 2005; Xie and Chen 2005). Because the charged residues of the CB1 IL4 domain play a key role in G-protein activation (Mukhopadhyay et al., 1999), we postulate that a conversion from α- to 310-helical conformation of the IL4 could influence the signal to the G-proteins by placing the positively charged side chains in distinctly different orientations.
Supplementary Material
Acknowledgments
Supported by NIDA grants R01-DA03690, R01-DA06312, K05-DA00182, and U24-DA12385. The staff members of the National 500 MHz facility at the Sophisticated Instruments Facility, Indian Institute of Science, Bangalore, India, are gratefully acknowledged. Special help from Ms. Anjali Dike is greatly appreciated.
Footnotes
Publisher's Disclaimer: This is a PDF file of an unedited manuscript that has been accepted for publication. As a service to our customers we are providing this early version of the manuscript. The manuscript will undergo copyediting, typesetting, and review of the resulting proof before it is published in its final citable form. Please note that during the production process errors may be discovered which could affect the content, and all legal disclaimers that apply to the journal pertain.
References
- Albert AD, Yeagle PL. Structural studies on rhodopsin. Biochim Biophys Acta. 2002;1565:183–195. doi: 10.1016/s0005-2736(02)00568-0. [DOI] [PubMed] [Google Scholar]
- Altenbach C, Cai K, Klein-Seetharaman J, Khorana HG, Hubbell WL. Structure and function in rhodopsin: mapping light-dependent changes in distance between residue 65 in helix TM1 and residues in the sequence 306–319 at the cytoplasmic end of helix TM7 and in helix H8. Biochemistry. 2001a;40:15483–15492. doi: 10.1021/bi011546g. [DOI] [PubMed] [Google Scholar]
- Altenbach C, Klein-Seetharaman J, Cai K, Khorana HG, Hubbell WL. Structure and function in rhodopsin: mapping light-dependent changes in distance between residue 316 in helix 8 and residues in the sequence 60–75, covering the cytoplasmic end of helices TM1 and TM2 and their connection loop CL1. Biochemistry. 2001b;40:15493–15500. doi: 10.1021/bi011545o. [DOI] [PubMed] [Google Scholar]
- Anderson H. Rattle: a velocity version of the shake algorithm for molecular dynamics calculations. J Comp Phys. 1983;52:24–34. [Google Scholar]
- Bax A, Davis D. MLEV-17 based two-dimensional homonuclear magnetization transfer spectroscopy. J Magn Reson. 1985;65:355–360. [Google Scholar]
- Bothner-By AA, Noggle JH. Time development of Nuclear Overhauser Effects in multispin systems. J Am Chem Soc. 1979;101:5152–5155. [Google Scholar]
- Bradley EK, Thomason JF, Cohen FE, Kosen PA, Kuntz ID. Studies of synthetic helical peptides using circular dichroism and nuclear magnetic resonance. J Mol Biol. 1990;215:607–622. doi: 10.1016/S0022-2836(05)80172-X. [DOI] [PubMed] [Google Scholar]
- Braunschweiler L, Ernst RR. Coherence transfer by isotropic mixing: Application to proton correlation spectroscopy. J Magn Reson. 1983;53:521–528. [Google Scholar]
- Choi G, Guo J, Makriyannis A. The conformation of the cytoplasmic helix 8 of the CB1 cannabinoid receptor using NMR and circular dichroism. Biochim Biophys Acta. 2005;1668:1–9. doi: 10.1016/j.bbamem.2004.10.011. [DOI] [PubMed] [Google Scholar]
- Cowsik SM, Welsh WJ, Mukhopadhyay S, Howlett AC. Molecular dynamics simulation of a CB1 cannabinoid receptor peptide. Amer Chem Soc Abstr 1997 [Google Scholar]
- Dauber-Osguthorpe P, Roberts VA, Osguthorpe DJ, Wolff J, Hagler AT. Proteins: Structure, Function and Genetics. 1988;(4):31–47. doi: 10.1002/prot.340040106. [DOI] [PubMed] [Google Scholar]
- Davis DG, Bax A. Separation of chemical exchange and cross-relaxation effects in two-dimensional NMR spectroscopy. J Magn Reson. 1985;64:533–535. [Google Scholar]
- Ernst RR, Bodenhausen G, Wokaun A. Principles of Nuclear Magnetic Resonance in One and Two Dimensions. Oxford Science; London: 1991. [Google Scholar]
- Essman U, Perera L, Berkowitz ML, Darden TA, Lee H, Pedersen LG. A smooth particle mesh Ewald method. J Chem Phys. 1995;103:8577–8593. [Google Scholar]
- Franzoni L, Nicastro G, Pertinhez TA, Tato M, Nakaie CR, Paiva AC, Schreier S, Spisni A. Structure of the C-terminal fragment 300–320 of the rat angiotensin II AT1A receptor and its relevance with respect to G-protein coupling. J Biol Chem. 1997;272:9734–9741. doi: 10.1074/jbc.272.15.9734. [DOI] [PubMed] [Google Scholar]
- Fulton DB, Hrabal R, Ni F. Gradient-enhanced TOCSY experiments with improved sensitivity and solvent suppression. J Biomol NMR. 1996;8:213–218. doi: 10.1007/BF00211167. [DOI] [PubMed] [Google Scholar]
- Fulton DB, Ni F. ROESY with Water Flip Back for High-Field NMR of Biomolecules. J Magn Reson. 1997;129:93–97. doi: 10.1006/jmre.1997.1249. [DOI] [PubMed] [Google Scholar]
- Gao X, Wong TC. Molecular dynamics simulation of adrenocorticotropin (1–10) peptide in a solvated dodecylphosphocholine micelle. Biopolymers. 2001a;58:643–659. doi: 10.1002/1097-0282(200106)58:7<643::AID-BIP1037>3.0.CO;2-R. [DOI] [PubMed] [Google Scholar]
- Gao X, Wong TC. NMR studies of adrenocorticotropin hormone peptides in sodium dodecylsulfate and dodecylphosphocholine micelles: proline isomerism and interactions of the peptides with micelles. Biopolymers. 2001b;58:20–32. doi: 10.1002/1097-0282(200101)58:1<20::AID-BIP30>3.0.CO;2-3. [DOI] [PubMed] [Google Scholar]
- Griesinger C, Sorensen OW, Ernst RR. Two-Dimensional Correlation of Connected NMR Transitions. J Am Chem Soc. 1985;107:6394–6396. [Google Scholar]
- Guntert P, Mumenthaler C, Wuthrich K. Torsion angle dynamics for NMR structure calculation with the new program DYANA. J Mol Biol. 1997;273:283–298. doi: 10.1006/jmbi.1997.1284. [DOI] [PubMed] [Google Scholar]
- Honig B, Nicholls A. Classical electrostatics in biology and chemistry. Science. 1995;268:1144–1149. doi: 10.1126/science.7761829. [DOI] [PubMed] [Google Scholar]
- Howlett AC, Barth F, Bonner TI, Cabral G, Casellas P, Devane WA, Felder CC, Herkenham M, Mackie K, Martin BR, Mechoulam R, Pertwee RG. International Union of Pharmacology. XXVII. Classification of Cannabinoid Receptors. Pharmacol Rev. 2002;54:161–202. doi: 10.1124/pr.54.2.161. [DOI] [PubMed] [Google Scholar]
- Howlett AC, Mukhopadhyay S, Shim JY, Welsh WJ. Signal transduction of eicosanoid CB1 receptor ligands. Life Sci. 1999;65:617–625. doi: 10.1016/s0024-3205(99)00284-2. [DOI] [PubMed] [Google Scholar]
- Howlett AC, Song C, Berglund BA, Wilken GH, Pigg JJ. Characterization of CB1 cannabinoid receptors using receptor peptide fragments and site-directed antibodies. Mol Pharmacol. 1998;53:504–510. doi: 10.1124/mol.53.3.504. [DOI] [PubMed] [Google Scholar]
- Jung H, Windhaber R, Palm D, Schnackerz KD. Conformation of a beta-adrenoceptor-derived signal transducing peptide as inferred by circular dichroism and 1H NMR spectroscopy. Biochemistry. 1996;35:6399–6405. doi: 10.1021/bi952575s. [DOI] [PubMed] [Google Scholar]
- Katragadda M, Maciejewski MW, Yeagle PL. Structural studies of the putative helix 8 in the human beta(2) adrenergic receptor: an NMR study. Biochim Biophys Acta. 2004;1663:74–81. doi: 10.1016/j.bbamem.2004.01.012. [DOI] [PubMed] [Google Scholar]
- Kessler H, Griesinger C, Lautz J, Muller A, Van Gunsteren WF, Berendsen HJC. Confomational dynamics detected by nuclear magnetic resonance NOE values and J coupling constants. J Am Chem Soc. 1988;110:3393–3396. [Google Scholar]
- Krishna AG, Menon ST, Terry TJ, Sakmar TP. Evidence that helix 8 of rhodopsin acts as a membrane-dependent conformational switch. Biochemistry. 2002;41:8298–8309. doi: 10.1021/bi025534m. [DOI] [PubMed] [Google Scholar]
- Kumar A, Ernst RR, Wuthrich K. A two-dimensional nuclear Overhauser enhancement (2D NOE) experiment for the elucidation of complete proton-proton cross-relaxation networks in biological macromolecules. Biochem Biophys Res Commun. 1980;95:1–6. doi: 10.1016/0006-291x(80)90695-6. [DOI] [PubMed] [Google Scholar]
- Lechleiter J, Hellmiss R, Duerson K, Ennulat D, David N, Clapham D, Peralta E. Distinct sequence elements control the specificity of G protein activation by muscarinic acetylcholine receptor subtypes. EMBO J. 1990;9:4381–4390. doi: 10.1002/j.1460-2075.1990.tb07888.x. [DOI] [PMC free article] [PubMed] [Google Scholar]
- Long HW, Tycko R. Biopolymer conformational distributions from solid-state NMR: α-helix and 310-helix contents of a helical peptide. J Am Chem Soc. 1998;120:7039–7048. [Google Scholar]
- Macura S, Ernst R. Elucidation of cross-relaxation in liquids by two-dimensional NMR spectroscopy. Mol Phys. 1980;41:95–117. [Google Scholar]
- Macura S, Huang Y, Suter D, Ernst RR. Two-dimensional chemical exchange and cross-relaxation spectroscopy of coupled nuclerar spins. J Magn Reson. 1981;43:259–281. [Google Scholar]
- Millhauser GL. Views of helical peptides: a proposal for the position of 3(10)-helix along the thermodynamic folding pathway. Biochemistry. 1995;34:3873–3877. doi: 10.1021/bi00012a001. [DOI] [PubMed] [Google Scholar]
- Mukhopadhyay S, Cowsik SM, Lynn AM, Welsh WJ, Howlett AC. Regulation of Gi by the CB1 cannabinoid receptor C-terminal juxtamembrane region: structural requirements determined by peptide analysis. Biochemistry. 1999;38:3447–3455. doi: 10.1021/bi981767v. [DOI] [PubMed] [Google Scholar]
- Natochin M, Gasimov KG, Moussaif M, Artemyev NO. Rhodopsin determinants for transducin activation: a gain-of-function approach. J Biol Chem. 2003;278:37574–37581. doi: 10.1074/jbc.M305136200. [DOI] [PubMed] [Google Scholar]
- Neidigh JW, Andersen NH. Peptide conformational changes induced by tryptophan-phosphocholine interactions in a micelle. Biopolymers. 2002;65:354–361. doi: 10.1002/bip.10272. [DOI] [PubMed] [Google Scholar]
- Okamoto T, Nishimoto I. Detection of G protein-activator regions in M4 subtype muscarinic, cholinergic, and alpha 2-adrenergic receptors based upon characteristics in primary structure. J Biol Chem. 1992;267:8342–8346. [PubMed] [Google Scholar]
- Palczewski K, Kumasaka T, Hori T, Behnke CA, Motoshima H, Fox BA, Le TI, Teller DC, Okada T, Stenkamp RE, Yamamoto M, Miyano M. Crystal structure of rhodopsin: A G protein-coupled receptor. Science. 2000;289:739–745. doi: 10.1126/science.289.5480.739. [DOI] [PubMed] [Google Scholar]
- Pardi A, Billeter M, Wuthrich K. Calibration of the angular dependence of the amide proton-C alpha proton coupling constants, 3JHN alpha, in a globular protein. Use of 3JHN alpha for identification of helical secondary structure. J Mol Biol. 1984;180:741–751. doi: 10.1016/0022-2836(84)90035-4. [DOI] [PubMed] [Google Scholar]
- Rizo J, Blanco FJ, Kobe B, Bruch MD, Gierasch LM. Conformational behavior of Escherichia coli OmpA signal peptides in membrane mimetic environments. Biochemistry. 1993;32:4881–4894. doi: 10.1021/bi00069a025. [DOI] [PubMed] [Google Scholar]
- Sklenar V, Piotto M, Leppik R, Saudek V. Gradient-Tailored Water Suppression for 1H-15N HSQC Experiments Optimized to Retain Full Sensitivity. J Magn Reson. 1993;102:241. [Google Scholar]
- Smith LJ, Bolin KA, Schwalbe H, MacArthur MW, Thornton JM, Dobson CM. Analysis of main chain torsion angles in proteins: prediction of NMR coupling constants for native and random coil conformations. J Mol Biol. 1996;255:494–506. doi: 10.1006/jmbi.1996.0041. [DOI] [PubMed] [Google Scholar]
- Topol IA, Burt SK, Deretey E, Tang TH, Perczel A, Rashin A, Csizmadia IG. alpha- and 3(10)-helix interconversion: a quantum-chemical study on polyalanine systems in the gas phase and in aqueous solvent. J Am Chem Soc. 2001;123:6054–6060. doi: 10.1021/ja0038934. [DOI] [PubMed] [Google Scholar]
- Veeraraghavan S, Baleja JD, Gilbert GE. Structure and topography of the membrane-binding C2 domain of factor VIII in the presence of dodecylphosphocholine micelles. Biochem J. 1998;332(Pt 2):549–555. doi: 10.1042/bj3320549. [DOI] [PMC free article] [PubMed] [Google Scholar]
- Wade SM, Lim WK, Lan KL, Chung DA, Nanamori M, Neubig RR. G(i) activator region of alpha(2A)-adrenergic receptors: distinct basic residues mediate G(i) versus G(s) activation. Mol Pharmacol. 1999;56:1005–1013. doi: 10.1124/mol.56.5.1005. [DOI] [PubMed] [Google Scholar]
- Wishart DS, Sykes BD, Richards FM. The chemical shift index: a fast and simple method for the assignment of protein secondary structure through NMR spectroscopy. Biochemistry. 1992;31:1647–1651. doi: 10.1021/bi00121a010. [DOI] [PubMed] [Google Scholar]
- Wuthrich K. NMR of Proteins and Nucleic Acids. J. Wiley & Sons; New York: 1986. [Google Scholar]
- Wuthrich K, Billeter M, Braun W. Polypeptide secondary structure determination by nuclear magnetic resonance observation of short proton-proton distances. J Mol Biol. 1984;180:715–740. doi: 10.1016/0022-2836(84)90034-2. [DOI] [PubMed] [Google Scholar]
- Xie XQ, Chen JZ. NMR structural comparison of the cytoplasmic juxtamembrane domains of G-protein-coupled CB1 and CB2 receptors in membrane mimetic dodecylphosphocholine micelles. J Biol Chem. 2005;280:3605–3612. doi: 10.1074/jbc.M410294200. [DOI] [PubMed] [Google Scholar]
Associated Data
This section collects any data citations, data availability statements, or supplementary materials included in this article.