

Abstract
High-density short oligonucleotide microarrays are a primary research tool for assessing global gene expression. Background noise on microarrays comprises a significant portion of the measured raw data. A number of statistical techniques have been developed to correct for this background noise. Here, we demonstrate that probe minimum folding energy and structure can be used to enhance a previously existing model for background noise correction. We estimate that probe secondary structure accounts for up to 3% of all variation on Affymetrix microarrays.
Keywords: DNA Microarray, Probe secondary structure, Background correction
1. Introduction
Microarray technology holds the promise of capturing global gene expression by providing global molecular snapshots of the cell’s transcriptional machinery products (Lockhart et al., 1996). The ultimate goal of gene expression microarrays is to measure the abundance of each known transcript in the sample under investigation. The abundance is inferred from the signal generated by each probe as a result of a hybridization reaction with a labeled target (transcript). However, this signal includes background noise that not only measures the target abundance, but also non-specific binding and autofluorescence of the chip surface.
In the Affymetrix GeneChip system, each transcript’s abundance is measured by a set of 11-20 probe pairs. Each pair is composed of a perfect match probe (PM), which exactly complements a region on the transcript, and a mismatch probe (MM), which is identical to the PM probe except at the 13 th base, where the reverse compliment nucleotide is introduced. MM probes were originally introduced by Affymetrix to measure background noise. However, it has been shown by many groups that MM contain significant amount of PM signal and are therefore unreliable as estimators of background noise (Chudin et al., 2001; Forman et al., 1998; Irizarry et al., 2003; Naef et al., 2003). A true estimate of background noise would improve the quality of Affymetrix GeneChip data.
Inconsistency of the signal generated from each probe is a common phenomenon in GeneChip microarray experiments (Li and Wong, 2001; Nielsen et al., 2005). The differences in the signal produced can be attributed to many sources: optical noise, cross-hybridization, dye-related contributions and probe sequence composition. Many algorithms have been developed to attempt to correct for these inconsistencies (Irizarry et al., 2006; Wu and Irizarry, 2005; Zhang et al., 2003). In particular, it has been found that probe sequence composition can significantly affect the intensity of the signal generated from that probe, independent of the concentration of its target. A number of groups have suggested models where the background intensity of probes could be estimated based on their sequence composition (Naef and Magnasco, 2003; Zhang et al., 2003).
The process of nucleic acid hybridization in solution has been well studied and models such as the nearest-neighbor model provide a robust description of hybridization thermodynamics (SantaLucia and Hicks, 2004). Probe-target hybridization on the microarray surface, however, does not follow the solution analogue, and the nearest-neighbor parameters that describe solution hybridization appear to be different than those for microarrays (Zhang et al., 2003). On-chip DNA hybridization is likely to be complicated by the geometric constraints of having one strand (i.e. probe) attached to the surface of the chip (Shchepinov et al., 1997). In addition, many other factors like probe and target secondary structure, effective reaction volume, electrostatics, diffusion and surface effects, reaction thermodynamics and kinetics, competitive binding effects, hybridization buffer composition and probe-probe interactions are believed to affect microarray DNA hybridization (Lima et al., 1992; Southern et al., 1999).
In this study, we examine the effect of predicted probe secondary structure on background hybridization in Affymetrix microarrays. Although microarray probes are attached to the surface of the chip, they are dynamic molecules that, depending on their sequence composition, can fold onto themselves into stable secondary structure. Such stable secondary structure has the potential to interfere with probe-target hybridization (Lima et al., 1992). Consequently, the signal obtained from such probes may not reflect the actual transcript concentrations. It has been shown, for example, that a stable secondary structure motif in a 20-mer probe dramatically decreases the final signal obtained to a point where the probe is considered insensitive to its intended target (Anthony et al., 2003).
Microarray probes are usually screened for the presence of stable secondary structure either by a simple base complementarity check or using more sophisticated and time consuming energy minimization algorithms (Markham and Zuker, 2005). The base complementarity check is more routinely used for its simplicity and speed. Discrepancies between methods do exist, and there are no guidelines that determine which method is preferable (Koehler and Peyret, 2005). It is therefore likely that, despite these screening procedures, a significant amount of secondary structure is present in probes in microarray experiments.
Here we propose that the background noise of each probe can be modeled as a function of its sequence composition and its minimum folding energy and secondary structure. By incorporating probe secondary structure information into a previously described model of background concentration (Naef and Magnasco, 2003), we improved the fit of that model to microarray data by 1-3% with minimal addition of significant free parameters.
2. Methods
2.1. Data sets
Seven data sets were used in this study (Table 1): the human genome U133 Latin Square data set (http://www.affymetrix.com/support/technical/sample_data/datasets.affx), theChoe control data set (Choe et al., 2005), a Leukemia data set (Armstrong et al., 2002), a Malaria PM only data set (Le Roch et al., 2003), an Etoposide response data set (Fodor et al., 2006), a BK potassium channel knockout data set (Meredith et al., 2006; Pyott et al., 2006) and an alternative splicing PM only tiling microarray data set (Sugnet et al., 2006).
Table 1.
R2 of Naef and Magnasco model (Naef and Magnasco, 2003) (NM) and the position-dependent secondary-structure attenuated affinity model (PPSA) for the seven data sets used in this study. Results presented as average R2 ± SD.
| Data set | naa | npb | NM | PSAAc | |
|---|---|---|---|---|---|
| Latin Square | 42 | 248152 | PM | 0.17±0.009 | 0.184±0.010 |
| 248152 | MM | 0.40±0.009 | 0.416±0.009 | ||
| Choe (Choe et al., 2005) | 6 | 195994 | PM | 0.20±0.022 | 0.216±0.025 |
| 195994 | MM | 0.46±0.017 | 0.49±0.017 | ||
| Leukemia (Armstrong et al., 2002) | 72 | 201800 | PM | 0.49±0.063 | 0.51±0.062 |
| 201800 | MM | 0.60±0.036 | 0.61±0.035 | ||
| Etoposide response (Fodor et al., 2006) | 60 | 496468 | PM | 0.05±0.040 | 0.06±0.040 |
| 496468 | MM | 0.11±0.062 | 0.12±0.062 | ||
| BK knockout (Meredith et al., 2006;Pyott et al., 2006) | 20 | 496468 | PM | 0.09±0.035 | 0.10±0.036 |
| 496468 | MM | 0.29±0.050 | 0.30±0.049 | ||
| Splicing microarray (Sugnet et al., 2006) | 75 | 505916 | PM | 0.30±0.062 | 0.31±0.063 |
| Malaria (Le Roch et al., 2003) | 17 | 173262 | PM | 0.36±0.043 | 0.38±0.043 |
na: number of chips.
np: number of probes.
The differences in R2 between NM and PSAA are all statistically significant (P < 10-3) using paired one-sided Wilcoxon test.
2.2. System and software
All the computational work was done on a 73-node Apple cluster. Each node is a dual 2.7 GHz PowePC G5 with 2GB RAM running Mac OSX 10.4.
Secondary structure prediction was done using the hybrid-min-ss program of the UNAFold-2.5 software package (Markham and Zuker, 2005). All probes were folded as single DNA strands at 45 °C and 1.0 M sodium concentration. All other options were set to the program defaults.
Simple linear model fitting andp-value calculations were done using R linear model function (lm) (http://www.r-project.org). The Naef and Magnasco model (Naef and Magnasco, 2003) and the position-dependent secondary-structure attenuated affinity model were implemented in Perl. All Perl code is available upon request.
3. Results
3.1. Simple linear models
The signal intensity generated from each probe can be modeled as:
| (1) |
WhereI is the raw intensity value of probe j, O is the optical noise, N is the background noise of non-specific binding, and S is the signal generated from specific binding between probe j and its intended target (Wu and Irizarry, 2005). In this paper, we do not model the signal and none of our models therefore contain terms for S. Since the S term, which we are ignoring in our models, is significantly higher in the PM probes than the MM probes, each probe type was modeled separately.
Controlling the GC content of the probe is one of the basic principles of microarray probe design. A probe with high GC content tends to hybridize better and to form a stable duplex with both target and non-target sequences. A simple linear model that relates probe intensity to GC content can be written as follows:
| (2) |
where I is the raw intensity of probe j, is the number of GC nucleotides in probe j (which is a number between 0 and 25), B0 and B1 are free parameters and εj is an error term. The model explains a modest amount of the overall intensity when applied to the Latin Square data set; R2 ≈ 0.02 for PM and 0.12 for MM (Fig. 1). The model explains more of the MM probes intensity because most of the signal obtained from MM probes is background noise. MM intensity is therefore more independent of the concentration of the target gene.
Fig. 1.
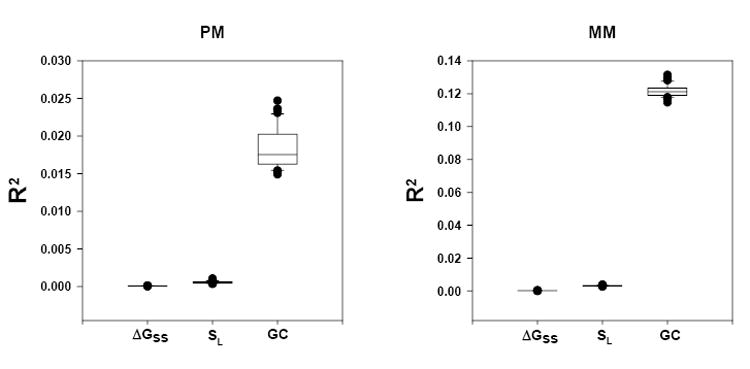
R2 distribution for the simple linear models (Eq.s 2-4) for all the U133 Latin Square chips. The null hypothesis that the B1 parameter is equal to zero is rejected with high confidence (P < 10-4) for all the models.
We wondered, compared to the GC content, how much of the background noise probe secondary structure would explain when put into a simple linear model. The free energy of probe secondary structure formation (ΔGss) is an indicator of the stability of secondary structure in which the probe folds on itself. The more stable the secondary structure, the less a probe will be able to hybridize to its target or non-target sequences. As a result, one would expect to observe a low signal from such probe.
How much of all probe variance can be explained directly by secondary structure predictions? A simple linear model is:
| (3) |
where is probe j minimum folding energy in Kcal/mol.
If we apply this simple linear model to the Latin Square data set, we find a very low r-squared values; R2 < 10-4 (Fig. 1). However, the p-value of the null hypothesis that the B1 parameter is equal to zero is rejected with high confidence (Fig. 1). These data suggest that there is a statistically significant influence of ΔGss on the observed intensity, although this relationship does not explain very much of the overall intensity on the array.
One may argue that the low r-squared values in Eq. 3 are due to the fact that ΔGss value does not reflect the size of the secondary structure motif found in that probe and the number of free bases available for hybridization. The program hybrid-min-ss reports for the most stable secondary structure of a probe whether a given nucleotide is involved in secondary structure formation or not. We can define a value, SL, which is the longest stretch of nucleotides that are not involved in secondary structure formation (for example, SL=10 in Fig. 2). To investigate the relationship between the longest free string of bases of the folded probe (SL) and the observed intensity, we can again apply a simple linear model:
| (4) |
where is the longest free string of bases in probe j based on its minimum energy structure. This model also has a very low r-squared values when applied to the Latin Square data set; R2 < 10-3 (Fig. 1), only slightly higher than Eq. 3 suggesting little direct effects of probe SL on the observed intensity. However, the p-value of the null hypothesis that the B1 parameter is equal to zero is also rejected with high confidence (Fig. 1).
Fig. 2.
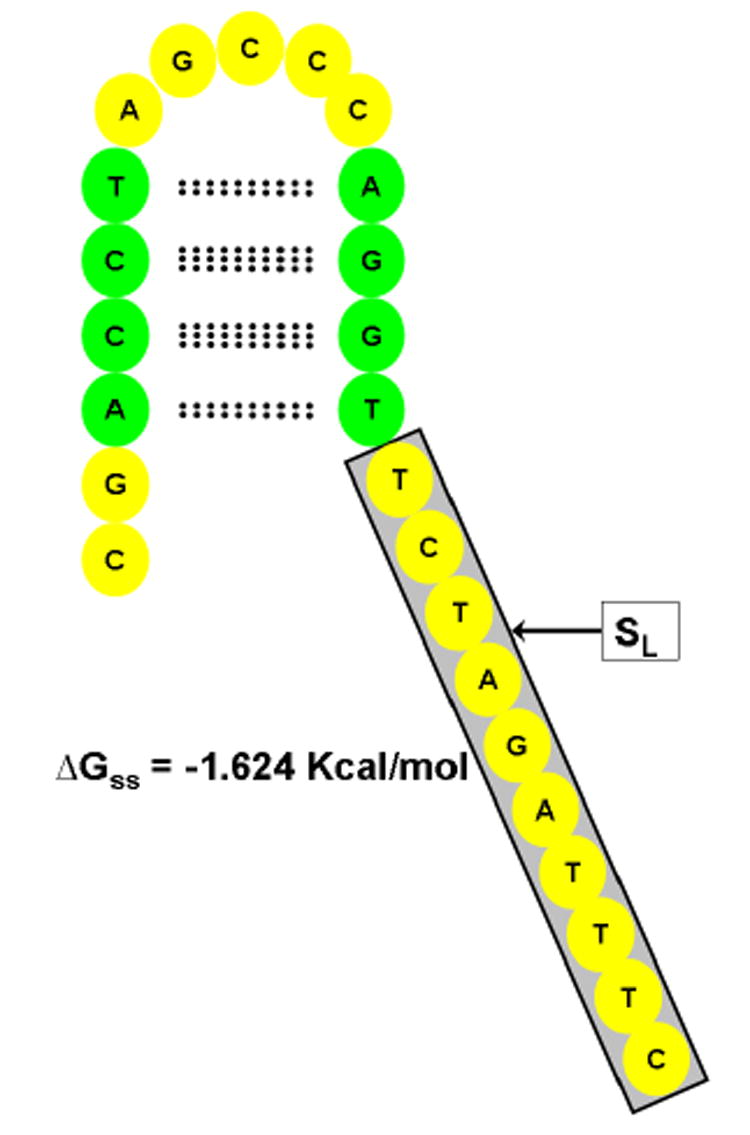
Folded probe showing its sequence, minimum folding energy (ΔGss) and minimum energy structure. The longest free string of bases of the folded probe (SL) is shown in gray box; bases involved in hydrogen bonding are shown in green ovals.
We see that GC content can explain a modest amount of overall intensity. Models based on secondary structure explain much less of the intensity data, although they are still highly statistically significant.
3.2. Position-dependent secondary-structure attenuated affinity model
Since the three simple linear models (Eq. 2-4) all hold significant relationships with the observed intensity (Fig. 1), we wanted to combine them into one model that takes into account the base composition, ΔGss and SL of the probe. We found that a simple linear combination of GC, ΔGss and SL did not significantly improve on the power of the individual models (data not shown). We reasoned that a model that is aware of each probe’s base position and involvement in the overall secondary structure of the probe would outperform models that ignore this information.
The model of Naef and Magnasco (Naef and Magnasco, 2003) provides a starting point that meets our requirement for individual base information. In this model, probe background is modeled based on sequence composition:
| (5) |
where B is the raw probe intensity, M is the median intensity of the array, l is nucleotide index, k is the position of l along the probe, S a Boolean variable equals to 1 if the probe sequence has l at k and zero otherwise, and A is the per-site per letter affinity. To clarify, consider the probe shown in Fig. 2, thenEq. 5 will read:
Eq. 5 is a simple model that has four free parameters for each probe base (100 free parameters for a 25-base probe). The values of these 100 free parameters are generated by linear least squares fit (Naef and Magnasco, 2003). Given the large number of probes on each chip (about half a million for the human genome U133 chip, for example) over-fitting is not a concern.
In our approach, we add the continuous variable θ to reflect the involvement of the probe nucleotides in secondary structure formation. The model now is written as:
| (6) |
The θ term reflects the degree to which an individual probe base participates in secondary structure formation. In our model, it is represented by any value between 0 and 1. There are a large number of ways in which values for θ could be generated. We made the following simplifying assumptions. We begin by considering nucleotides that are not involved in secondary structure formation. In cases where a probe’s ΔGss> 0 Kcal/mol we can set θ for all bases within that probe to 1. Likewise, when a base within a probe is not involved in secondary structure hydrogen bonding (yellow ovals inFig 2, for example), we can set θ to 1 for that base. To calculate θ for the remaining bases, we set a ΔGss-cutoff value, below which θ will be constant (θ = tb). We assumed that the relationship between θ and ΔGss is linear in the region where ΔGss is between ΔGss-cutoff and 0 (Fig. 3). From the assumption of linearity, we can derive a slope and an intercept to yield:
| (7) |
Fig. 3.
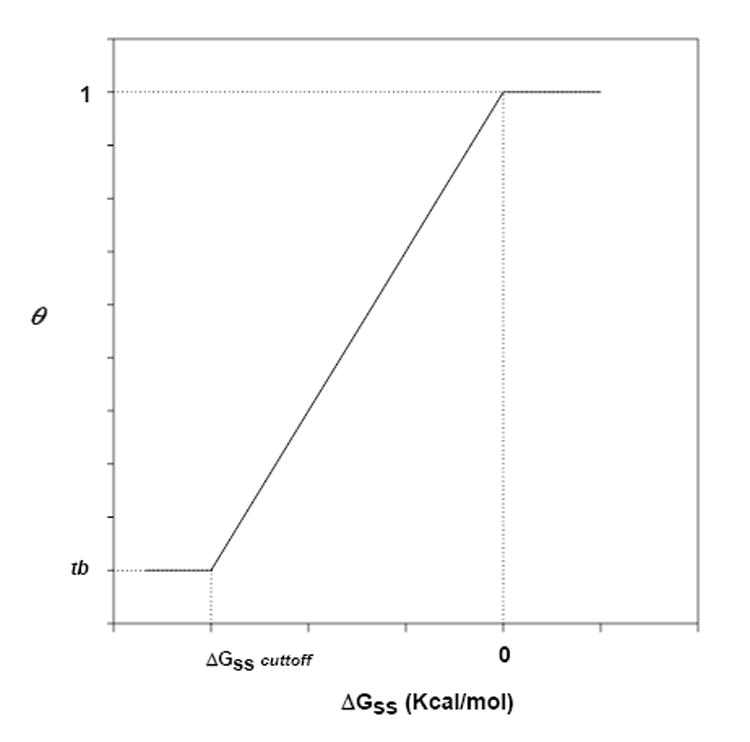
A model for the relationship between ΔGss and θ for the bases involved in secondary structure formation.
This equation has two unknown parameters ΔGss-cutoff and tb. To find the best values for these parameters, we tested the effects of changing ΔGss-cutoff and tb on the performance of the model (Eq. 6) on a single chip from the Latin Square data set. We found that the best performance of the model was obtained at ΔGss-cutoff = -3.6 Kcal/mol and a tb = 0.35 (Fig. 4).
Fig. 4.
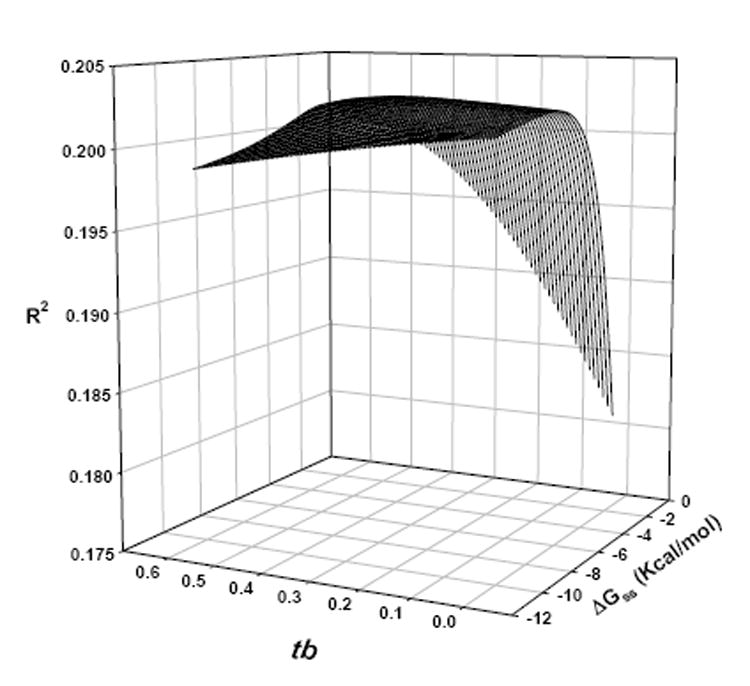
Effects of changing the values of ΔGss-cutoff and tb on the performance of the position-dependent secondary-structure attenuated affinity model using the human genome U133 Latin Square Experiment 2 Replicate 1 PM probes.
To summarize, we define our position-dependent secondary-structure attenuated affinity model (PSAA) as Eq. 6, where B is the raw probe intensity, M is the median intensity of the array, l is letter index, k is the position of l along the probe, A is the per-site per letter affinity, S a Boolean variable equal to 1 if the probe sequence has l at k and zero otherwise, and θ is:
1, if the probe ΔGss > 0 Kcal/mol.
1, if the probe ΔGss ≤ 0 Kcal/mol and l is not involved in secondary structure hydrogen bonding.
and l is involved in secondary structure hydrogen bonding.
Here, the involvement of each probe base in secondary structure hydrogen bonding is based on its minimum energy structure.
When we consider the folded probe presented inFig. 2, Eq. 6reads:
The model defined in Eq. 6 was fitted to all the data sets (Table 1). The fitting was done on the PM and MM probes separately. Table 1 shows a comparison between the native Naef and Magnasco model (Naef and Magnasco, 2003) and our position-dependent secondary-structure attenuated affinity model. We see that including probe secondary structure information improved the fit of the native Naef and Magnasco model (Naef and Magnasco, 2003) by 1-3%, depending on the chip and probe type. Note that all the models (Eq. 2,3,4,5 and 6) perform better on the MM probes due to the higher background noise present in the MM signal.
3.3. Gains in performance can not be trivially explained by additional free parameters
We note that there are two distinct kinds of free parameters in our model. The 100 free parameters from the original Naef and Magnasco model (Eq. 5) are calculated for each chip by linear least squares fit. We have added two free parameters in Eq. 6, ΔGss-cutoff and tb. These parameters were determined from one of the Latin Square data set chips from the curves shown in Fig. 4 and were held constant for all the data sets in this paper. Given that our fits contain between 173,262 and 496,468 data points (Table 1), it seems unlikely that the improvements in performance could be explained by the addition of the free parameters ΔGss-cutoff and tb. Nonetheless, to further rule out this possibility, we refolded the Latin Square data set probes with either a completely random sequence (generated with an equal probability of A, C, G and T) or a shuffled sequence. Then we fed Eq. 6 the original probe sequence (i.e. the right l at k) along with the new ΔGss and the new minimum energy structure that resulted from folding the random or shuffled probe sequence. For the random sequence case, the performance of the original Naef and Magnasco model (Naef and Magnasco, 2003) was severely degraded (Fig. 5). For the shuffled sequences, the probe’s base composition is not affected, but the position of each base has been changed due to the shuffling process. For the shuffled sequences, the fit of the model dropped down to that of the originalNaef and Magnasco model (Naef and Magnasco, 2003). These results on shuffled and random sequence show that the presence of the two additional free parameters ΔGss-cutoff and tb cannot by themselves explain the improved performance over the original Naef and Magnasco model (Naef and Magnasco, 2003). This strongly supports our argument that the gain in the r-squared values of our model came from including probe secondary structure information and do not arise trivially from the addition of free parameters.
Fig. 5.
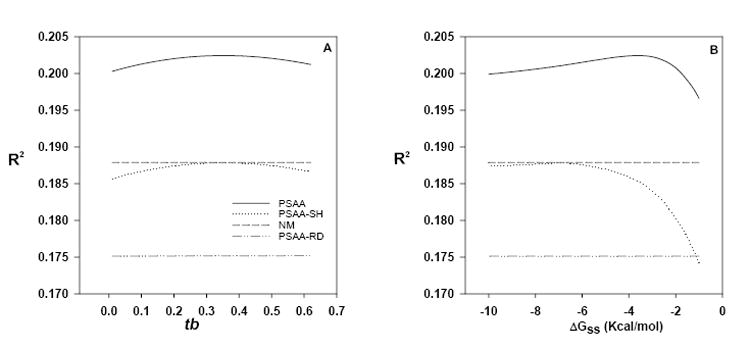
Effects of changing tb or ΔGss-cutoff on the performance of the PSAA model. Effects of changing (A) the values of tb while holding ΔGss-cutoff = -3.6 or (B) the values of ΔGss-cutoff while holding tb = 0.35 on the performance of PSAA: the position-dependent secondary-structure attenuated affinity model (Eq. 6). Data shown are for the human genome U133 Latin Square Experiment 2 Replicate 1 PM probes. NM: Naef and Magnasco (Naef and Magnasco, 2003) model (Eq. 5). The suffixes (-SH) and (-RD) indicates the R2 after generating the minimum folding energy (ΔGss) and the minimum energy structure from shuffled and random sequences, respectively (see section 3.3 for explanation).
4. Discussion
In the absence of a clear understanding of the microarray hybridization mechanisms and the frequent use of probes that fold into stable secondary structure under the hybridization conditions on microarrays, a model is needed to explain or approximate the effects of such behavior on microarray signal. Using simple linear models, we saw a modest relationship (R2 < 10-3) between probe intensity and its ΔGss or SL. We propose as a more powerful alternative to two parameter linear models, a modification of the Naef and Magnasco model (Naef and Magnasco, 2003) to include probe secondary structure effects on the background intensity. Our model works by equating an increase in secondary structure with a decreased contribution to a linear least square fit. If a particular base is involved in secondary structure hydrogen bonding (Fig. 2), we assign it a low θ score depending on the overall ΔGss of the probe (Eq. 7). Consequently, this base contribution is attenuated in the Naef and Magnasco model (Naef and Magnasco, 2003). Consider, for example, the third adenine base in the folded probe presented inFig. 2, in the Naef and Magnasco model (Naef and Magnasco, 2003) its contribution to the brightness isA3A. Based on the predictions of hybrid-min-ss, this base is involved in secondary structure hydrogen bonding and we therefore expect a reduced contribution to the intensity caused by background binding. We therefore attenuate its contribution to the brightness by θ, and its contribution now is 0.64A3A instead ofA3A. Results attenuated by θ have more power than the original Naef and Magnasco model (Naef and Magnasco, 2003) over a wide range of Affymetrix data sets (Table 1).
The secondary structure information used here is based on the minimum folding energy (ΔGss) and the minimum energy structure, as predicted by an energy minimization algorithm (Markham and Zuker, 2005) that uses the nearest-neighbor parameters (SantaLucia, 1998) to predict secondary structure of single-stranded DNA molecules in solution. In the absence of clear understanding of the effects of the geometric constraints of attaching one end of the DNA probe to the chip surface on its secondary structure, the nearest-neighbor parameters represent a reasonable approximation for microarray (Held et al., 2003). We are also fully aware that single-stranded DNA molecules are highly dynamic and each molecule is likely to exist in an ensemble of structures. Based on that, predicting the minimum folding energy (ΔGss) and the minimum energy structure for any single-stranded DNA molecule can be different when using different prediction algorithms, even when the same folding conditions are used. The results presented here are based on the minimum folding energy (ΔGss) and the minimum energy structure calculated using UNAFold (Markham and Zuker, 2005). It has been shown that the differences in the predicted minimum folding energy (ΔGss) and the minimum energy structure between different prediction algorithms are small (Ding et al., 2004; Ratushna et al., 2005). Consequently, we would expect similar results no matter which of the currently popular secondary structure prediction algorithms were used.
The results presented in this work suggest that, on average, 1-3% of all the intensities on Affymetrix GeneChip microarrays can be explained by probe secondary structure independent of any target information. Given that not all the probes form stable secondary structure (50% of the human genome U133 Latin Square data set probes, for example have predicted ΔGss > 0), the 1-3% enhancement over the original model is quite satisfactory, and represent a step forward in understanding the factors that affect the on-chip hybridization process.
The current design of GeneChip microarrays devotes half of the chip to MM probes. The sole purpose of these probes is to estimate the background noise portion present in the PM signal to enhance the chip ability to detect differently expressed genes. Advances in the ability to correctly estimate background noise on Affymetrix GeneChip microarrays based on probe sequence information may in the future eliminate the need of MM probes on these arrays offering more space to interrogate more genes on the same array.
Acknowledgments
This research was supported in part by NIH 1R01GM072619-01 (C.J.G.) and by the UNC-Charlotte GASP program (R.Z.G.). Cel files for the splicing microarray data set were generously provided by Manny Ares.
Footnotes
Publisher's Disclaimer: This is a PDF file of an unedited manuscript that has been accepted for publication. As a service to our customers we are providing this early version of the manuscript. The manuscript will undergo copyediting, typesetting, and review of the resulting proof before it is published in its final citable form. Please note that during the production process errors may be discovered which could affect the content, and all legal disclaimers that apply to the journal pertain.
References
- Anthony RM, Schuitema AR, Chan AB, Boender PJ, Klatser PR, Oskam L. Effect of secondary structure on single nucleotide polymorphism detection with a porous microarray matrix; implications for probe selection. Biotechniques. 2003;34:1082–1089. doi: 10.2144/03345dd05. [DOI] [PubMed] [Google Scholar]
- Armstrong SA, Staunton JE, Silverman LB, Pieters R, den Boer ML, Minden MD, Sallan SE, Lander ES, Golub TR, Korsmeyer SJ. MLL translocations specify a distinct gene expression profile that distinguishes a unique leukemia. Nat Genet. 2002;30:41–47. doi: 10.1038/ng765. [DOI] [PubMed] [Google Scholar]
- Choe SE, Boutros M, Michelson AM, Church GM, Halfon MS. Preferred analysis methods for Affymetrix GeneChips revealed by a wholly defined control dataset. Genome Biol. 2005;6:R16. doi: 10.1186/gb-2005-6-2-r16. [DOI] [PMC free article] [PubMed] [Google Scholar]
- Chudin E, Walker R, Kosaka A, Wu S, Rabert D, Chang T, Kreder D. Assessment of the relationship between signal intensities and transcript concentration for Affymetrix GeneChip(R) arrays. Genome Biol. 2001;3:research0005.0001–research0005.0010. doi: 10.1186/gb-2001-3-1-research0005. [DOI] [PMC free article] [PubMed] [Google Scholar]
- Ding Y, Chan CY, Lawrence CE. Sfold web server for statistical folding and rational design of nucleic acids. Nucl Acids Res. 2004;32:W135–141. doi: 10.1093/nar/gkh449. [DOI] [PMC free article] [PubMed] [Google Scholar]
- Fodor AA, Tickle TL, Richardson C. Towards the uniform distribution of null p-values on microarrays. Genome Biol. 2006 doi: 10.1186/gb-2007-8-5-r69. Submitted. [DOI] [PMC free article] [PubMed] [Google Scholar]
- Forman JE, Walton ID, Stern D, Rava RP, Trulson MO. Thermodynamics of duplex formation and mismatch discrimination on photolithographically synthesized oligonucleotide arrays. ACS Symp Ser. 1998;682:206–228. [Google Scholar]
- Held GA, Grinstein G, Tu Y. Modeling of DNA microarray data by using physical properties of hybridization. Proc Natl Acad Sci U S A. 2003;100:7575–7580. doi: 10.1073/pnas.0832500100. [DOI] [PMC free article] [PubMed] [Google Scholar]
- Irizarry RA, Hobbs B, Collin F, Beazer-Barclay YD, Antonellis KJ, Scherf U, Speed TP. Exploration, normalization, and summaries of high density oligonucleotide array probe level data. Biostat. 2003;4:249–264. doi: 10.1093/biostatistics/4.2.249. [DOI] [PubMed] [Google Scholar]
- Irizarry RA, Wu Z, Jaffee HA. Comparison of Affymetrix GeneChip expression measures. Bioinformatics. 2006;22:789–794. doi: 10.1093/bioinformatics/btk046. [DOI] [PubMed] [Google Scholar]
- Koehler RT, Peyret N. Effects of DNA secondary structure on oligonucleotide probe binding efficiency. Comput Biol Chem. 2005;29:393–397. doi: 10.1016/j.compbiolchem.2005.09.002. [DOI] [PubMed] [Google Scholar]
- Le Roch KG, Zhou Y, Blair PL, Grainger M, Moch JK, Haynes JD, De La Vega P, Holder AA, Batalov S, Carucci DJ, Winzeler EA. Discovery of gene function by expression profiling of the malaria parasite life cycle. Science. 2003;301:1503–1508. doi: 10.1126/science.1087025. [DOI] [PubMed] [Google Scholar]
- Li C, Wong WH. Model-based analysis of oligonucleotide arrays: expression index computation and outlier detection. Proc Natl Acad Sci U S A. 2001;98:31–36. doi: 10.1073/pnas.011404098. [DOI] [PMC free article] [PubMed] [Google Scholar]
- Lima WF, Monia BP, Ecker DJ, Freier SM. Implication of RNA structure on antisense oligonucleotide hybridization kinetics. Biochemistry. 1992;31:12055–12061. doi: 10.1021/bi00163a013. [DOI] [PubMed] [Google Scholar]
- Lockhart DJ, Dong H, Byrne MC, Follettie MT, Gallo MV, Chee MS, Mittmann M, Wang C, Kobayashi M, Horton H, Brown EL. Expression monitoring by hybridization to high-density oligonucleotide arrays. Nat Biotechnol. 1996;14:1675–1680. doi: 10.1038/nbt1296-1675. [DOI] [PubMed] [Google Scholar]
- Markham NR, Zuker M. DINAMelt web server for nucleic acid melting prediction. Nucleic Acids Res. 2005;33:W577–581. doi: 10.1093/nar/gki591. [DOI] [PMC free article] [PubMed] [Google Scholar]
- Meredith AL, Wiler SW, Miller BH, Takahashi JS, Fodor AA, Ruby NF, Aldrich RW. BK calcium-activated potassium channels regulate circadian behavioral rhythms and pacemaker output. Nat Neurosci. 2006;9:1041–1049. doi: 10.1038/nn1740. [DOI] [PMC free article] [PubMed] [Google Scholar]
- Naef F, Magnasco MO. Solving the riddle of the bright mismatches: labeling and effective binding in oligonucleotide arrays. Phys Rev E Stat Nonlin Soft Matter Phys. 2003;68:011906. doi: 10.1103/PhysRevE.68.011906. [DOI] [PubMed] [Google Scholar]
- Naef F, Socci ND, Magnasco M. A study of accuracy and precision in oligonucleotide arrays: extracting more signal at large concentrations. Bioinformatics. 2003;19:178–184. doi: 10.1093/bioinformatics/19.2.178. [DOI] [PubMed] [Google Scholar]
- Nielsen HB, Gautier L, Knudsen S. Implementation of a gene expression index calculation method based on the PDNN model. Bioinformatics. 2005;21:687–688. doi: 10.1093/bioinformatics/bti078. [DOI] [PubMed] [Google Scholar]
- Pyott SJ, Meredith AL, Fodor AA, Vázquez AE, Yamoah EN, Aldrich RW. Cochlear function in mice lacking the BK channel a, b1, or b4 subunits. J Biol Chem. 2006 doi: 10.1074/jbc.M608726200. In Press. [DOI] [PubMed] [Google Scholar]
- Ratushna VG, Weller JW, Gibas CJ. Secondary structure in the target as a confounding factor in synthetic oligomer microarray design. BMC Genomics. 2005;6:31. doi: 10.1186/1471-2164-6-31. [DOI] [PMC free article] [PubMed] [Google Scholar]
- SantaLucia J., Jr A unified view of polymer, dumbbell, and oligonucleotide DNA nearest-neighbor thermodynamics. Proc Natl Acad Sci U S A. 1998;95:1460–1465. doi: 10.1073/pnas.95.4.1460. [DOI] [PMC free article] [PubMed] [Google Scholar]
- SantaLucia J, Jr, Hicks D. The thermodynamics of DNA structural motifs. Annu Rev Biophys Biomol Struct. 2004;33:415–440. doi: 10.1146/annurev.biophys.32.110601.141800. [DOI] [PubMed] [Google Scholar]
- Shchepinov MS, Case-Green SC, Southern EM. Steric factors influencing hybridisation of nucleic acids to oligonucleotide arrays. Nucleic Acids Res. 1997;25:1155–1161. doi: 10.1093/nar/25.6.1155. [DOI] [PMC free article] [PubMed] [Google Scholar]
- Southern E, Mir K, Shchepinov M. Molecular interactions on microarrays. Nat Genet. 1999;21:5–9. doi: 10.1038/4429. [DOI] [PubMed] [Google Scholar]
- Sugnet CW, Srinivasan K, Clark TA, Brien G, Cline MS, Wang H, Williams A, Kulp D, Blume JE, Haussler D, Ares M. Unusual Intron Conservation near Tissue-Regulated Exons Found by Splicing Microarrays. PLoS Comput Biol. 2006;2:e4. doi: 10.1371/journal.pcbi.0020004. [DOI] [PMC free article] [PubMed] [Google Scholar]
- Wu Z, Irizarry RA. Stochastic models inspired by hybridization theory for short oligonucleotide arrays. J Comput Biol. 2005;12:882–893. doi: 10.1089/cmb.2005.12.882. [DOI] [PubMed] [Google Scholar]
- Zhang L, Miles MF, Aldape KD. A model of molecular interactions on short oligonucleotide microarrays. Nat Biotechnol. 2003;21:818–821. doi: 10.1038/nbt836. [DOI] [PubMed] [Google Scholar]