

Abstract
New antimalarials are urgently needed. We have shown that tetrahydroquinoline (THQ) protein farnesyltransferase (PFT) inhibitors (PFTIs) are effective against the Plasmodium falciparum PFT and are effective at killing P. falciparum in vitro. Previously described THQ PFTIs had limitations of poor oral bioavailability and rapid clearance from the circulation of rodents. In this paper, we validate both the Caco-2 cell permeability model for predicting THQ intestinal absorption and the in vitro liver microsome model for predicting THQ clearance in vivo. Incremental improvements in efficacy, oral absorption, and clearance rate were monitored by in vitro tests; and these tests were followed up with in vivo absorption, distribution, metabolism, and excretion studies. One compound, PB-93, achieved cure when it was given orally to P. berghei-infected rats every 8 h for a total of 72 h. However, PB-93 was rapidly cleared, and dosing every 12 h failed to cure the rats. Thus, the in vivo results corroborate the in vitro pharmacodynamics and demonstrate that 72 h of continuous high-level exposure to PFTIs is necessary to kill plasmodia. The metabolism of PB-93 was demonstrated by a novel technique that relied on double labeling with a radiolabel and heavy isotopes combined with radiometric liquid chromatography and mass spectrometry. The major liver microsome metabolite of PB-93 has the PFT Zn-binding N-methyl-imidazole removed; this metabolite is inactive in blocking PFT function. By solving the X-ray crystal structure of PB-93 bound to rat PFT, a model of PB-93 bound to malarial PFT was constructed. This model suggests areas of the THQ PFTIs that can be modified to retain efficacy and protect the Zn-binding N-methyl-imidazole from dealkylation.
Malaria remains a huge issue in global health. Snow et al. estimate that there were 515 million cases of malaria in 2002 (21), and the WHO estimates that there are approximately 2 million deaths due to Plasmodium falciparum each year (26) Despite a vigorous campaign to roll back the impact of malaria, the rates of morbidity and mortality from malaria are actually increasing (21). Much of the reason for the increasing morbidity and mortality is the increased resistance to the low-cost drugs that are available in the developing world (18) Thus, new inexpensive drugs are urgently needed to address the global burden of malaria.
Protein farnesyltransferase (PFT) inhibitors (PFTIs) are promising drugs for the treatment of malaria, and a number of different scaffolds have been shown to inhibit the growth of the malaria parasite in vitro and in vivo (2-4, 7-9, 11, 12, 16, 19, 20, 27-31). In our previous publications, we showed that tetrahydroquinoline (THQ) PFTIs inhibit malaria growth (5, 16). THQ PFTIs are cidal and not static, as evidenced by the inability of parasites to recover in washout experiments in vitro and after sufficient exposure in the Plasmodium berghei mouse model (16). The initial THQ compounds studied had poor oral bioavailabilities and underwent rapid clearance from animals. For this reason, it was necessary to implant subcutaneous pumps to administer stable levels of THQ PFTIs to demonstrate proof-of-concept killing of Plasmodium berghei in mice (16). The in vitro cultivation of P. falciparum in the presence of increasing concentrations of THQ compounds led to parasites with 10- to 13-fold increased resistance to THQs (5, 16). The resistant parasites were determined to contain mutations encoding amino acid changes in the PFT active site that led to 10- to 13-fold reduced sensitivities of the enzyme to THQ inhibition. This established with near certainty that PFT is the target of the THQ compounds.
Novel antimalarial drugs are urgently needed for the developing world because the developing world bears most of the morbidity and the mortality burden. Drugs for the developing world must be inexpensive and easily administered. The product profile of an antimalarial drug useful for the developing world includes oral bioavailability, a maximum 3 days of therapy for cure, and once- or twice-daily dosing (17). The in vitro pharmacodynamics of THQ PFTIs demonstrated that 3 days of exposure at levels 10 to 50 times the concentration that led to 50% growth inhibition (the 50% effective dose [ED50]) was necessary for the complete killing of P. falciparum (16). As noted above, the initial THQ compounds had issues with poor oral bioavailability and rapid clearance. Thus, for THQ PFTIs to become useful as antimalarials, compounds with improved oral absorption and reduced clearance must be found.
This paper reports on studies of the issues surrounding THQ oral absorption and clearance. Results that validate the findings from in vitro models that were used to address these issues are presented. THQs with improved drug-like properties that lead to oral efficacy in 3 days in a rat model of malaria are reported. In addition, a structural model of THQ PFTIs in the active site of the P. falciparum PFT is presented. This model shows where additional modifications in THQ can be made to retain its potency and improve its metabolism.
MATERIALS AND METHODS
Plasmodium strains.
The P. falciparum strains used in this study were 3D7 (a chloroquine-sensitive strain from a case of airport-associated malaria in The Netherlands) and K1 (a chloroquine-resistant, pyrimethamine-resistant strain from Thailand). Strain 3D7 was provided by Pradipsinh Rathod from the University of Washington. P. falciparum strain K1 and P. berghei isolate NK65 (used for rodent malaria experiments) were obtained from the MR4 Unit of the American Type Culture Collection (Manassas, VA).
P. falciparum culture.
Strains of P. falciparum were cultured in vitro by using the experimental techniques described by Trager and Jensen (23). Cultures were maintained in RPMI 1640 (Sigma, St. Louis, MO) with 2 mM l-glutamine, 25 mM HEPES, 33 mM NaHCO3, 20 μg/ml gentamicin sulfate, and 20% (vol/vol) heat-inactivated human type A-positive plasma (RP-20P). Type A-positive erythrocytes were obtained from laboratory donors, washed three times with RPMI 1640, resuspended in 50% RPMI 1640, and stored at 4°C. The parasites were grown in 10 ml of 2% (vol/vol) hematocrit-RP-20P in 50-ml flasks under a 5% CO2, 5% O2, and 90% N2 atmosphere.
P. falciparum ED50 determination.
Ten microliters of PFTI in solution was added to each well of a 96-well plate, followed by the addition of 190 μl of an asynchronous P. falciparum culture at a parasitemia and a hematocrit of 0.5% each. PFTI solutions were prepared by diluting 20 mM THQ PFTI in dimethyl sulfoxide (DMSO) by 200-fold with RP-20P for the highest concentration (a 100 μM stock gave a final assay concentration of 5 μM) and then performing further serial dilutions in RP-20P. The plates were flushed with 5% CO2, 5% O2, and 90% N2 and were then incubated at 37°C for 48 h. [8-3H]hypoxanthine (0.3 μCi, 20 Ci/mmol; American Radiolabeled Chemicals) in 30 μl RP-20P was added to the cultures, and the cultures were incubated for an additional 24 h. Cells were harvested onto glass fiber filters with a cell harvester (Inotech Biosystems International, Inc., Rockville, MD), and the radioactivity incorporated into the parasites was counted on a Chameleon 425-104 multilabel plate counter (Hidex Oy, Turku, Finland). The background level detected with uninfected erythrocytes was subtracted from the data. The level of 3H incorporation into infected erythrocytes with 1 μl DMSO vehicle alone represents 100% malaria growth. ED50 values, the effective dose that reduces growth by 50%, were determined by linear regression analysis of the plots of the level of [3H]hypoxanthine incorporation versus the concentration of compound. Each compound was tested in duplicate, and the mean value is shown; individual measurements differed by less than threefold.
P. falciparum PFT IC50 determination.
The PFT assay used to determine the inhibitor concentration that caused 50% enzyme inhibition (IC50) is based on a PFT 3H scintillation proximity assay (SPA; TRKQ7010; Amersham Biosciences Corp., Piscataway, NJ) (3). SPA works on the basis of the principle that the radioactivity in close proximity to avidin-coated beads containing scintillant emits more light than the radioactivity throughout the solution. The biotinylated peptide is prenylated with [3H]farnesyl when PFT is not inhibited, the biotin-peptide-[3H]farnesyl binds to avidin-coated beads containing scintillant, and light is emitted. Assays were carried out in assay buffer (pH 7.5, 50 mM HEPES, 30 mM MgCl2, 20 mM KCl, 5 mM dithiothreitol, 0.01% Triton X-100), 1 μM human lamin B carboxy-terminus sequence peptide (biotin-YRASNRSCAIM), and 1 μCi [3H]farnesylpyrophosphate (specific activity, 15 to 20 Ci/mM; Amersham) in a total volume of 50 μl which included 1 μl of PfPFT inhibitor solution in DMSO and 5 μl of partially purified PfPFT. Assays performed in the absence of inhibitor PfPFT and PfPFT were included as positive and negative controls, respectively. The reaction mixtures were incubated at 37°C for 60 min and terminated by addition of 70 μl of assay STOP solution (Amersham) and 5 μl SPA beads. The assay mixture was incubated at room temperature for 30 min. The assay results were counted on a plate Chameleon 425-104 multilabel counter (Hidex Oy) that detected the photons emitted by the scintillation beads bound to biotin-peptide-[3H]farnesyl. IC50 values were calculated by linear regression analysis of the plots of the amount of radioprenylation versus the concentration of compound.
THQ compound synthesis.
The THQ compounds cited in this publication are listed below. We will describe the synthesis and characteristics of these THQs in a separate report (1a). For Caco-2 cell/blood level measurements (Fig. 1) the compounds used for the plot included LN-16, LN-20, LN-25, LN-29, PB-17, PB-26, PB-27, PB-37, PB-43, PB-48, PB-54, PB-93, PB-102, and BS-03. See Table 6 for the results for the PB-54 analogs with R5 modifications, in which the results are given for the following 35 analogs: PB-69, PB-86, PB-87, PB-88, PB-89, PB-90, PB-91, PB-92, PB-93, PB-94, PB-95, PB-96, PB-97, PB-98, PB-99, PB- 100, PB-101, PB-102, PB-104, PB-105, PB-106, PB-107, PB-108, PB-109, PB-110, PB-111, PB-112, PB-113, PB-114, PB-126, PB-127, PB-139, PB-140, and PB-141. To examine the effect of different linkages of the R1 pyridyl, the following compounds were compared: BMS-404683, PB-80, and PB-81. The structures of all of the compounds are shown in the supplemental material.
FIG. 1.

Correlation of peak plasma levels and Caco-2 cell permeability measurements of THQ compounds. The means of three values of the maximum plasma concentrations after dosing of THQ compounds at 50 mg per kg to mice versus Caco-2 cell permeability levels (Papp) for 14 THQ compounds with which both tests were performed are shown. The best-fit line is shown with the slope of the line and the statistical significance of the linear relationship (r2 value and P value, respectively; Prism GraphPad software).
TABLE 6.
A series of 35 PB-54 analogs with modifications at R5 demonstrates that carbamates have the best efficacy and PK/ADME properties
 | ||||||
|---|---|---|---|---|---|---|
| PB-54 analog | Structure | IC50 (nM) | ED50 (nM) | Caco-2 cell permeability (10−6 cm/s) | Cmax (μM) after oral administration of 50 mg/kg to rats | AUC (μM · min) after oral administration 50 mg/kg to rats |
| Carbamates |  |
0.5-1.6 | 16-155 | 1.0-15.5 | 4.5-8.4 | 653-1,806 |
| Amides |  |
0.6-1.2 | 12-48 | 0.5-0.6 | 0 (1)a | 0 (1) |
| Ureas | 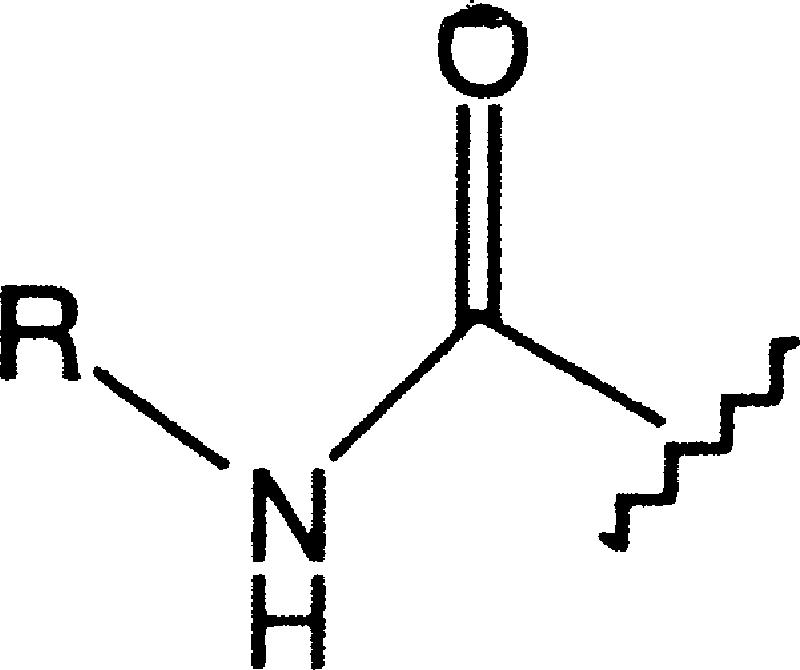 |
0.8-1.8 | 13-320 | 0.6-0.7 | 0 (1) | 0 (1) |
| Sulfonamides |  |
0.5-0.9 | 62-75 | 0.1-1.0 | 0 (1) | 0 (1) |
Values in parentheses indicate the number of rats.
Synthesis of [13C, 15N]PB-93.
The analog of PB-93 containing a bromine instead of cyano at the 6 position of the THQ ring [4-({[6-bromo-1-(3-methyl-3H-imidazol-4-ylmethyl)-1,2,3,4-tetrahydro-quinolin-3-yl]-(pyridine-2-sulfonyl)- amino}-methyl)-piperidine-1-carboxylic acid methyl ester; 10 mg; prepared by methods analogous to those described elsewhere (16), except that the imidazole rather than the imidazolium trifluoroacetate salt was used] was dissolved in 1 ml of anhydrous dimethyl formamide (Aldrich) in a glass vial with a Teflon septum-lined screw cap. Argon was bubbled through the solution for 10 min by inserting a needle through the cap. [13C, 15N]Zn(CN)2 (see below) (3 mg) was added, and argon was passed through the solution for an additional 10 min. Pd(PPh3)4 (1 mg; Aldrich) was added, followed by brief bubbling with argon. The mixture was heated in the capped vial under argon in an oil bath at 120°C for 16 h. The mixture was allowed to cool, and water and ethyl acetate were added. The organic layer was concentrated to dryness, and the residue was purified on a C18 reverse-phase high-pressure liquid chromatography column, as described previously (16), to give 2.7 mg of the desired product (the structure was confirmed by 1H-nuclear magnetic resonance and electrospray ionization mass spectrometry [MS]).
[13C, 15N]Zn(CN)2 was made as follows. [13C, 15N]KCN (50 mg; Cambridge Isotopes) was added with stirring to a solution of ZnSO4(H2O)7 (1.1 g) in 0.34 ml of water. The mixture was stirred for 30 min at room temperature, and the precipitated [13C, 15N]Zn(CN)2 was collected by centrifugation. The solid was washed twice by resuspension of the pellet in 0.5 ml of water, followed by recentrifugation. The solid [13C, 15N]Zn(CN)2 was dried under vacuum in a desiccator containing a beaker of P2O5.
Synthesis of [14C]PB-54, [14C]PB-43, and [14C]PB-93.
[14C]PB-54, [14C]PB-43, and [14C]PB-93 were made as described above for [13C, 15N]PB-93 by using [14C]Zn(CN)2 (American Radiochemicals, Inc., St. Louis, MO). [14C]PB-54 and [14C]PB-43 were made by using 25 mg of the aromatic bromide and 5.3 mg of [14C]Zn(CN)2 (110 Ci/mol). [14C]PB-93 was made by using 10 mg of the aromatic bromide and 3 mg of [14C]Zn(CN)2 (25 Ci/mol). The radiolabeled compounds were judged to be radiochemically pure by thin-layer chromatographic analysis on a silica plate with fluorography to visualize the radioactivity by using X-ray film.
Caco-2 cell drug permeability assay.
For Caco-2 cell permeability assays (from the apical [A] side to the basolateral [B] side of the cell monolayer), Caco-2 cells (clone TC7; obtained from Ming Hu, Washington State University, Pullman) were cultured on a semipermeable membrane to form a highly functionalized epithelial barrier (24). The apparent permeability of small molecules across these cells represents a well-established in vitro model of in vivo intestinal wall transport that has often demonstrated a good correlation with intestinal absorption in humans. Caco-2 cells (4 × 10⁵) were plated on laminin-coated cell culture membrane inserts (3.0-μm pore diameter, 25-mm diameter; Nalge; Nunc). Confluence was reached 3 to 4 days after the cells were plated, and the monolayers were used for the experiments 19 to 21 days postseeding. Transepithelial electrical resistance values were taken by using a Millicell-ERS apparatus (Millipore, Bedford, MA), and [3H]mannitol transport was monitored for each well to determine the integrity of the monolayers before the drug transport assay. After the monolayers were rinsed twice with assay buffer, they were incubated at 37°C in assay buffer (Hanks buffered salt solution, 5 mM HEPES, pH 7.4) for 30 min. During the assays, all volumes amounted to 0.56 ml on the A side of the monolayer and 1.5 ml on the B side. Stock compounds in DMSO (2 mM) were diluted in assay buffer to a final concentration of 50 μM and applied to the donor (A) side of the membrane. The monolayer membranes were incubated at 37°C with shaking. At 60 min, 20-μl samples were taken from the receiver (B) side. The 20-μl samples were extracted with an equal volume of acetonitrile containing 1 pmol internal standard. The samples were then centrifuged and the supernatant was loaded directly into the vials for liquid chromatography-MS (LC/MS) analysis. The apparent permeability coefficient (Papp, cm/s · 10−6) for each compound was calculated as [(1.5 × CB60)/3,600] × (1/{4.2 [(CA0 + CA60)/2] − [(CB0 + CB60)/2]}), where CXY indicates the concentration (C) in the A or B chamber (X) at the indicated time (Y) (in minutes) (e.g., CB60 is the concentration in the B chamber at 60 min), 1.5 is the volume of the B chamber (in ml), 3,600 is 60 min (in seconds), and 4.2 is the area of the Caco-2 cells (in cm2). For assays from the B side to the A side, the assays were performed as described above; however, the compounds were placed on the B side of the chamber at time zero, and the calculations were performed as described above, but with B simply substituted for A and vice versa.
Microsome metabolism.
Liver microsome metabolism assays were performed with female pooled microsomes (BD Biosciences, San Jose, CA). The reaction mixtures (400 μl) contained pH 7.4 0.1 M potassium phosphate buffer, 3 mM MgCl2, 1 mM EDTA, 1 mM NADP+, 5 mM glucose-6-phosphate, 1 U/ml glucose-6-phosphate dehydrogenase (Sigma), and 0.5 mg/ml liver microsomes. Each reaction mixture was incubated at 37°C for 10 min, and then 2 μl of THQ as a 200 μM stock in DMSO was added to give a final solution of 1 μM THQ in the reaction mixture. At each time point, samples of the reaction mixtures were stopped with 3× the volume of acetonitrile containing an internal standard. The THQ concentration and the metabolites were quantified for each time point by LC/MS analysis.
Ames test.
The Ames test was performed by the CEREP Corp. (Redmond, WA) in 96-well plates by using two Salmonella enterica serovar Typhimurium strains, strains TA98 and TA100 (15). TA98 detects frame shifts, and TA100 detects base substitutions leading to missense mutations. These two strains were incubated with various concentrations of PB-93 and four reference compounds (quercetin, streptozotocin, aminoanthracene, and mitomycin C) for 96 h in liquid culture, after which bacterial growth was measured spectrophotometrically by using a pH indicator that changes color in response to the acidification of the medium due to bacterial growth. Mutants were detected by a shift from auxotrophy by using histidine-free medium. Metabolic activation was achieved by using the rat liver S9 microsome fraction. The compounds in both bacterial strains were tested with and without S9 at four concentrations (5, 10, 50, and 100 μM; higher customized concentrations were also used) in 48 wells. To prevent false-negative results due to bactericidal or bacteriostatic effects, a bacterial cytotoxicity assay was conducted in parallel at the same concentrations. No cytotoxicity of PB-93 or its metabolites for the Salmonella strains was observed.
Receptor binding activity.
The ability of PB-93 at 10 μM to displace a radiolabeled ligand from a panel of 50 receptors and pharmacologically active ion channels and transporters was tested at CEREP Corp. The following receptors, ion channels, and transporters were tested: adenosine A1, adenosine A2A, adenosine A3, adrenergic receptor alpha1 (nonselective), adrenergic receptor alpha2 (nonselective), adrenergic receptor beta1, dopamine D1, dopamine D2S, γ-aminobutyric acid (GABA; nonselective), GABA BZD (central), GABA Cl-channel, histamine H1, histamine H2, melatonin MT1 (ML1A), muscarinic receptor M1, muscarinic receptor M2, muscarinic receptor M3, serotonin 5-HT1A, serotonin 5-HT1B, serotonin 5-HT2A, serotonin 5-HT3, serotonin 5-HT5A, serotonin 5-HT6, serotonin 5-HT7, angiotensin-II AT1, bradykinin B2, chemokine CCR1, chemokine CXCR2 (interleukin-8B), cholecystokinin CCK1 (CCKA), endothelin ETA, galanin GAL2, melanocortin MC4, neurokinin NK2, neurokinin NK3, neuropeptide Y Y1, neuropeptide Y Y2, neurotensin NTS1 (NT1), opioid and opioid-like delta2 (DOP), opioid and opioid-like kappa (KOP), opioid and opioid-like mu (MOP), opioid and opioid-like NOP (ORL1), somatostatin sst (nonselective), vasoactive intestinal peptide VPAC1 (VIP1), vasopressin V1a, Ca2+ channel L (verapamil site) (phenylalkylamines), K+ channel KV, K+ channel SKCa, Na+ channel site 2, dopamine transporter, and norepinephrine transporter. The decrease in ligand binding was expressed as a percentage and was considered significant when a >50% decrease in ligand binding was observed at 10 μM PB-93.
Animal PK and ADME studies. (i) mouse oral PK/ADME studies.
For mouse oral pharmacokinetic (PK)/absorption, distribution, metabolism, and excretion (ADME) studies, three female BALB/c mice (ages, 8 to 10 weeks) were used in each group. Each group received a test compound at a dose of 50 mg/kg of body weight dissolved in 3% ethanol (EtOH)-7% Tween 80-90% normal saline by oral gavage. Blood plasma samples were taken at the designated time points by tail bleeding. The samples were frozen at −20°C. The test compounds were extracted from the blood plasma samples by using acetonitrile with an internal standard. A standard mix of all test compounds was prepared for comparison and quantification. The samples were quantified by LC/MS analysis.
(ii) Rat oral PK/ADME studies.
For rat oral PK/ADME studies, three female Sprague-Dawley rats (ages, 10 to 12 weeks) were used in each group. Each group received test compound at a dose of 50 mg/kg dissolved in 3% EtOH-7% Tween 80-90% normal saline by oral gavage. Blood plasma samples were taken from the saphenous vein at the designated time points and were treated as described above for extraction and quantification. The blood samples were sent to a clinical laboratory (Phoenix Laboratories, Everett, WA) at the end of dosing for determination of complete blood counts, electrolytes, and glucose concentrations for kidney and liver function tests.
(iii) Rat i.v. PK/ADME studies.
For rat intravenous (i.v.) PK/ADME studies, three female Sprague-Dawley rats (ages, 10 to 12 weeks) catheterized in the jugular vein were used in each group. Each group received test compound at a dose of 2 mg/kg dissolved in 3% EtOH-7% Tween 80-90% normal saline in a 400-μl volume through the jugular vein catheter. Blood plasma samples were taken from the jugular vein catheter at the designated time points and were treated as described above for extraction and quantification.
(iv) Rats with cannulated bile ducts.
Experiments with rats with cannulated bile ducts were performed at ABC Inc., Columbia, MO, according to the following protocol. Male Sprague-Dawley rats (approximate weight, 350 g each) were cannulated in the jugular vein and the bile duct and were allowed to recover from surgery for 1 week. Three animals each were dosed by oral gavage with 35 mg/kg of each compound dissolved in 3% EtOH-7% Tween 80-90% normal saline with 80 μCi/kg radiotracer. The animals were monitored for 18 h; urine, feces, and bile were collected; the cages were washed with methanol-water; and the animals were autopsied. The radioactivity in each sample was measured by liquid scintillation counting. Bile samples were subjected to LC and LC/MS with MS/MS to determine the probable THQ PFTI metabolites of each peak.
Studies with P. berghei-infected rats.
Five female Sprague-Dawley rats (ages, 10 to 12 weeks) were used in each group in studies with P. berghei-infected rats. One group received PB-93 and one group received PB-102, each at 50 mg/kg dissolved in 3% EtOH-7% Tween 80-90% normal saline, by oral gavage dose every 8 h for 3 days. One group of control rats received a vehicle-only dose on the same dosing schedule. All rats were infected by intraperitoneal injection with 4 × 10⁷ erythrocytes parasitized with P. berghei NK65 6 days prior to dosing. Parasitemia was determined by light microscopy of blood samples.
X-ray crystallographic studies and modeling.
Crystals of the FPT-PB-93 complex was prepared by soaking PB-93 into preformed crystals by previously described methods (22). X-ray diffraction data for the FPT-PB-93 complex were collected on a Rigaku Fr-E generator equipped with Max-Flux optics and a Raxis-IV++ image plate detector. With the detector set at 150 mm, data were collected in 250 contiguous 0.30-degree oscillation images, each of which was exposed for 300 s. The data were extended to a 2.23 Å resolution and had an Rmerge value of 6.1% and 4.3-fold multiplicity. The structure was refined by using CNX2002 software (Accelrys Inc.) to an Rfactor value of 18.9% and an Rfree value of 22.0%. The electron density maps clearly showed the orientation of PB-93. The stereochemistry of the THQ moiety in PB-93 was not able to be assigned definitively from the electron density.
A homology model of malarial PFTase (PfPFT) was generated with the MODELLER program by using the crystal structure of rat PFT complexed with the nonsubstrate tetrapeptide inhibitor CVFM and farnesyl diphosphate (FPP) as the template structure (Protein Data Bank entry 1JCR). The sequences of the two subunits (subunits a and b) of PfPFT were obtained from the PlasmoDB database (gene loci PFL2050w,a and chr11.glm_528,b) and aligned with the template with the program T-COFFEE. Only regions for which there was reasonable reliability in the alignment were included. The model of PfPFT comprises the following sequence segments (the residue numbers of the corresponding segments of the rat PFT subunits are given in parentheses): a, 72 to 164 (87 to 179) and 300 to 411 (184 to 283); b, 421 to 677 (71 to 315) and 806 to 896 (330 to 417). PfPFT and rat PFT share 23% identity and 53% similarity in the a subunit; the respective values for the b subunit are 37 and 56%. The catalytic zinc ion, six structurally conserved water molecules, and FPP were included in the model. The conformation of FPP was considered flexible during the model calculations. For this purpose, the force-field parameters for FPP were added to the MODELLER program force field on the basis of the lipid parameters of the charmm27 force field. The model with the lowest value of the objective function of the MODELLER program from 20 different calculations was used for docking studies.
Protein structure accession number.
The coordinates of the THQ moiety in PB-93 have Protein Data Bank code 2R2L, but the unique identifier has not yet been assigned.
RESULTS
Previously we have shown that THQ protein PFTIs are potent inhibitors of PfPFT and block the growth of P. falciparum in vitro and of P. berghei in the mouse model of malaria (16). We have also established with virtual certainty that PFT is the in vivo target of THQ compounds due to the association of resistant parasites with active-site mutations in PFT that render the enzyme relatively resistant to THQs in vitro (5, 6).
The major issue with THQ PFTIs as potential therapeutics is that they do not provide sufficient exposure after oral administration for effective therapy for malaria. In our previous paper, it was necessary to administer THQ PFTIs through a slow-release subcutaneous pump to show the proof of concept in the P. berghei mouse model of malaria (16). In this report, modified THQ PFTIs that give improved oral exposure for therapy for malaria are described.
The Caco-2 cell permeability model is predictive of the plasma levels of THQ PFTIs after oral administration.
We first sought an in vitro model for oral absorption of THQ PFTIs and turned to the widely used Caco-2 cell permeability model (24). In this model, human colon carcinoma Caco-2 cells are grown to a confluent monolayer in a chamber, and after several weeks, tight junctions form and the cells recapitulate many aspects of intestinal epithelial cells, including asymmetrical A and B functional differences (24). Caco-2 cell permeability assays are typically carried out from the A to the B direction (A-B) to reflect the orientation of the intestinal epithelial cells in the gastrointestinal tract (24). We compared the in vitro Caco-2 cell permeability values for a series of THQ PFTIs to measurements of peak plasma levels after oral dosing of mice. We chose peak plasma levels rather than exposure (area under the curve [AUC]) because exposure is more dependent on clearance than peak plasma levels. As can be seen in Fig. 1, higher Caco-2 values were correlated with higher peak plasma levels of THQ PFTIs. As expected, this correlation was not perfect, as first-pass metabolism and clearance rates in the liver after oral dosing also affect peak plasma concentrations. However, the significant linear relationship between Caco-2 cell permeability and peak plasma levels supports the use of Caco-2 cell permeability as a model for gastrointestinal absorption.
Oral absorption of THQ PFTIs is influenced by apparent B-to-A pump activity and is improved by a 2-pyridyl substitution.
In our initial series of THQ PFTIs with an N-methyl (Me)-imidazole substitution at the R1 position (Fig. 2), we found that the Caco-2 A-B permeability was poor (Table 1). This could be because of poor cellular permeability or due to B-to-A active transport (24). To test whether the apparent low Caco-2 cell A-B values for THQ PFTIs were due to asymmetric transport from B to A, the same series of compounds was tested for B-to-A Caco-2 cell permeability. Table 1 shows that all compounds tested in this series with an R1 group of N-Me-imidazole had very high levels of B-A transfer but extremely low levels of A-B transfer. This suggests that a B-A transport mechanism may be responsible for the poor permeability and poor plasma levels of the N-Me-imidazole THQ PFTIs.
FIG. 2.

Structure of THQ PFTI (PB-93) with substituent definitions. The structure of PB-93 THQ PFTI and the positions of groups labeled R1 through R5 in the text, tables, and figures are shown.
TABLE 1.
Relationship of R1 group to Caco-2 cell permeability and AUC after oral administration
| Compound | R1 group | Caco-2 cell permeability (10−6 cm/s)
|
Peak plasma level (μM) after oral administration of 50 mg/kg to mice | |
|---|---|---|---|---|
| A to B | B to A | |||
| LN-16 | N-Me-imidazole | 0.7 | 72.5 | 3.9 |
| LN-20 | N-Me-imidazole | 0.2 | 52.1 | 1.1 |
| LN-25 | N-Me-imidazole | 0.2 | 23.9 | 1.0 |
| LN-29 | N-Me-imidazole | 0.3 | 53.0 | 0.8 |
| PB-17 | 2-Pyridyl | 0.2 | 50.1 | 0.15 |
| PB-26 | 2-Pyridyl | 2.3 | 12.1 | 9.8 |
| PB-27 | 2-Pyridyl | 1.6 | 73.3 | 5.7 |
| PB-37 | 2-Pyridyl | 8.0 | 67.1 | 15 |
| PB-43 | 2-Pyridyl | 12.4 | 45.5 | 13.6 |
| Propranolol | Standard | 28.9 | 83.4 | Well absorbed |
| Ranitidine | Standard | 0.3 | 5.6 | Not well absorbed |
| Vinblastine | Standard | 0.1 | 41.9 | Not well absorbed |
Some of the compounds with a 2-pyridyl R1 group had improved Caco-2 cell A-B permeability and reduced B-A permeability; these compounds had improved plasma levels (Table 1). Thus, it seems likely that THQ PFTIs with the 2-pyridyl R1 group are less avidly pumped from B to A than the N-Me-imidazole R1 group, favoring better intestinal absorption for the 2-pyridyl R1 THQs.
A wide screen of variations of R1 failed to yield a substituent that retained potency against PFT and P. falciparum cells except for 2-pyridyl and N-Me-imidazole (1a). An example of how sensitive the R1 substituent is to small changes that lead to a loss of potency is given in Fig. 3. Even substitution of a 3-pyridyl or a 4-pyridyl at the R1 position led to the dramatic loss of inhibitory activity against PfPFT and against P. falciparum growth. Thus, we continued with the 2-pyridyl group for further optimization of PK/ADME properties.
FIG. 3.

Substitution of the 2-pyridyl R1 group with either 3-pyridyl or 4-pyridyl leads to a dramatic loss in potency against PFT (IC50) and P. falciparum parasites (ED50). The structures of three THQ PFTIs demonstrating the effect of varying the R1 pyridyl group on the enzyme activity (IC50) and the anti-P. falciparum growth activity (ED50) are shown.
In vitro liver microsome metabolism correlates with in vivo metabolism and the clearance of THQ PFTIs. In general, THQ PFTIs were found to have relatively short half-lives in plasma after either oral or i.v. administration. We did not perform many i.v. administrations of the compounds because of our ultimate goal of obtaining an orally active compound. Instead, we obtained data for multiple compounds administered orally by gastric lavage to mice and rats (Table 2). The same compounds were studied to determine the rate of elimination by liver microsomes in vitro (Table 2). Only one compound, that is, BS-03, which has a phenyl group instead of a cyano group at R4, had a significantly reduced metabolism in mouse and rat microsomes. BS-03 also had a significantly reduced clearance rate in mice and rats after oral dosing (oral clearance rate) compared with the rates for the other compounds, which all had rapid metabolism by microsomes. The oral clearance rate is an imperfect measurement of clearance because it is also dependent on the rate of absorption in the gastrointestinal tract. Nonetheless, the data show that the in vitro microsome metabolism rate correlates with the clearance rate of the compounds in vivo. This suggests that in vitro the liver microsome metabolism rate is a reasonable surrogate marker for clearance rate in vivo.
TABLE 2.
Comparison of microsome metabolism rate and exposure after oral administration of 50 mg/kg in mice and ratsa
| Compound | Mice
|
Rats
|
||||||
|---|---|---|---|---|---|---|---|---|
| Microsome metabolism rate (t1/2b [min]) | AUC (μM · min) | Cmax (μM) | Oral elimination t1/2c (min) | Microsome metabolism rate (t1/2 [min]) | AUC (μM · min) | Cmax (μM) | Oral elimination t1/2 (min) | |
| LN-16 | 3.4 | 273 | 3.9 | 30 | 16 | 325 | 3.4 | 26 |
| PB-43 | 4.9 | 957 | 13.5 | 40 | 10.4 | 696 | 5.4 | 62 |
| PB-93 | 5.8 | 221 | 4.2 | 18 | 14 | 1320 | 7.6 | 53 |
| PB-102 | 5.1 | 280 | 5.4 | 27 | 18 | 2026 | 8.4 | 62 |
| BS-03 | 98 | 942 | 5.0 | 88 | 165 | 810 | 4.1 | 106 |
The values are the means for three animals.
t1/2, half-life.
This is not the true half-life of elimination of a compound, which is classically obtained by i.v. administration. The oral elimination rate is affected by the rate of absorption.
Further support for this hypothesis comes from comparison of metabolites that develop in vitro in liver microsomes and in vivo in rodent plasma. With four compounds, we were able to identify metabolites by LC/MS studies of supernatants after in vitro rat and mouse microsome metabolism and in the plasma from mice and rats dosed orally (Table 3). In some cases, additional dehydrogenation of the primary metabolite occurred in vivo but not in vitro. In one case, LN-16 in rats, the primary metabolite identified in vitro (the —R3 group) was different from the metabolite seen in plasma (+2O). However, in almost every case, the major metabolite identified in vivo was also seen after in vitro microsome metabolism, supporting in vitro liver microsome metabolism as a surrogate for in vivo metabolism.
TABLE 3.
Metabolic products detected from THQ compounds in vitro and in vivo
| Compound | Metabolic product(s) detected in:
|
|||
|---|---|---|---|---|
| Mouse microsomes | Mouse plasma after oral gavage | Rat microsomes | Rat plasma after oral gavage | |
| LN-16 | −R3 | −R3, −R3 +O, −R3 + 2O | −R3 | +2O |
| PB-37 | +O, −R2 and −R3 | +O, −R2 and −R3-4H, −R3 | +O, −R2 and −R3 | −R2 and −R3-4H |
| PB-43 | +O | +O, −R2 and −R3-4H | +O | +O, −R2 and −R3-4H |
| PB-54 | −R2 and R3 | −R2 and −R3-4H, −R3, +O | −R2 and −R3 | −R2 and R3-4H, −(COO-t-butyl) +O, −R3, +O |
The bile duct-cannulated rat model confirms that THQ PFTIs are metabolized in the liver.
To further establish their ADME characteristics, two radiolabeled THQ PFTIs were dosed orally to rats whose bile ducts were cannulated. PB-43 and PB-54 were selected for these studies because they gave measurable plasma levels after oral dosing of mice and rats. These compounds were labeled at R4 with 14CN—, as it seemed unlikely that the cyano R4 moiety would be cleaved from the THQ ring and exchange of 6-Br on the THQ ring with 14CN could be carried out in the last synthetic step. After oral gavage, the rats were monitored for 18 h and their urine and feces were collected, and after autopsy, the level of recovery of the radiolabel was tallied, as shown in Table 4. No adverse reactions were noted, and the rats appeared to be healthy throughout the dosing of the compound. Less than 5% of the radioactivity was recovered in urine, suggesting that urinary excretion was not likely a major mode of elimination for THQs. The majority of label was recovered in the feces and gastrointestinal tract, suggesting that much of the THQ either was not absorbed or was excreted by the gastrointestinal tract. At least 25% of each compound was absorbed, given the quantity of radioactivity recovered in bile (Table 4). Excretion was rapid, in that 80% of the radioactivity excreted in the bile during the 18-h observation period was excreted in the first 6 h. Blood levels of 1 to 3 μg/ml of radiolabeled compound were obtained for each compound (Table 5). The sizeable proportion of the label that appeared in bile during the 18 h suggests that much of the absorbed THQ is metabolized by the liver and is excreted into the bile (Table 4).
TABLE 4.
Recovery of radioactivity in BDC Rats after oral administration of [14C]PB-43 or [14C]PB-54
| Matrix | Mean % of administered dose
|
|
|---|---|---|
| PB-43 group | PB-54 group | |
| Bile | 27.1 | 26.2 |
| Urine | 1.6 | 4.3 |
| Feces | 33.7 | 26.7 |
| Gastrointestinal tract with contents | 40.3 | 18.2 |
| Tissues/carcass | NMa | 9.7 |
| Cage wash | 0.7 | 7.1 |
| Total | 104 | 92.2 |
NM, not measurable (below detection limit).
TABLE 5.
Concentration of PB-43 or PB-54 in plasma and blood cells of rats
| Time point (h) | Mean μg base equivalents/g sample
|
|||
|---|---|---|---|---|
| PB-43 group
|
PB-54 group
|
|||
| Plasma | Blood cells | Plasma | Blood cells | |
| 0.5 | 1.38 | 0.566 | 1.50 | 0.442 |
| 1 | 1.36 | 0.493 | 2.01 | 0.909 |
| 2 | 0.723 | 0.344 | 2.14 | 1.030 |
| 3 | 0.237 | 0.221 | 2.20 | 0.821 |
| 4 | NMa | 0.073 | 1.92 | 0.729 |
| 6 | NM | 0.063 | 1.23 | 0.623 |
| 18 | 0.351 | 0.243 | 0.340 | 0.344 |
NM, not measurable (below detection limit).
The bile was subjected to LC, and each peak was analyzed by LC-MS/MS. PB-43 was found to be oxidized at multiple places throughout the molecule and secondary glucuronidation was also observed (see Figure SA2 in the supplemental material). Most of the metabolites of PB-54 were due to oxidation of the tert-butyl group and often with secondary metabolism at the tert-butyl group (see Figure SA3 in the supplemental material). Thus, for these two compounds, the oxidation likely carried out by cytochrome P450 enzymes was responsible for the rapid clearance.
PB-54 analogs yield PB-93 with increased efficacy.
Since the metabolism of PB-54 occurred primarily on the tert-butyl (R5) group and PB-43 was metabolized at many sites in the molecule, we elected to study additional analogs of PB-54. Thirty-five PB-54 analogs with groups at R5 that resulted in carbamates, amides, ureas, and sulfonamides were synthesized. These 35 analogs were tested for PfPFT inhibition (IC50), anti-P. falciparum growth activity (ED50), and Caco-2 cell permeability (Table 6). Some of these were administered orally to rats, and the plasma levels (the peak concentrations [Cmaxs]) and exposure (AUC) of the compounds were obtained (Table 6). The only class that retained Caco-2 cell permeability and reasonable exposure in animals was the carbamate class of compounds. Thus, we focused on improving the carbamate analogs further.
Reducing the tert-butyl to isopropyl and ethyl and methyl substituents led to a progressive and 10-fold improvement in antiparasitic activity (ED50) and a moderate improvement of the activity against PfPFT (IC50) (Table 7). The Caco-2 cell permeability also decreased throughout this series, and there was a concordant decrease in the exposure (AUC) to the compounds (Table 7) by moving from a tert-butyl to a methyl substituent. Exposure (AUC) was greater in rats than in mice, and this correlated with the more rapid metabolism of these compounds by mouse liver microsomes compared with that by rat liver microsomes. However, we were unable to identify the metabolites of unlabeled PB-93 after liver microsome metabolism in vitro or in the plasma of rats and mice dosed orally with PB-93.
TABLE 7.
Properties of THQ carbamates
 | |||||||||||||
|---|---|---|---|---|---|---|---|---|---|---|---|---|---|
| Carbamate | IC50 (nM) for PfPFT enzyme | ED50 (nM) for cell growth
|
Rat liver microsome t1/2a (min) | Caco-2 cell permeability from A to B (10−6 cm/s) | Calculated oral bioavailability (% [based on oral AUC/ i.v. AUC]) | Exposure (AUC [μM · min] after oral administration of 50 mg/kg) in:
|
Cmax (μM) in rat plasma after oral administration of 50 mg/kg | Oral elimination t1/2 (min) in:
|
Exposure in rats (AUC [μM · min] after i.v. administration of 2 mg/kg | i.v. elimination t1/2 (min) in rats | |||
| P. falciparum 3D7 (chloroquine susceptible) | P. falciparum K1 (chloroquine resistant) | Mice | Rats | Rats | Mice | ||||||||
| PB-54 | 1.5 | 155 | 180 | 10 | 15.5 | 124b | 710 | 1,806 | 6.3 | 151 | 54 | 58 | 55 |
| PB-102 | 0.7 | 62 | 62 | 18 | 7.5 | NDc | 280 | 2,025 | 8.4 | 62 | 26 | ND | ND |
| PB-104 | 0.6 | 55 | 40 | 12 | 2.6 | ND | ND | ND | ND | ND | ND | ND | ND |
| PB-93 | 0.58 | 16 | 15 | 14 | 1.1 | 82 | 221 | 653 | 4.5 | 41 | 18 | 32 | 17 |
t1/2, half-life.
The oral bioavailability calculation is flawed, perhaps because of nonlinearity in the oral versus the i.v. dosing; e.g., the high oral dose may have saturated metabolic processes that operated much more quickly with the smaller i.v. dose. Other dose-related processes that could have caused nonlinearity include protein binding and transport processes. The radiolabeled study with PB-54 in bile duct-cannulated rats suggested that about 40% of the dose was absorbed (total for bile, carcass, and urine) and that 60% was found in the feces, the gastrointestinal tract, and cage wash, suggesting an approximately 40% oral bioavailability (Table 4).
ND, not determined.
The exposure of PB-93 after oral administration to rats is shown in Fig. 4. By 8 h after administration, the amount of PB-93 had fallen to barely detectable levels. Thus, it seemed likely that PB-93 needed to be dosed at least every 8 h to show efficacy.
FIG. 4.

Plasma exposure after oral dosing with PB-93. The mean levels in the plasma of three rats (in micromolar) with the standard errors of the means at various time points after oral gavage with 50 mg/kg of PB-93 are shown.
PB-93 shows efficacy in the rat-P. berghei model of infection.
Rats instead of mice were chosen for a therapeutic trial of oral PB-93 because the exposure in rats was much more than that in mice (Table 7). Rats were infected with P. berghei, parasitemia was established for about 2% of erythrocytes, and then the rats were treated with PB-93 at 50 mg per kg every 8 h for 3 days. By day 2 of therapy no parasites were demonstrable in the PB-93-treated group, but the level of parasitemia persisted at 1.4% in the untreated controls (Fig. 5). Although the level of parasitemia decreased slightly in the controls treated with vehicle only, the level of parasitemia remained significantly elevated compared with that in PB-93-treated rats, which remained parasite free on days 3 and 4. A few recrudescent parasites were detected in one of five treated rats on days 5, 7, and 14; but all the untreated rats remained parasitemic for the entire 2-week observation period. This experiment was also carried out with oral dosing every 12 h. Although an initial reduction in the level of parasitemia was observed in rats dosed every 12 h, once therapy was stopped, there was a recrudescent parasitemia to higher levels than that in control rats (data not shown). Thus, PB-93 shows promise for use for the oral therapy of rats in the P. berghei model, even with only 3 days of therapy, but constant exposure to the THQ PFTIs during this time period is required to achieve a cure.
FIG. 5.

Efficacy study with PB-93 in P. berghei-infected rats. The mean parasitemia (as the percentage of red blood cells parasitized) for five rats and the standard errors of the means are shown. The times on the x axis are in days, and day 0 is the start of treatment. Rats were infected with P. berghei 6 days prior to day 0. Treatment was with 50 mg/kg PB-93 by oral gavage every 8 h or with vehicle only by oral gavage every 8 h for a total of 72 h on days 0 to 3, as shown.
Metabolism of PB-93 leads to dealkylation of the N-Me-imidazole-CH2 R3 group, leading to an inactive PFTI.
With unlabeled PB-93, no metabolites could be detected by LC/MS after liver microsome metabolism or in the plasma of rats or mice. To better define the metabolites of PB-93, we labeled the CN at R4 with trace 14C or with a 50:50 mixture of unlabeled CN and CN doubly labeled with 13C and 15N. This allowed us to monitor the progressive metabolism of PB-93 by separation using LC, followed by scintillation counting of chromatography fractions. The radiolabeled peaks could be then studied by MS by looking for split heavy-light metabolites that differed in mass by 2 Da. Figure 6 demonstrates that as the parent molecule is metabolized during 10 to 30 min of exposure to liver microsomes; there is a progressive accumulation of a peak that elutes slightly later. The analysis of this peak by MS is shown in the inset in Fig. 6. There is a 2-Da split peak at 470 and 472 Da that corresponds to the native and heavy atom versions of PB-93 without the R3 N-Me-imidazole-CH2 (−R3). This −R3 metabolite has a very low ionization efficiency compared with that of the parent molecule and was impossible to demonstrate without the heavy atom labeling. Thus, the majority of the metabolism of PB-93 dealkylates the R3 N-Me-imidazole-CH2 group.
FIG. 6.

PB-93 cyano derivatives labeled with 14C and with 13C and 15N and their —R3 metabolites in liver microsome studies. The upper left diagram shows PB-93 and the R3 and R5 groups of the structure. The graph below shows the radiochromatogram of 14C-labeled PB-93 standard (STD) and 14C-labeled PB-93 metabolized by rat liver microsomes for 10 and 30 min. PB-93 consisted of a 50:50 mixture of an unlabeled CN group and a CN group doubly labeled with 13C and 15N, such that the metabolites could be identified by a 2-Da split peak. By 30 min, the major radioactive peak elutes later than the PB-93 standard. MS of this major metabolite peak (inset) reveals split peaks with a mass difference of 2 Da at 470.3 and 472.2 Da. These masses correspond to PB-93 minus the R3 N-Me-imidazole-CH2 heavy and light versions. Several other metabolites that had 2-Da split peaks are identified (see, e.g., +0 and —R3-R5 on the chart) but are minor radiotraces compared to the —R3 peak.
Structure of rat PFT liganded with PB-93.
We determined the X-ray crystal structure of the PB-93-rat PFT complex to 2.23 Å, and although the density for the stereochemistry was ambiguous, the density of PB-93 allowed us to clearly assign the binding of the compound. On the basis of these coordinates, the structure of PfPFT was modeled with PB-93 and is shown in Fig. 7. In both PfPFT and rat PFT, there is a large hydrophilic pocket which the carbamate R2 moiety fills. R2 essentially resides in the a2X part of the CaaX box binding site of the protein. This large pocket explains the wide tolerance of diversity in R2s of effective THQ PFTIs (see THQ PFTIs from this paper and from the work of Bendale et al. [1a]). The carbonyl group of the R2 carbamate hydrogen bonds with the side chain of a serine (position 99β in rat PFT, position 449β in PfPFT), while the piperidine ring interacts with a Trp (position 102β in rat PFT, position 452β in PfPFT). The R1 2-pyridyl group folds back and stacks against the hydrophobic farnesyl chain, and the nitrogen of the 2-pyridyl group hydrogen bonds with the phenol of Tyr (position 361β in rat PFT, position 837β in PfPFT). This hydrogen bond explains the selectivity for the 2-pyridyl group versus that for 3- and 4-pyridyl groups at R1; the nitrogen of 4-pyridyl would be completely desolvated without compensation (Fig. 3). The R3 N-Me-imidazole interacts with the Zn group of the enzymatic pocket. The cyano R4 group extends into a relatively hydrophobic pocket. From this model, it is clear that changes in the central core that could stabilize the R3 group of PB-93 are allowed.
FIG. 7.

Modeled structure of PfPFT with PB-93. Two representations of the PfPFT protein are shown (left, stick model; right, surface model) with the bound PB-93 structure (center small molecule in the center of both panels). The models are based on the X-ray crystal structure of the rat PFT with PB-93; many of the active-site residues of the rat PFT and the PfPFT are conserved. The R3 N-Me-imidazole group complexes with the zinc ion (green sphere). The R1 2-pyridyl group packs against the farnesyl group, and the 2-nitrogen group hydrogen bonds to a Tyr phenol. The R3 group is located in a large space, which explains why diverse R3 groups are allowed; but specific interactions occur here, too, such as the hydrogen bonding of the carbonyl group of the R2 carbamate. The cyano R4 group fits into a pocket that is obvious from the surface model.
Lack of toxicity with THQ PFTIs.
Throughout this work, rats and mice were dosed with THQ PFTIs, and some doses led to substantial exposures (Tables1 to 4 and 6; Fig. 4). Adverse reactions were not observed with any of the compounds, and the rodents appeared to be healthy throughout our dosing studies. In addition, rats dosed with PB-93 at 50 mg/kg every 8 h or every 12 h (n = 3 in each group) for 72 h did not develop abnormalities in complete blood counts, white blood cell differentials, electrolyte levels, glucose levels, renal functions, liver enzyme levels, or cholesterol levels. PB-93 tested negative for mutatgenesis in the two mutant/microsome-activated Ames assays for the prediction of genotoxicity. Ten micromolar concentrations of PB-93 were tested against a panel of 50 receptors associated with pharmacological effects and were negative for binding to the 47 receptors tested. Significant binding was only observed for the V1a vasopressin receptor (81% inhibition at 10 μM), the M1 muscarinic receptor (64%), and the M2 muscarinic receptor (77%). These results indicate only a minimal potential for off-target effects with either series. Thus, the THQ PFTIs appeared to be nontoxic in rodent models during short-term exposure and in in vitro models of toxicity.
DISCUSSION
An optimal antimalarial for the developing world should achieve a cure in 3 days or less with once- or twice-a-day oral dosing (17). We tested previously reported PFTIs and found that only the THQ PFTIs discovered at Bristol-Myers Squibb (14) have promising anti-P. falciparum activities (16) (data not shown). However, further development of THQ PFTIs as antimalarials was hindered by poor oral absorption and rapid clearance. In this paper, we describe our progress toward understanding and overcoming the pharmacokinetic liabilities of the first group of THQ PFTIs under study as antimalarials.
The THQ PFTIs that we have found to be the most effective against the parasite and against PfPFT have an N-Me-imidazole group in the R1 position (Fig. 2) (1a). In order to help predict the ability of these THQ PFTIs to be absorbed though the gastrointestinal tract, we used the well-established Caco-2 in vitro cell permeability model. Unfortunately, the THQ compounds with N-Me-imidazole at R1 were more permeable in Caco-2 cells in the B-to-A direction than in the A-to-B direction (Table 1), suggesting they would not be well absorbed orally due to efflux. In our hands, the B-A values were higher for every compound tested, even the very permeable propranolol control compound. However, the ratio of B-A versus that of A-B was very high when compounds contained the N-Me-imidazole group at R1 and was similar to that of vinblastine, a control drug that is known to be pumped from the B to the A side by P-glycoprotein (10, 24). Many compounds with the second most efficacious R1 group, 2-pyridyl, overcame this difference in B-A versus A-B permeability (Table 1). Of note, the A-B permeability correlates with peak plasma levels (Fig. 1). Taken together, these results suggest that the THQ compounds with N-Me-imidazole at R1 are pumped from the B to the A side of Caco-2 cells. This probably also occurs in the intestine, explaining the low plasma levels of the THQs with N-Me-imidazole at R1. This pumping maybe carried out by P-glycoprotein transporters, which are well-described B-A drug pumps in intestinal epithelial and Caco-2 cells (10, 24). By testing compounds with different R1 substituents, we were unable to find THQs, other than those with 2-pyridyl at R1, that retained favorable A-B Caco cell permeability with sufficient anti-P. falciparum activity (1a). Thus, we focused on THQs with 2-pyridyl at R1 for further study.
The other major issue with THQs was their rapid clearance from the circulation. Three lines of evidence, presented in this report, suggest that this clearance is due to cytochrome P450 metabolism, probably in the gut and/or the liver (13, 25). First, the metabolism rates in the liver microsomes correlated with clearance after oral dosing (Table 2). The only THQ compound (compound BS-03) with significant stability to liver microsome metabolism also had significantly longer clearance times in rats and mice. Second, the metabolites detected in the in vitro liver microsome metabolism of THQ PFTIs correlated closely with those observed in the plasma of orally dosed mice and rats (Table 3). Third, the metabolites of the labeled THQs administered orally to rats are rapidly excreted in the bile (Table 4; see Figures SA2 and SA3 in the supplemental material). The observed THQ metabolites are the result of well-known oxidoreductive and dealkylation transformations carried out by cytochrome P450 metabolism enzymes (Table 4; see Figures SA2 and SA3 in the supplemental material). Several THQs with N-Me-imidazole at R1 are potent binders of human cytochrome P450 3A4 (data not shown); however, we have not explored this further with the series of compounds with 2-pyridyl at R1. We have not determined if the binding of these THQ PFTIs to the 3A4 enzyme is accompanied by the metabolism of the compounds or whether they are competitive inhibitors of 3A4. Given the dominance of cytochrome P450 3A4 in human drug metabolism, it seems likely that to improve the exposure of THQs after oral dosing, additional stabilization of the THQs is necessary for effective antimalarial therapy.
We found two leads (compounds PB-43 and PB-54) that had improved oral exposure and that were metabolized significantly in vitro and in vivo. PB-43 was oxidized on multiple substituents, and PB-54 was primarily oxidized at the R2 tert-butyl group (see Figures SA2 and SA3 in the supplemental material). The oxidation of the PB-54 R2 group was greatly reduced by conversion of the tert-butyl group (compound PB-54) to a methyl group (compound PB-93). Compound PB-93 had the additional advantage of a 3-fold improvement in enzyme activity and a 10-fold improvement in cellular activity (Table 7). Despite the absence of detectable metabolites from PB-93, the half-life of liver microsome metabolism was increased by only 40% and the elimination time was actually reduced compared with that for PB-54 (Table 7).
To detect metabolites for compound PB-93, it was necessary to use a radiolabeled tracer and heavy atom-labeled PB-93 in liver microsome assays. These assays demonstrated that removal by dealkylation of the R3 N-Me-imidazole-CH2 group generated the major metabolite of PB-93. This metabolite has a substantial reduction in ionization efficiency by MS compared with that of parent compound PB-93, making it very difficult to detect it by the use of unlabeled compound. Indeed, it seems likely that R3 dealkylation of THQ PFTIs would have been more generally observed, but these metabolites are not readily apparent due to poor ionization in the MS instrument. These metabolites are predicted to be devoid of activity against PfPFT, as the R3 N-Me-imidazole is a direct ligand for the Zn2+ in the active site of PFT (Fig. 7). We have made a series of THQs with other potential R3 Zn-binding moieties, and all have >100-fold reduced potencies against PFT and the parasites compared with that of compounds with N-Me-imidazole at R3. Thus, it seems unlikely that we can get significant inhibition of PFT by THQs without the R3 N-Me-imidazole. We have now begun to synthesize a novel series of compounds to help reduce the R3 N-Me-imidazole-CH2 dealkylation.
The potent activity of PB-93 against plasmodial cells allowed us to show the oral efficacies of THQ PFTIs. The administration if 50 mg/kg of PB-93 orally every 8 h for 3 days cleared P. berghei parasites from rats after an infection had been established. It was necessary to use the rat model of malaria rather than the mouse model due to the rapid clearance of PB-93 and other THQs in mice compared with in rats. The rat model has limitations, in that the level of parasitemia remains low after infection. In this case, all rats in the control group had persistent parasitemia throughout the therapeutic trial and PB-93-treated rats cleared their parasitemia after 2 days of therapy. Although these are encouraging results, we believe that we need to identify compounds with further improved pharmacological properties to provide sustained blood levels at lower doses and to have a lower dosing frequency.
To date, no toxicity has been observed in rats or mice receiving short-term therapy with THQ PFTIs. Additionally, studies of plasma biochemical markers and blood cell levels after 3 days of oral PB-93 administration to rats showed no abnormalities. These observations suggest that 3-day therapy with THQ is not toxic in rodents. Pharmacological profiling of PB-93 has demonstrated that it has few receptor, ion channel, or transporter issues. An Ames screen of PB-93 with or without microsome transformation was negative for genotoxcity. The toxicities of the class of PFTI drugs for cancer chemotherapy include myelosuppression and gastrointestinal intolerance, but these toxicities generally occur only late during 21-day cycles of PFTI therapy and not at earlier times (1). All of this information taken together suggests that 3-day THQ PFTI antimalaria therapy will be tolerated well.
The binding coordinates of PB-93 with rat PFT and the model of PB-93 binding to PfPFT (Fig. 7) suggest that substantial changes in the central core of THQ that will retain PfPFT inhibition can be made. Thus, changes that are predicted to stabilize R3 dealkylation will be studied for enzyme inhibition, efficacy against parasites, Caco-2 cell A-to-B permeability, and liver microsome metabolism. We hope to find compounds with predicted improvements in oral exposure while retaining their antimalarial potencies. These in vitro predictors will allow us to rapidly prioritize THQ PFTIs for in vivo PK/ADME and efficacy experiments. We have defined both the pharmacodynamics of exposure necessary to achieve cure and the molecular details of the metabolism of THQ PFTIs. We can now rationally design and improve the THQ PFTIs to optimize the class for effective oral malaria therapy.
Supplementary Material
Acknowledgments
This work was supported by the W. M. Keck Foundation Center on Microbial Pathogens at the University of Washington, the Medicines for Malaria Venture (MMV), and National Institutes of Health grant AI054384 (to M.H.G.). O.H. was a fellow of the German Academy of Natural Scientists Leopoldina (BMBF-LPD 9901/8-77). The work of Aaron Riechers, ABC Inc., and CEREP is gratefully acknowledged.
We appreciate the helpful advice of Kenneth E. Thummel, University of Washington Department of Pharmaceutics; Alan E. Rettie, University of Washington Medicinal Chemistry; William N. Charman, Monash University Department of Pharmaceutics; Solomon Nwaka, formerly of MMV and currently of WHO/TDR; Ian Bathurst, MMV; J. Carl Craft, MMV; Win E. Gutteridge, MMV; Simon Campbell, MMV; and the entire MMV ESAC group.
Footnotes
Published ahead of print on 2 July 2007.
Supplemental material for this article may be found at http://aac.asm.org/.
REFERENCES
- 1.Basso, A. D., P. Kirschmeier, and W. R. Bishop. 2006. Lipid posttranslational modifications. Farnesyl transferase inhibitors. J. Lipid Res. 4715-31. [DOI] [PubMed] [Google Scholar]
- 1a.Bendale, P., S. Olepu, P. K. Suryadevara, V. Bulbule, K. Rivas, L. Nallan, B. Smart, K. Yokoyama, S. Ankala, P. R. Pendyala, D. Floyd, L. J. Lombardo, D. K. Williams, F. S. Buckner, D. Chakrabarti, C. Verlinde, W. C. Van Voorhis, and M. H. Gelb. Second generation tetrahydroquinoline-based protein farnesyltransferase inhibitors as anti-malarials. J. Med. Chem., in press. [DOI] [PMC free article] [PubMed]
- 2.Carrico, D., J. Ohkanda, H. Kendrick, K. Yokoyama, M. A. Blaskovich, C. J. Bucher, F. S. Buckner, W. C. Van Voorhis, D. Chakrabarti, S. L. Croft, M. H. Gelb, S. M. Sebti, and A. D. Hamilton. 2004. In vitro and in vivo antimalarial activity of peptidomimetic protein farnesyltransferase inhibitors with improved membrane permeability. Bioorg. Med. Chem. 126517-6526. [DOI] [PubMed] [Google Scholar]
- 3.Chakrabarti, D., T. Da Silva, J. Barger, S. Paquette, H. Patel, S. Patterson, and C. M. Allen. 2002. Protein farnesyltransferase and protein prenylation in Plasmodium falciparum. J. Biol. Chem. 27742066-42073. [DOI] [PubMed] [Google Scholar]
- 4.Eastman, R. T., F. S. Buckner, K. Yokoyama, M. H. Gelb, and W. C. Van Voorhis. 2006. Thematic review series: lipid posttranslational modifications. Fighting parasitic disease by blocking protein farnesylation. J. Lipid Res. 47233-240. [DOI] [PubMed] [Google Scholar]
- 5.Eastman, R. T., J. White, O. Hucke, K. Bauer, K. Yokoyama, L. Nallan, D. Chakrabarti, C. M. J. Verlinde, M. H. Gelb, and W. C. Van Voorhis. 2005. Resistance to a protein farnesyltransferase inhibitor in Plasmodium falciparum. J. Biol. Chem. 1013554-13559. [DOI] [PubMed] [Google Scholar]
- 6.Eastman, R. T., J. White, O. Hucke, K. Yokoyama, C. L. M. J. Verlinde, M. A. Hast, L. S. Beese, M. H. Gelb, P. K. Rathod, and W. C. Van Voorhis. 2007. Resistance mutations at the lipid substrate binding site of Plasmodium falciparum protein farnesyltransferase. Mol. Biochem. Parasitol. 15266-71. [DOI] [PMC free article] [PubMed] [Google Scholar]
- 7.Fucik, K., K. Kettler, J. Wiesner, R. Ortmann, D. Unterreitmeier, J. Krauss, F. Bracher, H. Jomaa, and M. Schlitzer. 2004. 2-(Arylpropionylamino)- and 2-(arylacryloylamino)benzophenones: farnesyltransferase inhibition and antimalarial activity. Pharmazie 59744-752. [PubMed] [Google Scholar]
- 8.Gelb, M. H., W. C. Van Voorhis, F. S. Buckner, K. Yokoyama, R. Eastman, E. P. Carpenter, C. Panethymitaki, K. A. Brown, and D. F. Smith. 2003. Protein farnesyl and N-myristoyl transferases: piggy-back medicinal chemistry targets for the development of antitrypanosomatid and antimalarial therapeutics. Mol. Biochem. Parasitol. 126155-163. [DOI] [PubMed] [Google Scholar]
- 9.Glenn, M. P., S. Y. Chang, C. Horney, K. Rivas, K. Yokoyama, E. E. Pusateri, S. Fletcher, C. G. Cummings, F. S. Buckner, P. R. Pendyala, D. Chakrabarti, S. M. Sebti, M. Gelb, W. C. Van Voorhis, and A. D. Hamilton. 2006. Structurally simple, potent, Plasmodium selective farnesyltransferase inhibitors that arrest the growth of malaria parasites. J. Med. Chem. 495710-5727. [DOI] [PMC free article] [PubMed] [Google Scholar]
- 10.Hunter, J., B. H. Hirst, and N. L. Simmons. 1993. Drug absorption limited by P-glycoprotein-mediated secretory drug transport in human intestinal epithelial Caco-2 cell layers. Pharm. Res. 10743-749. [DOI] [PubMed] [Google Scholar]
- 11.Kettler, K., J. Wiesner, K. Fucik, J. Sakowski, R. Ortmann, H. M. Dahse, H. Jomaa, and M. Schlitzer. 2005. 2-(Aminoacylamino)benzophenones: farnesyltransferase inhibition and antimalarial activity. Pharmazie 60677-682. [PubMed] [Google Scholar]
- 12.Kettler, K., J. Wiesner, K. Silber, P. Haebel, R. Ortmann, I. Sattler, H. M. Dahse, H. Jomaa, G. Klebe, and M. Schlitzer. 2005. Non-thiol farnesyltransferase inhibitors: N-(4-aminoacylamino-3-benzoylphenyl)-3-[5-(4-nitrophenyl)-2 furyl]acrylic acid amides and their antimalarial activity. Eur. J. Med. Chem. 4093-101. [DOI] [PubMed] [Google Scholar]
- 13.Kolars, J. C., P. Schmiedlin-Ren, J. D. Schuetz, C. Fang, and P. B. Watkins. 1992. Identification of rifampin-inducible P450IIIA4 (CYP3A4) in human small bowel enterocytes. J. Clin. Investig. 901871-1878. [DOI] [PMC free article] [PubMed] [Google Scholar]
- 14.Lombardo, L. J., Camuso, A., J. Clark, K. Fager, J. Gullo-Brown, J. T. Hunt, I. Inigo, D. Kan, B. Kolowitz, F. Lee, K. McGlinchey, L. Qian, C. Ricca, G. Rovnyak, S. Traeger, J. Tokarski, D. K. Williams, L. I. Wu, Y. Zhao, V. Manne, and R. S. Bhide. 2005. Design, synthesis and structure-activity relationships of tetrahydroquinoline-based farnesyltransferase inhibitors. Bioorg. Med. Chem. Lett. 151895-1899. [DOI] [PubMed] [Google Scholar]
- 15.Maron, D. M., and B. N. Ames. 1983. Revised methods for the Salmonella mutagenicity test. Mutat. Res. 113173-215. [DOI] [PubMed] [Google Scholar]
- 16.Nallan, L., K. D. Bauer, P. Bendale, K. Rivas, K. Yokoyama, C. P. Horney, P. R. Pendyala, D. Floyd, L. J. Lombardo, D. K. Williams, A. Hamilton, S. Sebti, W. T. Windsor, P. C. Weber, F. S. Buckner, D. Chakrabarti, M. H. Gelb, and W. C. Van Voorhis. 2005. Protein farnesyltransferase inhibitors exhibit potent antimalarial activity. J. Med. Chem. 483704-3713. [DOI] [PubMed] [Google Scholar]
- 17.Nwaka, S., and A. Hudson. 2006. Innovative lead discovery strategies for tropical diseases. Nat. Rev. Drug Discov. 5941-955. [DOI] [PubMed] [Google Scholar]
- 18.Olliaro, P. 2005. Drug resistance hampers our capacity to roll back malaria. Clin. Infect. Dis. 41(Suppl. 4)S247-S257. [DOI] [PubMed] [Google Scholar]
- 19.Ortmann, R., J. Wiesner, A. Reichenberg, D. Henschker, E. Beck, H. Jomaa, and M. Schlitzer. 2003. Acyloxyalkyl ester prodrugs of FR900098 with improved in vivo anti-malarial activity. Bioorg. Med. Chem. Lett. 132163-2166. [DOI] [PubMed] [Google Scholar]
- 20.Reichenberg, A., J. Wiesner, C. Weidemeyer, E. Dreiseidler, S. Sanderbrand, B. Altincicek, E. Beck, M. Schlitzer, and H. Jomaa. 2001. Diaryl ester prodrugs of FR900098 with improved in vivo antimalarial activity. Bioorg. Med. Chem. Lett. 11833-835. [DOI] [PubMed] [Google Scholar]
- 21.Snow, R. W., C. A. Guerra, A. M. Noor, H. Y. Myint, and S. I. Hay. 2005. The global distribution of clinical episodes of Plasmodium falciparum malaria. Nature 434214-217. [DOI] [PMC free article] [PubMed] [Google Scholar]
- 22.Strickland, C. L., P. C. Weber, W. T. Windsor, Z. Wu, H. V. Le, M. M. Albanese, C. S. Alvarez, D. Cesarz, J. del Rosario, J. Deskus, A. K. Mallams, F. G. Njoroge, J. J. Piwinski, S. Remiszewski, R. R. Rossman, A. G. Taveras, B. Vibulbhan, R. J. Doll, V. M. Girijavallabhan, and A. K. Ganguly. 1999. Tricyclic farnesyl protein transferase inhibitors: crystallographic and calorimetric studies of structure-activity relationships. J. Med. Chem. 422125-2135. [DOI] [PubMed] [Google Scholar]
- 23.Trager, W., and J. B. Jensen. 1976. Human malaria parasites in continuous culture. Science 193673-675. [DOI] [PubMed] [Google Scholar]
- 24.van Breemen, R. B., and Y. Li. 2005. Caco-2 cell permeability assays to measure drug absorption. Expert. Opin. Drug Metab. Toxicol. 1175-185. [DOI] [PubMed] [Google Scholar]
- 25.Watkins, P. B., S. A. Wrighton, E. G. Schuetz, D. T. Molowa, and P. S. Guzelian. 1987. Identification of glucocorticoid-inducible cytochromes P-450 in the intestinal mucosa of rats and man. J. Clin. Investig. 801029-1036. [DOI] [PMC free article] [PubMed] [Google Scholar]
- 26.WHO. 2005. WHO world malaria report. WHO, Geneva, Switzerland.
- 27.Wiesner, J., K. Fucik, K. Kettler, J. Sakowski, R. Ortmann, H. Jomaa, and M. Schlitzer. 2003. Structure-activity relationships of novel anti-malarial agents. Part 6. N-(4-arylpropionylamino-3-benzoylphenyl)-[5-(4-nitrophenyl)-2-furyl]acrylic acid amides. Bioorg. Med. Chem. Lett. 131539-1541. [DOI] [PubMed] [Google Scholar]
- 28.Wiesner, J., K. Kettler, J. Sakowski, R. Ortmann, A. M. Katzin, E. A. Kimura, K. Silber, G. Klebe, H. Jomaa, and M. Schlitzer. 2004. Farnesyltransferase inhibitors inhibit the growth of malaria parasites in vitro and in vivo. Angew. Chem. Int. Ed. Engl. 43251-254. [DOI] [PubMed] [Google Scholar]
- 29.Wiesner, J., A. Mitsch, M. Altenkamper, R. Ortmann, H. Jomaa, and M. Schlitzer. 2003. Structure-activity relationships of novel anti-malarial agents. Part 8. Effect of different central aryls in biarylacryloylaminobenzophenones on antimalarial activity. Pharmazie 58854-856. [PubMed] [Google Scholar]
- 30.Wiesner, J., R. Ortmann, H. Jomaa, and M. Schlitzer. 2003. New antimalarial drugs. Angew. Chem. Int. Ed. Engl. 425274-5293. [DOI] [PubMed] [Google Scholar]
- 31.Wiesner, J., R. Ortmann, A. Mitsch, P. Wissner, I. Sattler, H. Jomaa, and M. Schlitzer. 2003. Inhibitors of farnesyltransferase: 5-arylacryloylaminobenzophenones show antimalarial activity. Pharmazie 58289-290. [PubMed] [Google Scholar]
Associated Data
This section collects any data citations, data availability statements, or supplementary materials included in this article.