

Abstract
A microsphere-based immunoassay (MIA) was previously developed that is capable of determining the presence of anti-West Nile (WN) virus or anti-St. Louis encephalitis (SLE) virus immunoglobulin M (IgM) antibodies in human serum or cerebrospinal fluid. The original data set on which the classification rules were based comprised 491 serum specimens obtained from the serum bank at the Division of Vector-Borne Infectious Diseases of the Centers for Disease Control and Prevention (DVBID). The classification rules were used to provide a result and to determine whether confirmatory testing was necessary for a given sample. A validation study was coordinated between the DVBID and five state health laboratories to determine (i) the reproducibility of the test between different laboratories, (ii) the correlation between the IgM-enzyme-linked immunosorbent assay (MAC-ELISA) and the MIA, and (iii) whether the initial nonspecific parameters could be refined to reduce the volume of confirmatory testing. Laboratorians were trained in the method, and reagents and data analysis software developed at the DVBID were shipped to each validating laboratory. Validating laboratories performed tests on approximately 200 samples obtained from their individual states, the collections of which comprised approximately equal numbers of WN virus-positive and -negative samples, as determined by MAC-ELISA. In addition, 377 samples submitted to the DVBID for arbovirus testing were analyzed using the MIA and MAC-ELISA at the DVBID only. For the specimens tested at both the state and the DVBID laboratories, a correlation of results indicated that the technology is readily transferable between laboratories. The detection of IgM antibodies to WN virus was more consistent than detection of IgM antibodies to SLE virus. Some changes were made to the analysis software that resulted in an improved accuracy of diagnosis.
West Nile (WN) virus infections have gradually become widespread across the United States since the introduction of the virus in 1999 (2). A related flavivirus, St. Louis encephalitis (SLE) virus, is endemic in many parts of the country (16), and therefore WN and SLE viruses typically are tested for concurrently. Laboratory diagnosis is achieved via a menu of molecular and serologic tests that are used interchangeably, depending on the nature of the diagnostic specimen. The front-line serologic test employed by most state health departments and testing facilities is the immunoglobulin M (IgM)-enzyme-linked immunosorbent assay (MAC-ELISA) (12). This class of antibodies generally is produced during the first 8 days after the onset of symptoms in human arboviral infections (12). Many laboratories supplement the MAC-ELISA results with those from an IgG-ELISA (7). Cross-reactivity of antiflaviviral antibodies is a common phenomenon, and many times it is difficult to distinguish the infecting virus by using ELISA methodology alone (9). Plaque reduction neutralization tests (PRNTs) (10) are commonly used to clear up these ambiguities, but because PRNTs are time-consuming and technically challenging and require the use of live virus, PRNT is not used as a front-line method.
Serologic tests have been developed that utilize xMAP technology (Luminex Corp., Austin, TX) (21, 23). These tests generally use antigens that are covalently coupled to 5.6-μm-diameter polystyrene microspheres as a basis for the serologic reactions. We recently developed a duplex microsphere method that serves as an alternative to the WN virus and SLE virus MAC-ELISAs, having the advantages of being faster to perform and providing a more definitive answer regarding the infecting virus, as opposed to simply yielding two results. In the WN/SLE microsphere immunoassay (WN/SLE MIA) (8), sets of microspheres are covalently linked to a flavivirus group-reactive monoclonal antibody, and the sets are reacted with WN and SLE viral antigens. This has the advantage of not requiring purified antigens for attachment to the microspheres, and it lends itself to expansion for detection of other antiflaviviral antibodies. IgG is depleted from serum specimens by using protein G-Sepharose so that competition with IgM for binding to the antigen is reduced. Depleted serum and an anti-human IgM phycoerythrin conjugate are added concurrently to the reaction mixture and the mixture is incubated, and then the median fluorescent intensities (MFIs) are determined. A data transformation Excel (Microsoft Corp., Redmond, WA) add-in program was devised at the Division of Vector-Borne Infectious Diseases of the Centers for Disease Control and Prevention (DVBID) to allow the raw data to be analyzed, evaluated for quality, and classified as to the infecting virus, as well as for confirmatory testing to be recommended, if necessary. The original data set on which the WN/SLE MIA was based comprised 491 serum samples plus 81 cerebrospinal fluid (CSF) samples. From these data, classification parameters and preliminary cutoff values (to delineate antigen-specific from antigen-nonspecific reactions) were determined.
The validation of any assay should be performed to justify its routine use either as an adjunct or as a replacement for an existing test. Most laboratories will run old and new assays in parallel for a period of time to determine whether the new test produces results consistent with or superior to those of the old one. In addition, the use of tests developed in-house is regulated by the Clinical Laboratory Improvement Amendments (CLIA), section 493.1253(b,2) (20), which require that performance characteristics be established for new tests and that ongoing testing proficiency be verified. For the use of the WN/SLE MIA, it was preferable to validate the test both in-house and in conjunction with outside laboratories to determine both the consistency and transferability of the test. In addition, the components of the data transformation algorithm needed to be evaluated more critically and under a range of circumstances. The validation of the WN/SLE MIA is described.
MATERIALS AND METHODS
Specimens.
A total of 377 serum and CSF samples were obtained from the DVBID specimen archives (referred to henceforth as the DVBID in-house specimens). All were submitted in 2004. In addition, each of four state health laboratories obtained the following numbers of serum or CSF samples: state 1, 200; state 2, 198; state 3, 200; and state 4, 212. All state samples were split, and aliquots were shared with the DVBID. Among the samples from the four states' laboratories, previous test results showed that approximately 50% of the samples were from WN virus-infected patients. In 2005, a fifth state laboratory supplied the DVBID with 38 serum specimens that had previously tested positive for anti-SLE virus IgM.
Control sera.
Anti-WN virus IgM-positive and anti-SLE virus IgM-positive control human sera and pooled antibody-negative sera were obtained from the DVBID and were used by all participating laboratories.
Antigens.
WN virus recombinant antigen (4) and COS-1-negative antigen were supplied as gifts by Focus Diagnostics Inc. (Cypress, CA). These preparations were concentrated by using ultracentrifugation. Sucrose acetone-extracted suckling mouse brain SLE virus antigen and negative control antigen were prepared at the DVBID and were used by all participating laboratories.
MIA.
Prior to commencing the project, personnel from states 1 to 4 were trained at the DVBID in the WN/SLE MIA method. They subsequently tested a blind-coded comprehensive proficiency panel in their own laboratories. Once proficiency was verified, each laboratory undertook its portion of the validation study.
Each of the four participating laboratories performed MIAs on their respective samples, and the DVBID performed MIAs on each of the samples obtained from the states. The DVBID in-house specimens were tested by WN/SLE MIA at the DVBID only, as were the anti-SLE virus IgM-positive samples from the fifth state. The WN/SLE MIA was performed using the method previously described (8), with the exception that microsphere sets 32 and 57 were covalently coupled to flavivirus group-reactive monoclonal antibody 6B6C-1 by Radix Biosolutions, Inc. (Georgetown, TX), rather than being prepared in-house. All participating laboratories, therefore, were able to use the same coupled microspheres, thereby removing potential inconsistencies of bead-coupling efficiency between the laboratories. Prior to use, microsphere set 32 was bound to WN virus antigen at a rate of approximately 12.5 μg antigen per 2.5 × 10⁵ microspheres. The approximate concentration of antigen was determined by Focus Diagnostics via a comparative ELISA (W. Hogrefe, personal communication). An equivalent control was made using microsphere set 32 bound to a negative recombinant antigen. Microsphere set 57 was added to SLE virus suckling mouse brain antigen (concentration unknown) at a rate of 5 μl antigen to 0.25 million microspheres; the same was done for negative suckling mouse brain antigen. Positive and negative control sera were IgG depleted (1) using Mini Rapi-Sep units (PanBio, Baltimore, MD); test serum specimens were IgG depleted using bulk protein G-Sepharose (Amersham Biosciences, Uppsala, Sweden) as previously described (8). CSF samples were not depleted of IgG. Briefly, the assay method was as follows. Wells of 96-well filter plates (Millipore Corp., Billerica, MA) were wetted with MIA buffer (1% bovine serum albumin in phosphate-buffered saline; Sigma-Aldrich, St. Louis, MO) for 5 min and suctioned off using a vacuum manifold. To half the wells, 50 μl of each of the viral antigens attached to the 6B6C-1-coupled microspheres was added. To the other half, 50 μl of 6B6C-1-coupled microsphere sets bound to the negative antigens was added. The wells were washed twice with MIA buffer, and the underside of the plate was blotted to avoid capillary-action leakage from the wells. An anti-human IgM phycoerythrin conjugate (Jackson Immunoresearch, West Grove, PA) was prepared at 4 μg/ml in MIA buffer, and 50 μl was added to each well. All serum controls and test serum samples were made up to a final dilution of 1:400 in MIA buffer; CSF samples were diluted 1:5 in MIA buffer. Fifty microliters of diluted samples and controls was added to the wells, and each sample was reacted with both the virus-positive and -negative antigens. Controls were run in duplicate with a set placed both before and after the test specimens on virus-positive and -negative antigens. The contents of the wells were mixed, and the plate was shaken at 1,000 rpm for 1.5 h on a horizontal rotary shaker in the dark (to avoid bleaching the microspheres). After incubation, wells were washed twice, the underside of the plate was blotted, and 100 μl MIA buffer was added to each well. After the contents were mixed, the MFI of each microsphere set was quantified via the lasers on a BioPlex machine (Bio-Rad Laboratories, Hercules, CA), and raw data were transformed to give a result classification using an Excel add-in, called MIAClassify, written at the DVBID for the purpose.
MIAClassify Excel add-in.
Details of the prototype MIAClassify program were described previously (8). Briefly, the program was written to automate the classification of WN/SLE MIA results and incorporates the following steps. Data first are manipulated into the correct layout, and then, for each sample, the MFI of each viral antigen reaction is divided by the MFI of the corresponding negative antigen reaction to give an adjusted value (WN.Adj and SLE.Adj). The WN.Adj for the WN virus-positive control is divided by the SLE.Adj for the SLE virus-positive control to give a normalizing ratio. The sample SLE.Adj values are multiplied by this ratio to normalize the results according to the relative reactivities of the antigens. The adjusted, normalized results now are called WN.Adj and SLE.Adj2. These values are standardized to the historical values defined by the original regression line from control data that were obtained during the development of the test. This is achieved by dividing the adjusted values by the slope of the regression line. The log10 values of the standardized adjusted values for each antigen are obtained (designated W and S). For each specimen, W and S are used in quadratic discriminant analysis (QDA) (19) according to the mean vectors and covariances of the WN virus, SLE virus, and virus-negative (NEG) groups in the development data. For a formulaic and statistical explanation of the MIAClassify program, see the Appendix. The results are expressed as probabilities of being in the WN virus, SLE virus, or NEG group, with the greatest probability giving the raw classification. The quality of the raw classifications is checked on the basis of criteria that define nonspecificity and the proximity of probabilities of correct classification to give a final WN/SLE MIA interpretation. The infecting virus (classification) is that which gives the greatest final probability and has no characteristics that identify it as being nonspecific. These criteria that identify nonspecificity were examined using the validation data to determine whether changes to the prototype MIAClassify algorithm were necessary.
Comparative diagnostic tests.
WN virus and SLE virus MAC-ELISAs were performed on each sample either at the state health departments or at the DVBID, using either standard DVBID protocols (12) or commercially available WN virus IgM test kits (Focus Diagnostics, Inc.), which are based on a similar principle (6). MAC-ELISA results for states 1, 3, and 4 and the DVBID were interpreted as follows. The optical density (OD) at 450 nm of the specimen reacted with viral antigen divided by the OD of the antibody-negative control serum gives a positive-to-negative (P/N) ratio. P/N ratios of ≥3 were considered positive, P/N ratios of <2 were considered negative, and P/N ratios of ≥2.0 and <3.0 were considered equivocal. ELISA data for state 2 (which used the Focus Diagnostics kit) were interpreted as positive for an index of ≥1.1, where the index is the mean OD of the patient sample divided by the cutoff calibrator (negative serum) when both are reacted on viral antigen. PRNTs were performed as previously described (10), if sufficient volume was available, on samples for which an ambiguous result was obtained, samples for which the software identified a need for further examination, and for all SLE-positive samples (because of the small sample size in the original data set).
RESULTS
MIA data for specimens obtained from the state laboratories.
States 1 to 4 collectively provided 810 specimens for the MIA validation study. Each state laboratory tested its own specimens by MIA, and aliquots of the specimens from all four laboratories also were tested at the DVBID by MIA. The prototype MIAClassify Excel add-in program was applied to the data, generating four possible interpretations for each sample's test run: NEG, nonspecific, SLE virus, and WN virus. The comparative results from each state and those from the DVBID are detailed in Table 1. It should be noted that the table is particularly lacking in SLE virus data. For this reason, additional specimens later obtained from a fifth state were included in subsequent data but could not be included in Table 1, as the WN/SLE MIA results were generated at the DVBID but not at the state laboratory. The overall proportion of agreement across the four classifications, on the basis of a total of 810 specimens, was 90.9%, the greatest disparity being seen within the nonspecific group. The proportions of agreement for the NEG and WN virus groups were 95.3 and 91.2%, respectively.
TABLE 1.
Agreement of results obtained by WN/SLE MIA at laboratories of states 1 to 4 and at the DVBID laboratorya
| State | Classification assigned by state | No. of samples classified by DVBID as:
|
Total no. of samples | |||
|---|---|---|---|---|---|---|
| NEG | NS | SLE | WN | |||
| 1 | NEG | 124 | 1 | 0 | 1 | 126 |
| NS | 0 | 7 | 0 | 0 | 7 | |
| SLE | 0 | 0 | 0 | 0 | 2 | |
| WN | 1 | 1 | 0 | 63 | 65 | |
| Total | 125 | 9 | 2 | 64 | 200 | |
| 2 | NEG | 73 | 3 | 0 | 1 | 77 |
| NS | 7 | 4 | 1 | 3 | 15 | |
| SLE | 0 | 0 | 0 | 0 | 0 | |
| WN | 3 | 14 | 1 | 88 | 106 | |
| Total | 83 | 21 | 2 | 92 | 198 | |
| 3 | NEG | 128 | 2 | 0 | 1 | 131 |
| NS | 0 | 5 | 0 | 0 | 5 | |
| SLE | 0 | 0 | 1 | 0 | 1 | |
| WN | 6 | 0 | 1 | 56 | 63 | |
| Total | 134 | 7 | 2 | 57 | 200 | |
| 4 | NEG | 118 | 1 | 0 | 5 | 124 |
| NS | 7 | 3 | 0 | 3 | 13 | |
| SLE | 0 | 0 | 0 | 0 | 0 | |
| WN | 4 | 6 | 1 | 64 | 75 | |
| Total | 129 | 10 | 1 | 72 | 212 | |
| Allb | NEG | 443 | 7 | 0 | 8 | 458 |
| NS | 14 | 19 | 1 | 6 | 40 | |
| SLE | 0 | 0 | 3 | 0 | 3 | |
| WN | 14 | 21 | 3 | 271 | 309 | |
| Total | 471 | 47 | 7 | 285 | 810 | |
NS, nonspecific. Anti-SLE virus IgM and anti-WN virus IgM, respectively, were present in the samples classified as belonging to the SLE and WN groups.
Combined results indicating overall agreement.
In the WN/SLE duplex MIA, the WN virus antigen and its corresponding negative antigen were coupled with microsphere set 32, and the SLE virus antigen and its corresponding negative antigen were coupled with microsphere set 57. MFIs were generated by the BioPlex instrument for both sets of microspheres, and the MIAClassify program was used to process the raw MFI data. Intraclass correlation coefficients (ICCs) were computed for set 32 and for set 57 for each of states 1 to 4 as a means to compare the standardized, calibrated log10 values to those generated at the DVBID. Computed ICCs are listed in Table 2. ICCs ranged from 0.89 to 0.94 (95% confidence limits ranged from 0.85 to 0.95) for set 32 (WN virus antigen) and from 0.73 to 0.95 (95% confidence limits ranged from 0.68 to 0.96) for set 57 (SLE virus antigen). Notably, state 3 had a much higher correlation coefficient for set 57 than the other three states.
TABLE 2.
ICCs for microsphere sets 32 and 57 according to state
| State | No. of samples | ICC (95% CIa) for microsphere set:
|
|
|---|---|---|---|
| 32 (WN virus) | 57 (SLE virus) | ||
| 1 | 200 | 0.94 (0.92-0.95) | 0.75 (0.68-0.80) |
| 2 | 198 | 0.91 (0.89-0.93) | 0.85 (0.80-0.88) |
| 3 | 200 | 0.93 (0.91-0.95) | 0.95 (0.93-0.96) |
| 4 | 212 | 0.89 (0.85-0.91) | 0.73 (0.66-0.79) |
| Overall | 810 | 0.92 (0.91-0.93) | 0.83 (0.80-0.85) |
CI, confidence interval.
Comparison of WN/SLE MIA results to WN virus and SLE virus MAC-ELISA results for the DVBID in-house samples and for state samples analyzed at the DVBID.
WN/SLE MIA results from the DVBID in-house samples and from samples from states 1 to 4 that were tested at the DVBID, plus samples from the fifth submitting state laboratory, were compared to the WN virus and SLE virus MAC-ELISA results. ELISA results were classified according to the magnitude of their P/N ratios; in other words, if a sample was positive for IgM specific to both WN and SLE viruses, the result was classified according to the higher P/N ratio. It should be noted that while this approach works well for WN virus infections in most cases, it not always reliable for identifying SLE virus infections due to the higher degree of cross-reactivity of IgM antibodies mounted to SLE virus (11). Therefore, the performance of confirmatory PRNTs is the rule. The WN/SLE MIA results were classified using the prototype MIAClassify program, and the results are shown in Tables 3 and 4. For the state samples, proportions of agreement were 94% (negatives), 83% (anti-SLE virus IgM), and 92% (anti-WN virus IgM). For the DVBID in-house samples, proportions of agreement were 91% (negatives), 78% (anti-SLE virus IgM), and 91% (anti-WN virus IgM).
TABLE 3.
Prototype MIAClassify results compared to MAC-ELISA results for split samples from states 1 to 5 that were tested at the DVBIDa
| Prototype MIAClassify classification | No. of samples classified by MAC-ELISA as:
|
Total no. of samples | ||||
|---|---|---|---|---|---|---|
| NAb | Equivocal | NEG | SLE | WN | ||
| NEG | 7 | 432 | 9 | 20 | 471 | |
| NSc | 3 | 3 | 18 | 9 | 19 | 50 |
| SLE | 0 | 0 | 1 | 40 | 1 | 42 |
| WN | 9 | 12 | 17 | 6 | 241 | 285 |
| Total | 13 | 22 | 468 | 64 | 281 | 848 |
Anti-SLE virus IgM and anti-WN virus IgM, respectively, were present in the samples classified as belonging to the SLE and WN groups.
NA, data not available.
NS, nonspecific.
TABLE 4.
Prototype MIAClassify results compared to MAC-ELISA results for the DVBID in-house specimensa
| Prototype MIAClassify classification | No. of samples classified by MAC-ELISA as:
|
Total no. of specimens | |||||
|---|---|---|---|---|---|---|---|
| NEG | Equivocal | NSb | QNSc | SLE | WN | ||
| NEG | 143 | 18 | 7 | 1 | 10 | 9 | 188 |
| NS | 12 | 7 | 0 | 0 | 15 | 8 | 42 |
| SLE | 1 | 3 | 0 | 0 | 31 | 2 | 37 |
| WN | 9 | 10 | 0 | 0 | 4 | 125 | 148 |
| Total | 38 | 165 | 7 | 1 | 60 | 144 | 415 |
Anti-SLE virus IgM and anti-WN virus IgM, respectively, were present in the samples classified as belonging to the SLE and WN groups.
NS, nonspecific reactions on the negative antigens for WN virus and SLE virus that render MAC-ELISAs uninterpretable.
QNS, quantity not sufficient for testing.
Distributions of classifications.
Log10 W and log10 S values (the transformed but unclassified data for each microsphere set) produced by the prototype version of MIAClassify were plotted against each other for the specimens from states 1 to 4 that were tested at the DVBID (Fig. 1A) and for the DVBID in-house specimens plus state 5's samples (415 samples) (Fig. 1B). For purposes of comparison, a similar graph (Fig. 1C) was included from the original development data (8), on which the QDA classification lines also are plotted. Figures 1A and B show similar distributions, the classification groups being reasonably distinct from one another, but the data points are not as focused and obviously separated as they were in the original data set (Fig. 1C).
FIG. 1.


(A) Distributions of classifications of MIA results represented by plotting the log10W versus the log10S for each sample from states 1 to 4 that also was tested at the DVBID, as classified by the prototype MIAClassify Excel add-in. Neg, negative sample. (B) Distributions of classifications of MIA results represented by plotting the log10W versus the log10S for each sample for the DVBID samples plus samples from state 5, as classified by the prototype MIAClassify Excel add-in. (C) Distributions of classifications of MIA results represented by plotting the log10W versus the log10S for each sample for the 491 samples from the original data (for comparison to the distributions shown in panels A and B) (8), as classified by the prototype MIAClassify Excel add-in prior to nonspecific parameters being included. The line represents the classification rule, such that the antiviral IgM classifications by the QDA are as annotated. The symbols represent the true classification by PRNT (or MAC-ELISA for some negative samples).
Possible criterion changes for confirmatory testing.
Based on the results, the prototype MIAClassify Excel add-in program identified a proportion of samples for confirmatory PRNTs (8). These results comprised samples (i) that could not be differentiated on the basis of probabilities of correct classification, identified as having a probability difference of less than 0.8 between the highest and lowest of the three probabilities generated for the sample; (ii) for which the reactions of the specimens on the negative antigen were so high that the results could not be interpreted (nonspecifics, as defined in reference 8); and (iii) that were anti-SLE virus IgM positive due to the relatively small number of anti-SLE virus IgM-positive samples available for the original analysis). The confirmation of all anti-SLE virus IgM-positive samples was not reported in the original paper but was put into practice. The validation data were examined in order to determine whether the number of PRNTs requested could be reduced. The total number of samples in the validation that were analyzed at the DVBID (including samples from the states as well as in-house samples) was 1,225. Of these samples, using the prototype MIAClassify program, 83 were classified as nonspecific (6.8%). Of these, 51 samples had PRNT results available (the remainder were insufficient in volume for PRNT results to be generated). Of these 51 nonspecifics, 42 (82%) had raw MIA interpretations (i.e., prior to the refining criteria being applied) that agreed with confirmatory PRNTs. The breakdown of this was the following: of 32 anti-WN virus IgM raw interpretations, 29 were confirmed as correct by PRNT (91%); of 26 NEG raw interpretations, 12 were correct (46%); of 3 anti-SLE virus IgM raw interpretations, 1 was correct (33%). Therefore, the anti-WN virus IgM raw interpretations produced for nonspecific samples were the most likely to be correct, indicating that the criteria for identifying nonspecifics for this group might need to be adjusted to reduce the number of PRNTs. Of the samples that were recommended for confirmation by PRNT due to a maximum probability difference between groups of <80% but not classified as nonspecific, no discrepancies between the raw MIA interpretation and the confirmatory test results were seen above 61%.
Prototype MIAClassify versus updated MIAClassify.
Based on the observations discussed above, the following changes were made to the prototype MIAClassify program to yield the updated MIAClassify program. (i) The maximum probability difference for a specimen below which a PRNT was recommended to be performed was lowered from 0.8 to 0.7, because the highest probability seen for an incorrect result for this group was only 61%. (ii) The majority of nonspecific results for which the raw MIA interpretation agreed with the PRNT results was for WN virus IgM-positive samples, and the reason that these had final MIA interpretations of nonspecific was because the results for microsphere set 57 gave nonspecific results (anti-SLE virus IgM nonspecific). Therefore, the criterion in the prototype MIAClassify program that required an absolute log10 value of 1.5 for the anti-WN virus IgM result to be accepted without requesting a PRNT (which was quite stringent) was changed in the updated MIAClassify program to require that the anti-log10 value of the microsphere set 32 standardized result for any sample be ≥5 times that of the microsphere set 57 result, and it required that for anti-SLE virus IgM results the anti-log10 value of the microsphere set 57 standardized result for any sample be ≥5 times that of the microsphere set 32 result. This number was still quite conservative and was chosen on the basis of previously published data (13). (iii) Any MFI of <10 for a sample or a control was changed to 10, as values <10 can be attributed to noise (K. Oliver, personal communication). The nonspecific category was expanded in the updated version of MIAClassify to include both the original nonspecific definition and also the samples that had maximum probability differences of <70%. This change was made to simplify the reporting of results.
The sample set containing samples from the DVBID plus samples from state 5 (415 samples) was analyzed by the prototype and updated versions of MIAClassify (Table 5). Agreement across the groups was 390/415 (94%). For those samples with PRNT results available (a group of 204, with a relatively large proportion of nonspecifics; data not shown), the main differences seen were that the percentage of anti-SLE virus IgM-positive samples that were identified correctly (based on the PRNT result) rose from 56% with the prototype MIAClassify to 77% with the updated MIAClassify, and that the percentage of anti-WN virus IgM-positive samples that were identified correctly based on the PRNT result dropped from 76% with the prototype method to 71% with the new method. The data from the prototype and updated MIAClassify versions were compared in terms of correlation to final diagnosis on the basis of all the available laboratory data for the specimens, once any PRNTs that were recommended by the software had been performed. Twenty-five samples gave different results between the old and the new versions of software. Eleven involved a PRNT being added as a result of using the updated MIAClassify program. By using the prototype, seven samples would have been diagnosed incorrectly. By using the updated version, no samples were diagnosed incorrectly. Sample data processed using the prototype and updated MIAClassify versions were compared to ELISA results for the DVBID in-house samples. Proportions of agreement were calculated by removing samples that gave nonspecific (MIA) or equivocal (MAC-ELISA) results, because the characteristics of these samples do not equate between the methods. The prototype and updated versions of the software performed similarly (proportions of agreement, 91%) for the WN/SLE MIA data and the ELISA data, but an increase in agreement was seen in the SLE virus category using the updated software (78% to 82%), with the anti-WN virus IgM and NEG groups both giving constant proportions of agreement of 91%. The improvement in agreement with the updated version was barely reflected by the overall proportions of agreement because of the relatively small numbers of anti-SLE virus IgM-positive samples. A total of 24 samples from the DVBID in-house samples produced results that disagreed between MAC-ELISA and the MIA (but were not nonspecific) and that had PRNT results available. Fifteen of the samples had MIA results that agreed with PRNT results; nine had MAC-ELISA results that agreed with PRNT results, showing an overall improvement with the updated MIAClassify version.
TABLE 5.
Comparison of results obtained by the prototype and updated versions of MIAClassify for DVBID in-house specimens and state 5 specimensa
| Prototype MIAClassify classification | No. of specimens classified by updated version of MIAClassify as:
|
Total no. of specimens | |||
|---|---|---|---|---|---|
| NEG | NSb | SLE | WN | ||
| NEG | 187 | 1 | 0 | 0 | 188 |
| NS | 0 | 31 | 10 | 1 | 42 |
| SLE | 0 | 1 | 36 | 0 | 37 |
| WN | 0 | 10 | 1 | 137 | 148 |
| Total | 187 | 43 | 47 | 138 | 415 |
Anti-SLE virus IgM and anti-WN virus IgM, respectively, were present in the samples classified as belonging to the SLE and WN groups.
NS, nonspecific.
A significant change that was made to the MIAClassify program was the addition of quality control parameters. When data are transformed after reading a plate, the controls are automatically reviewed for adherence to the following criteria: the mean MFIs of the duplicate anti-WN virus IgM and anti-SLE virus IgM positive controls reacted with the viral antigen attached to 6B6C-1-coupled microsphere sets 32 and 57, respectively, must be ≥500; the mean MFIs of the negative controls run in quadruplicate with both viral antigens must be <100; and the ratio of the WN virus:SLE virus (adjusted)-positive control values must not be >3. These parameters were determined as a result of the validation (data not shown). Outside of these parameters, it was noted that borderline results especially tended to be classified erroneously.
Performance specifications of the WN/SLE MIA.
Laboratories using non-FDA-approved, modified FDA-approved, or in-house testing methods are required to document the performance specifications for the tests within the individual laboratories. Section 493.1253(b,2) of the CLIA regulations requires that the following criteria be established for the tests: (i) accuracy, (ii) precision, (iii) analytical sensitivity, (iv) analytical specificity to include interfering substances, (v) reportable range of test results, (vi) normal reference intervals, and (vii) any other performance characteristics required for test performance. The data from the study reported here and from the original report describing the method (8) were used to establish the performance characteristics for the WN/SLE MIA at the DVBID. The most up-to-date data available were used for each category, and the results are described here by criterion category number. (i) Tested over several months, the 377 samples from the DVBID showed that the WN/SLE MIA was 82.6% accurate compared to results from MAC-ELISA for anti-WN virus IgM positives, the number potentially being boosted to 91.7% after the performance of PRNTs for the nonspecific samples, which are identified as requiring raw interpretation verification (per the testing algorithm). For anti-SLE virus IgM the accuracy was 66.6%, potentially reaching 78.3% including PRNT results. It should be noted, though, that accuracy based upon a strict comparison with MAC-ELISA results is not optimal, because the MAC-ELISAs alone are not 100% accurate, especially considering equivocal results. As noted in the preceding section, the diagnostic algorithm that incorporates the WN/SLE MIA and the software-recommended PRNT (if applicable) proved 100% accurate compared to the interpretation of results based on all the diagnostic and clinical data available. (ii) Controls were tested in duplicate over a 6-month period on a frequent basis; the anti-WN virus and anti-SLE virus IgM-positive samples were tested in duplicate, and the negative samples were tested in quadruplicate. All gave correct results, and thus the precision over time for the controls was 100%. A sample set of 37 diagnostic specimens was tested once each on two different plates, and all gave identical results between the runs, making the run-to-run precision for the samples 100%. Forty samples were tested to determine within-plate precision, and this also was 100%. (iii) The analytical sensitivity cannot be determined for this test as stated in the CLIA manual, because it is not possible to determine the concentration of IgM specific to WN or SLE virus as opposed to total IgM in a reference specimen. (iv) Based on 154 negative MAC-ELISA results for IgM specific to WN virus and SLE virus, the specificity of the MIA was 96.1%. Based on small cohorts of samples from patients diagnosed with other diseases, no reduction in specificity was seen for specimens containing antibodies to LaCrosse encephalitis virus (12 sera), old flavivirus infections (10 sera), yellow fever vaccine recipients (16 sera), other non-dengue arboviruses (11 sera), antinuclear antibody (22 sera), or Lyme disease (20 sera). The following specificities also were found: the syphilis cohort (21 sera), 95%; rheumatoid factor (13 sera), 92%; dengue virus with a MAC-ELISA P/N ratio of >2 but ≤9 (15 sera), 93%; and dengue virus with a MAC-ELISA P/N ratio of >9 (18 sera), 50%. For the latter group, of the nine sera that did not test negative, one was classified as anti-WN virus IgM, three were classified as anti-SLE virus IgM, and five were classified as nonspecific. Therefore, samples containing very high titers of antibody to dengue viruses are likely to reduce the specificity of this test considerably. (v) Because the WN/SLE MIA is not a quantitative test, a linearity experiment was not performed. The highest MFI observed for these samples was approximately 10,000, and the lowest was 0. Positivity cutoffs are dependent on the plate controls and negative antigen control values for the samples, and therefore they are not constant. (vi) The reference range was an MFI of <100. (vii) For the criterion of other performance characteristics required for test performance, control values must be compliant with the quality control parameters described in the previous section.
DISCUSSION
For at least the past decade, MAC-ELISA has been the accepted first-round serologic method for diagnosis of arboviral disease in many laboratories, including the DVBID. It is relatively inexpensive, and since the introduction of WN virus into the United States, several companies have produced FDA-approved ELISA kits for detection of anti-WN virus IgM in human sera. At the state and reference laboratory level, it is common for multiple arbovirus ELISA to be performed on a specimen, in particular tests for anti-WN and anti-SLE viral IgM. Other arboviruses that are commonly tested for depend on the geographic origin of the specimen and also on the travel history of the patient. In addition to WN and SLE viruses, domestic arboviruses tested for in the United States include LaCrosse encephalitis, eastern equine encephalitis, western equine encephalitis, dengue, and Powassan viruses. The WN/SLE MIA was developed to provide a faster alternative to MAC-ELISA, with the potential of multiplexing to incorporate many of the medically important arboviruses.
A rigorous validation of the WN/SLE MIA was undertaken, because the method represents a significant departure from established arboviral testing methods. This validation of the MIA involved both internal and external specimens and data sources. It was important to determine whether test results could be reliably reproduced in different laboratories for the same specimens, how well the test stood up to the flow of ordinary sample receipt in the diagnostic setting, and whether any changes to the testing algorithm or methodology would be advisable as a result of the study.
A comparison of the DVBID data to those of the states showed that the WN/SLE MIA provided reproducible results. Overall proportions of agreement were >90% across the classifications. This can be thought of as a measure of specificity, although by definition specificity relates to two groups, whereas here we have four (NEG, nonspecific, anti-SLE virus IgM, and anti-WN virus IgM). The intraclass correlation provided a measure of agreement for the continuous-valued, transformed MFI data, for example, prior to the nonspecificity check and classification. These results indicated that the WN virus antigen values were less variable than the SLE antigen values, although a more even distribution of sample numbers may have shown otherwise. Furthermore, the success of correct classification for SLE virus IgM-positive samples was less than that for WN virus IgM-positive samples. This is probably due to the cross-reactive nature of IgM antibodies made in response to SLE virus infections, which have been shown to exhibit this phenomenon to a greater degree than IgM antibodies made to WN virus (11). The noticeably less variable microsphere set 57 results for state 3 may be attributable to the higher proportion of CSF samples in their sample set. Because no IgG depletion was necessary for the CSF samples, an experimental variable was removed.
Proportionately, slightly more of the WN/SLE MIA results agreed with the MAC-ELISA results for samples obtained from the state laboratories that were tested at the DVBID than among the DVBID in-house samples, possibly due to the nature of the specimens normally obtained at the DVBID for testing, which are frequently those that have produced confusing or inconclusive results upon initial testing at the state level. The in-house DVBID samples therefore may represent a collection biased in the direction of poorer performance and thus may underestimate performance in the routine, state-level application of the MIA.
The distributions of the classifications were plotted for the state specimens that were tested at the DVBID and for the DVBID in-house samples (Fig. 1A and B), and the two looked similar. By comparison, the distributions of the sample classifications for the original data (Fig. 1C) that came from specimens submitted to the DVBID primarily for result confirmation were more focused. The QDA method of classification fit the original sample set particularly well (represented by the wishbone line in Fig. 1C). The distributions of the validation data in Fig. 1A and B, the proportions of agreement, and ICC results all indicate that the QDA classification scheme certainly is acceptable for use with routine data acquisition and that it held up to use by different laboratories. However, more overlap of the groups is seen for the validation data, even on a qualitative level, than was seen in the original analysis. We are investigating alternative statistical classification methodologies to determine whether improvements can thereby be achieved for the kinds of samples seen in routine, nonreference laboratory applications. Because of this, the extensive task of recalculating the QDA operational parameters to incorporate the validation data was deferred.
The criteria for defining nonspecifics were particularly difficult to determine using the initial WN/SLE MIA data. There was a clear need for such a classification, because some samples exhibit phenomena such as reactions with negative antigens, yield probabilities that are too close to differentiate reliably, or MFIs that are too low. Serologically, results that are in fact products of secondary flaviviral infections can be particularly difficult to identify because of the cross-reactive nature of flaviviruses and the resulting anamnestic responses (15). Nonspecific parameters were chosen on the basis of the available numerical data and corresponding laboratory diagnoses for the samples. These chosen parameters nevertheless were limited by the original data set. A number of changes to the original nonspecific parameters and data management were made when the MIAClassify program was updated, as detailed in Results. Because some ambiguity was created by using the term “nonspecific” to encompass more than one type of result, the use of this term will be revisited when subsequent MIA tests are developed in this laboratory. The net effect of the software changes was to improve the identification of anti-SLE virus IgM-positive samples significantly, but this came at the expense of a small percentage of anti-WN virus IgM-positive results being classified as nonspecific. It had been hoped that the number of PRNTs that needed to be performed could be reduced, but the changes to the MIAClassify program resulted in a 9.6% increase in the total number of confirmatory PRNTs requested by the updated software compared to the number of PRNTs requested by the prototype for the DVBID in-house and state 5 data (data not shown). While this was unfavorable from a workload standpoint, the overall benefit of using the updated software was that, when all the diagnostic data were taken into account for a specimen, the likelihood of the WN/SLE MIA testing algorithm leading to the correct answer (as determined by PRNT) was greater than that for the prototype. The WN/SLE MIA therefore is particularly useful in identifying samples that, by virtue of their high probabilities of correct classification, do not need to be confirmed by PRNT. Additionally, the WN/SLE MIA recognizes those specimens for which a clear-cut answer is not forthcoming by using this method and identifies these specimens for confirmation. As is well recognized, PRNT is not always the most appropriate test with which to compare IgM data, given that the PRNT measures neutralizing antibody rather than IgM, but nevertheless it is the accepted gold standard.
Overall, the WN/SLE MIA performed well on a larger data set than that used in the original analysis, and it was determined to be readily transferable to other laboratories. After its initial introduction, more than half of the state health laboratories have adopted it as part of their arboviral diagnostic repertoire and have participated in annual proficiency testing of split samples provided by the DVBID. Many are using the technology in conjunction with other tests that utilize the same instrumentation, such as Salmonella serotyping (14), cystic fibrosis mutation detection (22), Mycobacterium tuberculosis spoligotyping (3), antinuclear antibody testing (5), respiratory virus testing (18), and bioterrorism preparedness (17). Thus, the instrumentation, while costly, may be used for an ever-expanding array of procedures. Feedback to the DVBID has reflected that the WN/SLE MIA is easy to use, gives timely and easy-to-interpret results, and has resulted in a reduction in the number of PRNTs performed. Previously, unless an outbreak of WN virus already was confirmed in a particular locale, PRNTs commonly were performed on all samples that gave positive anti-WN virus IgM results by MAC-ELISA. The inclusion of quality control parameters based upon the validation data into the updated MIAClassify program proved helpful to the laboratories that used the method. In addition to rejecting the data if the controls failed to meet the quality control standards, the quality control routine identifies the point of failure to the user, therefore facilitating troubleshooting of the assay.
One of the longstanding problems with confirmation of results by a reference laboratory is that when results differ from those obtained in the submitting laboratory for the same specimen in the same test, it is difficult to know if the difference is due to experimental error in one of the laboratories or if it just reflects normal test variation. The validation study reported here should provide a measure of the expected performance between laboratories that are using the WN/SLE MIA with standardized reagents and the same protocol.
Acknowledgments
We thank Focus Diagnostics for providing the WN virus antigen and corresponding negative antibody as well as Samantha Vu and Tim Kram for their helpful input.
The research of H.P.M. was supported in part by an appointment to the Emerging Infectious Diseases fellowship program administered by the Association of Public Health Laboratories and funded by the Centers for Disease Control and Prevention.
APPENDIX
Formulaic representation of MIAClassify and an explanation of QDA. The following equations are true for each bead set (32 and 57) for all samples, plus the positive control sera. MFIviral antigen/MFInegative antigen = WN.Adj (32) and SLE.Adj (57). WN.Adj (WN + control)/SLE.Adj (SLE + control) = normalizing ratio, R. For each sample, the following equations are true. SLE.Adj × R = SLE.Adj2. WN.Adj/slope of regression = WN.Std; SLE.Adj2/slope of regression = SLE.Std (slope of regression refers to the regression slope for the current plate's control averages against the averages of historical controls). Log10 WN.Std = W; log10 SLE.Std = S.
QDA was used to classify the samples as follows. Assume that the data value (W, S) derives from one of three bivariate normally distributed populations, WN virus positive, SLE virus positive, and negative, and we are to determine from which of the three populations the data were produced. Assume these three populations (c = 1, 2, 3) have means (μc,W and μc,S) and covariance matrices
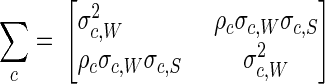 |
where σc2 is the variance and ρc is the correlation between W and S for population c. The values of the mean, variance, and correlation parameters are taken as known, having been estimated from exogenous data of a previous study (8). Observation (W, S) is then classified as having been drawn from population c by computing the quantities
 |
and assigning the observation to the population c with minimum Qc. This is equivalent to assigning the observation to the population c with maximum posterior classification probability under a uniform prior distribution.
Footnotes
Published ahead of print on 3 July 2007.
REFERENCES
- 1.Björck, L., and G. Kronvall. 1984. Purification and some properties of streptococcal protein G, a novel IgG-binding reagent. J. Immunol. 133969-974. [PubMed] [Google Scholar]
- 2.Centers for Disease Control and Prevention. 2005. West Nile virus activity—United States, 2005. Morb. Mortal. Wkly. Rep. 54678-679. [PubMed] [Google Scholar]
- 3.Cowan, L. S., L. Diem, M. C. Brake, and J. T. Crawford. 2004. Transfer of a Mycobacterium tuberculosis genotyping method, spoligotyping, from a reverse line-blot hybridization, membrane-based assay to the Luminex multianalyte profiling system. J. Clin. Microbiol. 42474-477. [DOI] [PMC free article] [PubMed] [Google Scholar]
- 4.Davis, B. S., G. J. Chang, B. Cropp, J. T. Roehrig, D. A. Martin, C. J. Mitchell, R. Bowen, and M. L. Bunning. 2001. West Nile virus recombinant DNA vaccine protects mouse and horse from virus challenge and expresses in vitro a noninfectious recombinant antigen that can be used in enzyme-linked immunosorbent assays. J. Virol. 754040-4047. [DOI] [PMC free article] [PubMed] [Google Scholar]
- 5.González-Buitrago, J. M. 2006. Multiplexed testing in the autoimmunity laboratory. Clin. Chem. Lab. Med. 441169-1174. [DOI] [PubMed] [Google Scholar]
- 6.Hogrefe, W. R., R. Moore, M. Lape-Nixon, M. Wagner, and H. E. Prince. 2004. Performance of immunoglobulin G (IgG) and IgM enzyme-linked immunosorbent assays using a West Nile virus recombinant antigen (preM/E) for detection of West Nile virus- and other flavivirus-specific antibodies. J. Clin. Microbiol. 424641-4648. [DOI] [PMC free article] [PubMed] [Google Scholar]
- 7.Johnson, A. J., D. A. Martin, N. Karabatsos, and J. T. Roehrig. 2000. Detection of anti-arboviral immunoglobulin G by using a monoclonal antibody-based capture enzyme-linked immunosorbent assay. J. Clin. Microbiol. 381827-1831. [DOI] [PMC free article] [PubMed] [Google Scholar]
- 8.Johnson, A. J., A. J. Noga, O. Kosoy, R. S. Lanciotti, A. A. Johnson, and B. J. Biggerstaff. 2005. Duplex microsphere-based immunoassay for detection of anti-West Nile virus and anti-St. Louis encephalitis virus immunoglobulin M antibodies. Clin. Diagn. Lab. Immunol. 12566-574. [DOI] [PMC free article] [PubMed] [Google Scholar]
- 9.Kao, C. L., C. C. King, D. Y. Chao, H. L. Wu, and G. J. Chang. 2005. Laboratory diagnosis of dengue virus infection: current and future perspectives in clinical diagnosis and public health. J. Microbiol. Immunol. Infect. 385-16. [PubMed] [Google Scholar]
- 10.Lindsey, H. S., C. H. Calisher, and J. H. Mathews. 1976. Serum dilution neutralization test for California group virus identification and serology. J. Clin. Microbiol. 4503-510. [DOI] [PMC free article] [PubMed] [Google Scholar]
- 11.Martin, D. A., B. J. Biggerstaff, B. Allen, A. J. Johnson, R. S. Lanciotti, and J. T. Roehrig. 2002. Use of immunoglobulin M cross-reactions in differential diagnosis of human flaviviral encephalitis infections in the United States. Clin. Diagn. Lab. Immunol. 9544-549. [DOI] [PMC free article] [PubMed] [Google Scholar]
- 12.Martin, D. A., D. A. Muth, T. Brown, A. J. Johnson, N. Karabatsos, and J. T. Roehrig. 2000. Standardization of immunoglobulin M capture enzyme-linked immunosorbent assays for routine diagnosis of arboviral infections. J. Clin. Microbiol. 381823-1826. [DOI] [PMC free article] [PubMed] [Google Scholar]
- 13.Martin, D. A., A. Noga, O. Kosoy, A. J. Johnson, L. R. Petersen, and R. S. Lanciotti. 2004. Evaluation of a diagnostic algorithm using immunoglobulin M enzyme-linked immunosorbent assay to differentiate human West Nile virus and St. Louis encephalitis virus infections during the 2002 West Nile virus epidemic in the United States. Clin. Diagn. Lab. Immunol. 111130-1133. [DOI] [PMC free article] [PubMed] [Google Scholar]
- 14.McQuiston, J. R., R. Parrenas, M. Ortiz-Rivera, L. Gheesling, F. Brenner, and P. I. Fields. 2004. Sequencing and comparative analysis of flagellin genes fliC, fljB, and flpA from Salmonella. J. Clin. Microbiol. 421923-1932. [DOI] [PMC free article] [PubMed] [Google Scholar]
- 15.Monath, T. P., F. Guirakhoo, R. Nichols, S. Yoksan, R. Schrader, C. Murphy, P. Blum, S. Woodward, K. McCarthy, D. Mathis, C. Johnson, and P. Bedford. 2003. Chimeric live, attenuated vaccine against Japanese encephalitis (ChimeriVax-JE): phase 2 clinical trials for safety and immunogenicity, effect of vaccine dose and schedule, and memory response to challenge with inactivated Japanese encephalitis antigen. J. Infect. Dis. 1881213-1230. [DOI] [PubMed] [Google Scholar]
- 16.Monath, T. P., and T. F. Tsai. 1987. St. Louis encephalitis: lessons from the last decade. Am. J. Trop. Med. Hyg. 3740S-59S. [DOI] [PubMed] [Google Scholar]
- 17.Pien, B. C., J. R. Saah, S. E. Miller, and C. W. Woods. 2006. Use of sentinel laboratories by clinicians to evaluate potential bioterrorism and emerging infections. Clin. Infect. Dis. 421311-1324. [DOI] [PMC free article] [PubMed] [Google Scholar]
- 18.Prudent, J. R. 2006. Using expanded genetic alphabets to simplify high-throughput genetic testing. Expert Rev. Mol. Diagn. 6245-252. [DOI] [PubMed] [Google Scholar]
- 19.Ripley, B. D. 1996. Pattern recognition and neural networks. Cambridge University Press, Cambridge, England.
- 20.U.S. Government Printing Office. 2005. 42. In Centers for Medicare and Medicaid Services, Department of Health and Human Services (ed.), vol. 3. U.S. Government Printing Office, Washington, DC.
- 21.Waterboer, T., P. Sehr, K. M. Michael, S. Franceschi, J. D. Nieland, T. O. Joos, M. F. Templin, and M. Pawlita. 2005. Multiplex human papillomavirus serology based on in situ-purified glutathione S-transferase fusion proteins. Clin. Chem. 511845-1853. [DOI] [PubMed] [Google Scholar]
- 22.Watson, M. S., G. R. Cutting, R. J. Desnick, D. A. Driscoll, K. Klinger, M. Mennuti, G. E. Palomaki, B. W. Popovich, V. M. Pratt, E. M. Rohlfs, C. M. Strom, C. S. Richards, D. R. Witt, and W. W. Grody. 2004. Cystic fibrosis population carrier screening: 2004 revision of American College of Medical Genetics mutation panel. Genet. Med. 6387-391. [DOI] [PMC free article] [PubMed] [Google Scholar]
- 23.Wong, S. J., V. L. Demarest, R. H. Boyle, T. Wang, M. Ledizet, K. Kar, L. D. Kramer, E. Fikrig, and R. A. Koski. 2004. Detection of human anti-flavivirus antibodies with a West Nile virus recombinant antigen microsphere immunoassay. J. Clin. Microbiol. 4265-72. [DOI] [PMC free article] [PubMed] [Google Scholar]