Abstract
The results of a randomized controlled trial that tested the effects of eight-week, six-contact multi-dimensional interactive interventions for symptom management are presented. Four hundred and thirty-five cancer patients with solid tumors undergoing chemotherapy were randomized to receive either nurse-assisted symptom management (NASM) or automated telephone symptom management (ATSM). A prior trial established the effectiveness of NASM compared with conventional care. Seventeen symptoms commonly experienced by patients undergoing chemotherapy were rated on a scale from 0 to 10 and were evaluated at baseline, at each of the six intervention contacts and post-intervention observation at 10 weeks. Both groups achieved significant reduction in symptom severity over baseline, and there was no difference between groups on symptom severity at 10 weeks. Randomization accounted for possible reductions in severity due to response shifts. Severity of symptoms reported by patients at each of the six intervention contacts was measured using a Rasch model. Symptom pattern was different for lung and non-lung cancer patients, and they were analyzed separately. Longitudinal analyses revealed that lung cancer patients with greater symptom severity withdrew from later intervention contacts of the ATSM. The results suggest that both NASM and ATSM achieved a clinically significant reduction in symptom severity. The NASM may be more effective than ATSM in retaining lung cancer patients in the intervention. Further testing of ATSM supplemented by NASM for patients with severe symptoms is warranted.
Keywords: Randomized clinical trial, symptom severity, automated telephone systems, nurse administered system
Introduction
Cancer patients experience a number of life-altering symptoms during chemotherapy. Symptom severity may be a function of the site and stage of a cancer, treatment regimens, or patient characteristics, and may change over time [1]. Measures of symptom severity produced by established symptom scales [2-6] may not fully capture the impact of the intervention on different symptoms because of summing severity scores across an array of symptoms. Recent articles [7-8] confirm the need for more precise longitudinal measurement of symptom severity and impact on quality of life.
Trials testing multi-dimensional interactive interventions to manage cancer patients' symptoms have several problems that prohibit definitive conclusions. First, many trials compare novel strategies to conventional care alone, failing to consider relative effectiveness of different interventions. Further, analyses are confined to pre-post comparisons without testing the impact of successive intervention contacts, and are limited to single sites of cancer or to one or two symptoms [9-12]. Finally only a few test interventions directed toward multiple symptoms across multiple cancer sites [13-14].
The purpose of this randomized trial is to test two multimodal interventions for multiple symptoms experienced by patients with multiple cancer sites while addressing for the methodological issues that have plagued other studies. Two interventions were tested: 1) a Nurse Assisted Symptom Management (NASM) intervention delivered by telephone by trained cancer nurses, and 2) an Automated Telephone Symptom Management (ATSM) intervention that delivers a standard message focused on patients' symptoms.
An earlier trial [14] established the superiority of the NASM intervention for symptom management over and above conventional care. In that trial, following the baseline interview, 118 patients were randomized to receive nursing intervention and 119 were assigned to receive conventional care. At 10 weeks, a mid-point observation was made, and at 20 weeks, a post-intervention interview was administered. Patients in the NASM arm who entered the earlier trial with higher symptom severity reported significantly lower severity at 10 and 20 weeks. Controlling for chemotherapy treatment status and supportive care medications did not alter the effect of the experimental intervention. Once the effectiveness of the nursing intervention compared to conventional care was established, ethical considerations led to the decision to offer effective tools for symptom management to both groups in the current trial. Also, the automated telephone system was used as a comparison to NASM to determine if a much lower cost system with targeted instruction could deliver comparable outcomes and thus increase the opportunity for translation into oncology practice.
In this trial, comparisons between NASM and ATSM are guided by the following research questions. First, after adjusting for patient and disease characteristics, does the NASM result in lower summed symptom severity scores at 10 weeks than the ATSM? Second, when a longitudinal analysis of symptom severity at each of the six intervention contacts is performed, does the NASM differ from the ATSM in their cumulative impact on severity scores at each contact? Third, do the two interventions perform differently by patient and disease characteristics, and are the two interventions were equally successful in retaining patients throughout six contacts. The trial was powered to detect an effect size of 0.37 for group differences on symptom severity at 10 weeks.
Background and Literature Review
Multi-dimensional interactive strategies are short-term and tailored [15-16]. Problems are identified, and the therapist and patient together select strategies classified around coping, reframing, education, and eliciting support for adapting to or overcoming the problem. At subsequent contacts, each strategy delivered at the previous session is evaluated, those that the patient could not implement or were not successful are dropped or modified, and different strategies proposed. Successful strategies are retained [17]. Meta-analyses of tailored multidimensional interventions reveal statistically significant effects on levels of anxiety, depression, pain, and nausea. Among cancer patients, these professionally administered multi-dimensional strategies for management of stress and fatigue have proven only marginally better than traditional educational interventions [18-20]. Evaluation of these trials rely on pretest-posttest measures; few conduct longitudinal analyses to assess patients' responses at each intervention contact.
Interactive/Automated Telephone Response Systems merge computer software to a pre-recorded voice and an automated telephone system. Patients are called at specified times and intervals, and their responses recorded using the touchtone pad of a telephone. Based on patient responses to symptom severity, follow-up assessment and interventions can be tailored to patients needs. Overall, patient evaluations indicate that automated systems have high usability and acceptability [21], and are more accurate than in-person interviews in obtaining sensitive information [22, 23]. They appear equal to clinical interviews in obtaining data to make psychiatric diagnoses [24], in promoting diabetic self-care management skills [25, 26], and in delivering pain coping strategies [27]. While there are few evaluations of cost effectiveness, the literature suggests that this technology could become a valuable adjunct to more costly interactions between therapists and patients.
Methods
Sample and Procedure
The Institutional Review Board (IRB) of the sponsoring university, and the IRBs of two comprehensive cancer centers, one community cancer oncology program, and six hospital-affiliated community oncology centers approved this research. Subcontracts were established, and nurses from the respective clinical trials offices were hired and trained to implement the recruitment protocol. Eligibility requirements included 1) being 21 years of age or older, 2) having a diagnosis of a solid tumor cancer or non-Hodgkins lymphoma, 3) undergoing a course of chemotherapy, 4) being able to speak and read English, and 5) having a touchtone telephone. Patients agreeing to participate signed an informed consent form, and had all sociodemographic information entered into a web-based tracking system. Patients were screened for symptom severity using an automated voice response version of the M. D. Anderson Symptom Inventory [7]. Following symptom management guides, a score of 2 or higher suggests a need for monitoring. Therefore, patients scoring 2 or higher on severity of at least one symptom (range 0-10) entered the trial. Patients not scoring 2 or higher on any of the symptoms were called twice weekly for up to six weeks. Those failing to report a severity score of 2 or higher on any symptom were sent a letter thanking them for participation but were not entered into the trial.
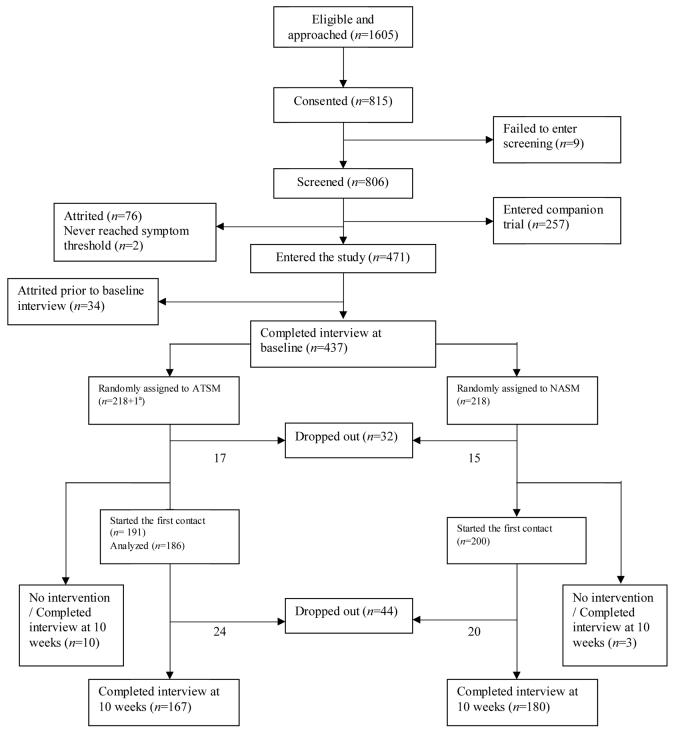
Patients who scored 2 or higher had an intake interview, received a copy of the Symptom Management Guide (SMG), and were randomized into either the NASM or the ATSM using a computer minimization program [28] that balanced the arms with respect to recruitment location and site of cancer. Both arms of the trial received one call each for the first four weeks, skipped week 5, were called week 6, skipped week 7, and received a final call on week 8. At 10 weeks, outcome data were obtained through second interview. Figure 1 summarizes the number of enrolled and attritted patients at each step, the number of cases meeting entry criteria and number analyzed.
Figure 1.
Flowchart of the study (1a indicates a patient who never received any intervention in ATSM group and had interview at baseline and 20 weeks).
The trial sought to compare the impact of a six-contact, eight-week ATSM intervention delivered via an automated system, with an NASM protocol delivered by experienced cancer nurses, on reducing patient reports of severity of 17 symptoms: fatigue, pain, dyspnea, insomnia, distress, nausea, fever, difficulty remembering, lack of appetite, dry mouth, vomiting, numbness and tingling, diarrhea, cough, constipation, weakness, and alopecia. Following guidelines, patients who rated severities of symptoms at 4 or higher (threshold) at each contact received strategies to manage those symptoms. Four was set as the number at which clinical guidelines require active intervention. For symptoms scored at seven or higher, patients in both arms were encouraged to call their oncology office if the symptom did not improve. Reviews of medical records found no comments on the calls made by patients regarding symptoms, and this information was not used in the analyses. Because of randomization, the additional impact on symptoms produced by calling the oncology offices likely occurred equally in the two arms. For patients assigned to the NASM group, nurses delivered up to four strategies for each symptom supplemented with references to the SMG. At each subsequent contact, assigned strategies were evaluated: the nurse inquired if the strategy was tried, and if tried, was it helpful in managing the symptom. While each intervention strategy was assessed as to whether or not it was tried and if tried, was successful, rehearsal or practice were not emphasized. If a strategy was not tried, or tried but not found helpful, then patients were counseled as to how they might fit strategy into their daily activities or were offered different strategies. Successful strategies were reinforced and continued.
In the ATSM arm, a pre-recorded pleasant female voice queried patients regarding their severity for the 17 symptoms. To rate severity, patients pressed the appropriate numbers on their telephone keypads. For symptoms rated at 4 or higher, patients were directed to the section of the SMG that informed them about strategies to manage each symptom. The ATSM was programmed such that all symptoms scored at 4 or higher on the previous contact patients were queried as to whether or not they tried the strategies identified in the SMG and, if so, were they helpful in lowering the severity of that symptom. Numerical prompts were used so patients could respond using their telephone keypad. When all symptoms above threshold at the previous contact were evaluated, the system then reviewed the current severity of all symptoms.
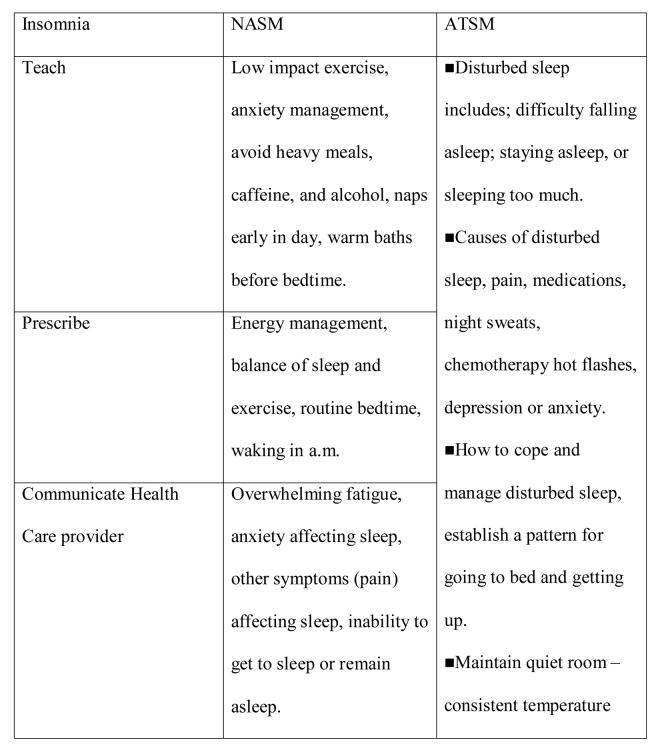
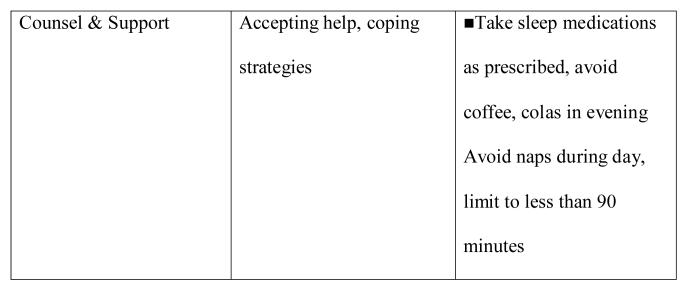
Figure 2 contains an example of strategies available to address insomnia. For the NASM, the strategies were organized according to intervention (action) verbs (assess, teach, prescribe communicate, support) contained in the drop-down lists of the nursing intervention protocol guide. The right hand column summarizes information contained in the SMG for insomnia used in the ATSM.
Figure 2.
Strategies to address insomnia.
Measures
Age, gender, site and stage of cancer were obtained from the patients' medical records, entered into the tracking system, and confirmed in baseline interview. Comorbid conditions were assessed at baseline using a 13-item questionnaire; patients were asked if a doctor had ever told them they had such conditions as diabetes, high blood pressure and other chronic diseases [29]. Severity of 17 symptoms were scored by patients on a scale ranging from absence (0) to the worst severity possible (10) at baseline interview, each of the six intervention contacts, and 10-week interview. Scores at baseline and 10 weeks were summed across symptoms creating an index of severity ranging from 0 to 170. Severity scores obtained during intervention contacts were dichotomized as below a threshold of 4, or 4 or higher.
Data Analysis
Analysis of the interview data using summed scores of symptom severity
The intention to treat approach was adopted for this analysis [30]. All patients were analyzed as randomized regardless of their compliance with the intervention protocol. Generalized linear models implemented in SAS 9.1® [31] were used to relate symptom severity at 10 weeks to symptom severity at baseline, group, their interaction, and other potentially important covariates: number of comorbid conditions, age and site of cancer. Residuals were examined to evaluate model fit and outliers. The parameters associated with the group variable were tested. To evaluate the change over baseline, a matched pairs t-test was performed for each group.
Rasch analysis of data from intervention contacts
To reflect the intervention protocol, where only symptoms that reached a threshold of 4 or higher on severity were addressed, in analyses of the intervention contacts, symptom severity scores were dichotomized into below or above threshold. While using dichotomous instead of continuous variables may result in loss of power, the categories form more stable referents to evaluate differences in symptom patterns and gauge the effect of the interventions. A Rasch model suitable for yes/no responses [32] was used to measure symptom severity at six intervention contacts. Rasch model and its generalizations have been used to evaluate quality of life [33-36] and depressive symptoms [36]. The model's symptom parameter is operationalized as the prevalence of a symptom above threshold. The higher the prevalence of a symptom above threshold, the lower the symptom parameter is. Within the Rasch framework, patients are more likely to report symptoms with low symptom parameters before reporting symptoms with high symptom parameters. Patient parameters (patients' Rasch severity scores) were derived at each contact. Rasch severity scores could be thought of as a number of symptoms above threshold adjusted for the differences among symptoms. For example, if two patients each have one symptom above threshold at a contact, the patients will not have the same Rasch severity score unless the symptom is the same or the two symptoms have the same prevalence above threshold at that contact. Rasch analyses were conducted using WINSTEPS computer program [37].
To address the unidimensionality assumption of the underlying construct of symptom severity, infit and outfit statistics reported as mean squares were used. Values of both infit and outfit statistics outside of the interval from 0.6 to 1.4 indicated that a symptom tapped into a different dimension than other symptoms, and the symptom was removed [38]. In the Rasch model, symptom parameters are properties of symptoms and not patients who report symptoms. If symptom parameters vary across site of cancer, then Differential Item Functioning (DIF) by site of cancer is present, i.e., patients with the same underlying value of severity endorse a symptom differently by site of cancer. In such a case, patient measures of symptom severity can not be derived from a single Rasch model. Instead, separate models by site of cancer should be fit to adequately measure the underlying construct. Several methods of DIF detection are available [35]. We tested the stability of symptom parameters across groups of patients. In multiple comparisons of symptom parameters, Bonferroni corrections were employed to account for pairwise comparisons that corresponded to multiple categories and time points. To avoid inflated type II error, we did not adjust the results for the multiple symptoms tested.
Once tested for dimensionality properties and DIF across time and important covariates, symptom(s) tapping into different dimension were removed, and patients were divided into subgroups according to values of the variable(s) for which DIF was present. Separate Rasch models were fit for each subgroup of patients.
Longitudinal analysis of Rasch scores of symptom severity
Rasch severity scores were entered into longitudinal models that tested the effect of the intervention for each subgroup of patients across six contacts. Longitudinal models were fit using mixed procedure in SAS 9.1.[31] Rasch severity scores at contacts 2-5 were related to Rasch severity score at contact 1, study group, time, study group by time interaction and important covariates. Several ways of modeling the time trend were examined as well as random versus fixed intercept, and model with the best fit was selected using log-likelihood test. Least square (LS) means [39] of Rasch severity scores at each contact were compared across groups. Data from all patients who completed contact 1 and at least one more contact were used in this analysis. According to the protocol, patients had to complete contact 1 in order to proceed with contacts 2-6.
Attrition and protocol adherence analyses
Symptom severity of patients who attrited between baseline and 10 week interviews was compared by group. Generalized estimating equations (GEE) for repeated binary data [40] were used to relate the probability of withdrawing from the intervention (but not necessarily dropping out of the study as some patients completed less than six contacts and the 10-week interview) to symptom severity at previous contact and contact number. Completed contacts were appropriately numbered to reflect any contacts skipped by patients.
Results
Based on the information in their medical records, 1605 cancer patients were eligible for the study and were approached by nurse recruiters, and 815 signed informed consent forms. A total of 806 patients were screened simultaneously for two separate symptom management trials. Two hundred fifty-seven patients had a consented caregiver and entered the companion trial, 78 dropped out prior to entry, another 34 dropped out prior to the baseline interview. In total, 437 patients completed the baseline interview, and were randomized: 219 to the ATSM and 218 to the NASM.
A total of 13 patients (10 in the ATSM and 3 in the NASM) did not complete any of the intervention contacts, but had 10-week interviews. These patients were included in the intention-to-treat analysis of interview data. Thirty-two patients (17 from ATSM, 15 from NASM) dropped out of the study prior to the first intervention contact, and 44 dropped out in the course of the intervention (24 from ATSM, 20 from NASM), making the total attrited between baseline and 10 weeks 76 (41 from ATSM, 35 from NASM). These patients did not differ significantly on the symptom severity reported at baseline: 41 patients who attrited from the ATSM averaged 42.32 on summed symptom severity at baseline, and 35 from the NASM averaged 41.47 (P-value 0.89, not in tables). Table 1 summarizes the distribution of age, sex, site and stage of cancer, baseline and 10 week symptom severity by group. Most measures including symptom severity were equivalent at baseline.
Table 1.
Characteristics of Study Participants by the Two Intervention Arms
| ATSM | NASM | |||||
|---|---|---|---|---|---|---|
| n | % | N | % | |||
| Gender | ||||||
| Male | 53 | 24.31 | 57 | 26.15 | ||
| Female | 165 | 75.69 | 161 | 73.85 | ||
| Site of Cancer | ||||||
| Lung | 33 | 15.14 | 37 | 16.97 | ||
| Breast | 87 | 39.91 | 89 | 40.83 | ||
| Colon | 32 | 14.68 | 30 | 13.76 | ||
| Other | 66 | 30.28 | 62 | 28.44 | ||
| Stage of Cancer | ||||||
| Early | 44 | 20.18 | 31 | 14.35 | ||
| Late | 174 | 79.82 | 185 | 85.65 | ||
| n | Mean | Std | N | Mean | Std | |
| Age | 217 | 57.07 | 12.01 | 218 | 57.28 | 11.84 |
| Comorbidity | 218 | 2.01 | 1.63 | 218 | 2.10 | 1.61 |
| Symptom severity at baseline |
212 | 35.63 | 22.50 | 215 | 32.65 | 21.01 |
| Symptom severity at 10 week |
175 | 20.73 | 18.05 | 180 | 20.80 | 19.16 |
Results Based on Interview Data Analysis
The first research question compared the impact of each arm on patient summed severity scores at 10 weeks. The paired t-tests revealed that both arms of the trial produced a significant reduction in symptom severity over baseline. The effect sizes were virtually identical (0.56 NASM, 0.59 ATSM). These effect sizes are just above medium in Cohen's classification [41] and suggest clinically significant improvement over baseline in symptom severity of patients in each group even though matched pairs analysis cannot attribute the improvement to the interventions received. The group differences were tested in the linear model relating summed severity score at 10 weeks to severity score at baseline, group, and symptom severity at baseline and group interaction and the number of comorbid conditions. Other covariates, such age, site of cancer (lung versus non lung) and gender, were not significant and are not included in the final model. The additive group effect and group by symptom severity at baseline interaction were not significant. Two outliers detected in the NASM group did not affect the results. The number of comorbid conditions had a positive association with symptom severity at 10 weeks (P<0.01, not in tables).
Rasch Analysis of Intervention Contacts Data
Because of a technical script error that occurred in the automated system, pain was not measured in uniform manner across all intervention contacts; thus, it was not included in the Rasch analysis. Because nausea and vomiting were combined for the purposes of the intervention strategies, the Rasch analyses began with 15 symptoms. Alopecia had infit and outfit parameters greater than 1.4 and was removed from the set of symptoms.
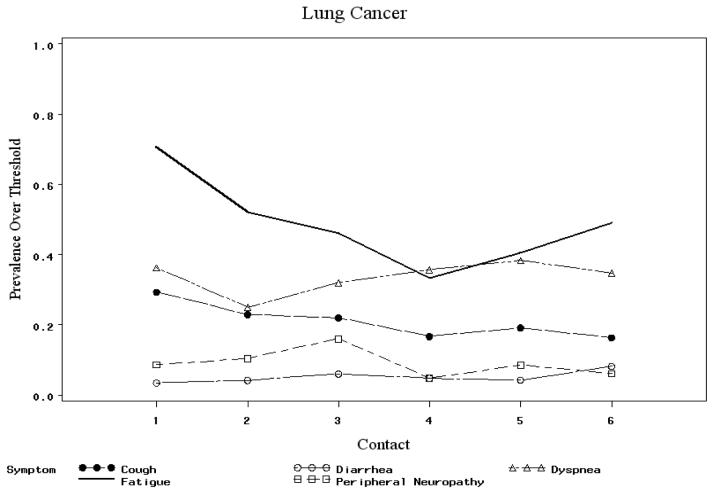
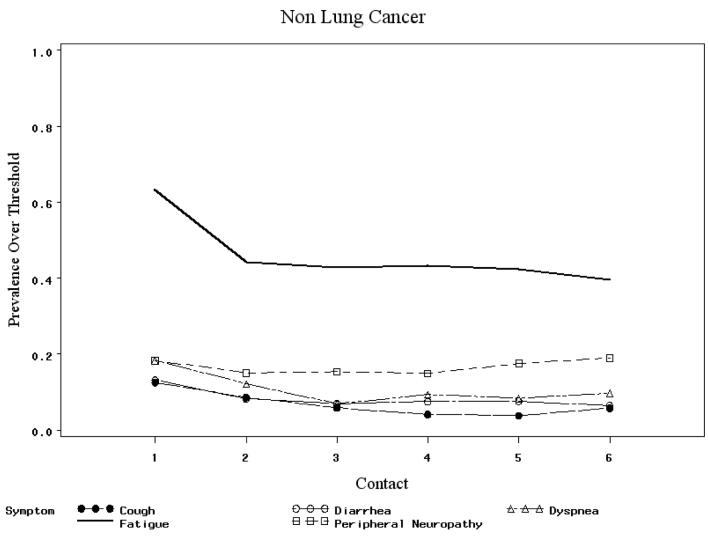
To investigate DIF across time, symptom parameters were compared over the six intervention contacts. No significant differences were found. No significant DIF was found across age groups, gender, number of comorbid conditions. In testing by site of cancer, dyspnea, cough, diarrhea and peripheral neuropathy exhibited DIF: t-test statistics were 3.39, 3.47, -2.37 and −2.23, respectively, exceeding the critical value of 1.97 for 322 degrees of freedom. Diarrhea had lower prevalence over threshold among lung cancer patients: 3.4% at contact 1 compared to 13.4% for other cancer patients. The corresponding contact 1 prevalence above threshold figures for dyspnea were 36.2% for lung and 18.5% for non-lung cancer patients (see Figure 3). Therefore two separate models, one for lung cancer patients, and one for non lung cancer patients, were used to derive Rasch measures of patients' symptom severity based on 14 symptoms.
Figure 3.
Prevalence above threshold for selected symptoms across contacts.
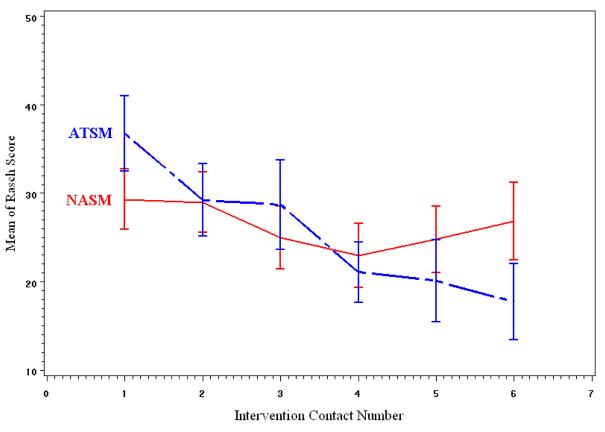
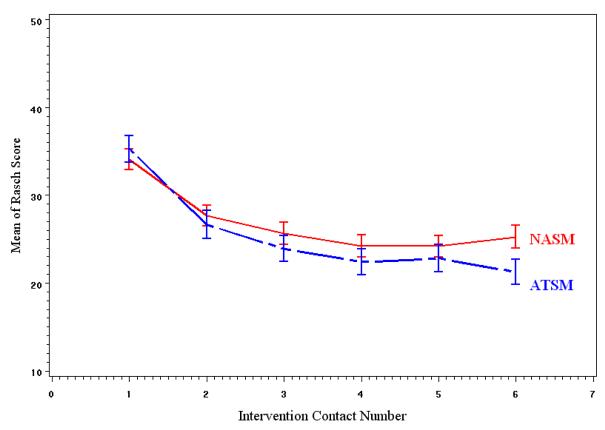
Patients' Rasch symptom severity measures were entered into two separate longitudinal models. The measure at contact 1 was a covariate to adjust for the differences between groups at contact 1. The models had a random intercept, and time was modeled as ordinal to reflect that contacts were not equally spaced over time. First order auto regression (AR(1)) was chosen as covariance structure with respect to time. Tests of fixed effects are presented in Table 2, and LS means of Rasch scores of symptom severity at each contact are in Table 3. Figures 4 and 5 display the means of Rasch symptom severity scores plotted against contact number for each group for lung and non lung cancer patients respectively.
Table 2.
Longitudinal Model for Rasch Symptom Severity Scores at Contacts 2-6
| Lung Cancer | Non Lung Cancer | |||
|---|---|---|---|---|
| Effect | F-value | P-value | F-value | P-value |
| Rasch score at 1st contact | 82.11 | <0.01 | 213.99 | <0.01 |
| Comorbidity | 19.80 | <0.01 | 4.45 | 0.04 |
| Group | 7.19 | <0.01 | 3.01 | 0.08 |
| Contact number | 2.65 | 0.03 | 6.26 | <0.01 |
| Group * Contact number | 2.14 | 0.08 | 1.27 | 0.28 |
Table 3.
Least Square Means of Rasch Symptom Severity Scores By Intervention Contact Visit Adjusted for Contact 1 Score
| Lung Cancer | Non-Lung Cancer | ||||||
|---|---|---|---|---|---|---|---|
| Contact | Group | N | Least Square Mean |
P-value | n | Least Square Mean |
P-value |
| 2 | NASM | 26 | 30.25 | 0.34 | 149 | 27.70 | 0.73 |
| ATSM | 22 | 26.68 | 133 | 27.15 | |||
| 3 | NASM | 28 | 26.84 | 0.52 | 144 | 25.78 | 0.37 |
| ATSM | 22 | 24.44 | 132 | 24.33 | |||
| 4 | NASM | 24 | 25.77 | 0.18 | 140 | 25.01 (1.12) | 0.17 |
| ATSM | 18 | 20.47 | 130 | 22.75 (1.17) | |||
| 5 | NASM | 26 | 27.45 | <0.01 | 145 | 24.48 | 0.41 |
| ATSM | 21 | 17.31 | 120 | 23.13 | |||
| 6 | NASM | 27 | 29.28 | <0.01 | 148 | 25.38 | 0.01 |
| ATSM | 22 | 15.83 | 134 | 21.07 | |||
Figure 4.
Trend in unadjusted mean Rasch severity scores among lung cancer patients.
Figure 5.
Trend in unadjusted mean Rasch severity scores among non lung cancer patients.
The analysis of Rasch severity scores of non-lung cancer patients showed no significant differences between the two groups. The analysis of lung cancer patients revealed significant additive group effect and a group by contact number interaction that approached significance (P=0.08). Patients in the ATSM showed greater improvement in symptom severity as demonstrated by the comparison of LS means at each contact presented in Table 3. The number of comorbid conditions had significant association with symptom severity in both models (lung and non lung cancer): patients with more comorbid conditions at baseline had higher symptom severity.
To further investigate why patients with lung cancer in the ATSM arm reported significantly lower severity at later contacts, protocol adherence was analyzed. The probability of withdrawing from the intervention was related to Rasch severity score at previous contact and contact number through a GEE model.
For all patients, the probability of a patient withdrawing increased over time (P< 0.01, not in tables). For lung cancer patients, the probability was positively associated with higher Rasch severity score at previous visit for patients in the ATSM group (P=0.06) but not for patients in the NASM group (P=0.30). Therefore among lung cancer patients, the decrease in mean Rasch severity scores in the ATSM group compared to NASM group (Table 3) can be attributed to the fact that patients with higher symptom severity in the ATSM group tended not to complete later intervention contacts. For example, four lung cancer patients withdrew from the intervention contacts after contact 3, at which time two patients in the NASM had 1.5 symptoms above threshold on average (0 and 3), and 2 patients in the ATSM had 11 symptoms above threshold on average (7 and 15). Among non-lung cancer patients, 12 stopped their intervention contacts after contact three: three patients in the NASM had four symptoms above threshold on average, and nine patients in the ATSM had 3.56 symptoms on average. The GEE models for non-lung cancer patients revealed about the same strength of association between the Rasch symptom severity score at a contact and probability of withdrawing from further intervention contacts (P=0.07 for ATSM and P=0.01 for NASM). We ran separate GEE models for NASM and ATSM because of the difference in parameters of covariance structure (treated as nuisance in the models) between the groups.
Discussion
By incorporating multiple sites of cancer, large number of symptoms, and comparison of alternative interventions for symptom management into this randomized trial, we were able to specify a site of cancer with a significantly different symptom pattern (lung); how interventions differ at each contact; and the contacts at which one arm (NASM) may be more effective in retaining severely affected patients and managing their symptoms. Evidence here supports our arguments for comparing interventions using a multi-symptom, multi-cancer site sample, and an intention-to-treat approach. Overall, a nurse-directed intervention was comparable to an interactive voice response system that monitors symptoms and refers patients to SMG. No differences were observed between groups post-intervention. The observed effect size for group differences was virtually zero. Both groups produced clinically significant improvement over baseline, with effect sizes exceeding .5. With no control group in this trial, some reduction in symptom severity over baseline in both arms can be attributed to response shift or regression to the mean. However, in a previous trial, NASM significantly lowered symptom severity compared to conventional care alone, and following ethical considerations in this trial, NASM was tested against another multimodal intervention.
In this paper, we did not confine analyses to pre-post comparisons. Symptom severities at each contact were compared by using a longitudinal model. Rasch measures of symptom severity used in longitudinal models provided a better measure of patient symptom severity by accounting for differences in prevalence among symptoms at each contact. The DIF analysis showed that symptom pattern of lung cancer patients differed significantly from the symptom pattern of non-lung cancer patients. Therefore, separate analyses were conducted. These analyses showed lower symptom severity at the last few contacts for ATSM compared to NASM among lung cancer patients. This effect was due to the fact that lung cancer patients with higher severity scores withdrew from the intervention and thus did not influence the estimate for time trend at later contacts. Withdrawal from NASM group was not associated with symptom severity at prior visit among lung cancer patients. This suggests that, for lung cancer patients with severe symptoms, ATSM does not provide adequate symptom management, while NASM was able to keep these patients from withdrawing from the intervention.
These differences suggest that a future trial compare the ATSM alone with the ATSM plus introduction of the NASM for lung cancer patients, or any patients who have high symptom severity. A combination of ATSM and NASM might be employed. The automated system could monitor and deliver SMG based strategies. When those are not helpful, then patients might be shifted to a nursing call in order to more carefully tailor interventions or assess dimensions of the problems. Such combination will make more judicious use of nurses' time. The comparison of ATSM to the combination of ATSM and NASM could begin to establish the points where patients benefit from the more resource intensive nursing arm. More specific differentiation of patients' symptom management needs and appropriate strategies to assist and support patients in their management of symptoms offers a valuable addition to the supportive care of cancer patients.
Several limitations of this research should be noted. The lists of symptoms evaluated in the interviews and during intervention contacts were slightly different: nausea and vomiting were combined into one in the symptom assessment during intervention contacts, while they were separate in the interview; peripheral neuropathy and depression were evaluated during intervention contacts, and numbness and tingling and distress in interview. During the intervention contacts, pain was not measured in a uniform manner throughout the trial, and was not included in the intervention data analysis. Samples differed slightly for interview and intervention analysis because some patients had interviews but not intervention contacts.
In conclusion, this trial demonstrated the value of including multiple sites of cancer, multiple symptoms, and two active intervention arms during which data are collected and assessed at each of multiple contacts. Through these efforts, we were able to identify sites of cancer (lung) in need of more intensive intervention strategies and to demonstrate the value of the ATSM for the management of symptoms among cancer patients undergoing chemotherapy.
Acknowledgments
This study was supported by National Cancer Institute Grant # RO1 CA030724, “Automated Telephone Monitoring for Symptom Management,” Charles Given, PI, Barbara Given, Co-PI, in affiliation with the Walther Cancer Institute, Indianapolis, Indiana.
Footnotes
Publisher's Disclaimer: This is a PDF file of an unedited manuscript that has been accepted for publication. As a service to our customers we are providing this early version of the manuscript. The manuscript will undergo copyediting, typesetting, and review of the resulting proof before it is published in its final citable form. Please note that during the production process errors may be discovered which could affect the content, and all legal disclaimers that apply to the journal pertain.
References
- 1.Kroenke K. Studying symptoms: sampling and measurement issues. Ann Intern Med. 2001;134:844–853. doi: 10.7326/0003-4819-134-9_part_2-200105011-00008. [DOI] [PubMed] [Google Scholar]
- 2.Cleeland C, Mendoza T, Wang X, et al. Assessing symptom distress in cancer patients. Cancer. 2000;89:634–1646. doi: 10.1002/1097-0142(20001001)89:7<1634::aid-cncr29>3.0.co;2-v. [DOI] [PubMed] [Google Scholar]
- 3.Portenoy RK, Thaler HT, Kornblith AB, et al. The Memorial Symptom Assessment Scale: an instrument for the evaluation of symptom prevalence, characteristics and distress. Eur J Cancer. 1994;30A:1326–1336. doi: 10.1016/0959-8049(94)90182-1. [DOI] [PubMed] [Google Scholar]
- 4.Bruera E, Kuehn N, Miller M, Selmser P, Macmillan K. The Edmonton Symptom Assessment System (ESAS): a simple method for the assessment of palliative care patients. J Palliative Care. 1991;7:6–9. [PubMed] [Google Scholar]
- 5.De Hayes J, van Knippenberg F, Neijt J. Measuring psychological and physical distress in cancer patients: structure and application of the Rotterdam Symptom Checklist. Br J Cancer. 1990;62:1034–1038. doi: 10.1038/bjc.1990.434. [DOI] [PMC free article] [PubMed] [Google Scholar]
- 6.McCorkle R, Benoliel J. Symptom distress, current concerns, and mood disturbance after diagnosis of life threatening disease. Soc Sci Med. 1983;17:431–438. doi: 10.1016/0277-9536(83)90348-9. [DOI] [PubMed] [Google Scholar]
- 7.Paice J. Assessment of Symptom Clusters in People with Cancer. J of NCI Monographs. 2004;32:98–102. doi: 10.1093/jncimonographs/lgh009. [DOI] [PubMed] [Google Scholar]
- 8.Dodd M, Miaskowski C, Lee K. Occurrence of symptom clusters. J National Cancer Institute Monographs. 2004;32:76–78. doi: 10.1093/jncimonographs/lgh008. [DOI] [PubMed] [Google Scholar]
- 9.Shacham S, Reinhardt L, Raubertas RF, Cleeland CS. Emotional states and pain: Intraindividual and interindividual measures of association. J Behav Med. 1983;6(4):405–419. doi: 10.1007/BF00846327. [DOI] [PubMed] [Google Scholar]
- 10.National Institutes of Health Symptom management in cancer: pain, depression, and fatigue; State of the Science Conference Statement, NCI; 2002. [DOI] [PubMed] [Google Scholar]
- 11.Miaskowski C, Lee K. Pain, fatigue, and sleep disturbances in oncology outpatients receiving radiation therapy for bone metastasis: A pilot study. J Pain Symptom Manage. 1999;17(5):320–332. doi: 10.1016/s0885-3924(99)00008-1. [DOI] [PubMed] [Google Scholar]
- 12.Cooley M, Short T, Moriarty H. Symptom prevalence, distress, and change over time in adults receiving treatment for lung cancer. PsychoOncology. 2003;12(7):694–708. doi: 10.1002/pon.694. [DOI] [PubMed] [Google Scholar]
- 13.Given C, Given B, Azzouz F, Kozachik S, Stommel M. Predictors of pain and fatigue in the year following diagnosis in elderly patients with cancer. J Pain Symptom Manage. 2001;21(6):456–466. doi: 10.1016/s0885-3924(01)00284-6. [DOI] [PubMed] [Google Scholar]
- 14.Given C, Given B, Rahbar M, et al. Effect of cognitive behavioral intervention on reducing symptom severity during chemotherapy. J Clinical Oncology. 2004;22(3):507–516. doi: 10.1200/JCO.2004.01.241. [DOI] [PubMed] [Google Scholar]
- 15.Dobson K, Dozios D. Handbook of Cognitive Behavioral Therapies. Guilford Press; New York: 2001. Historical and Philosophical Bases of the Cognitive Behavioral Therapy; pp. 3–39. [Google Scholar]
- 16.McGinn L, Sanderson W. What allows cognitive behavioral therapy to be brief: Overview, efficacy and crucial factors facilitating brief treatment. Psychological Science and Practice. 2001;8:23–73. [Google Scholar]
- 17.Hazlett-Stevens H, Craske M. In: Brief Cognitive-Behaivoral Therapy: Definition and Scientific Foundations in Handbook of Brief Cognitive Behavior Therapy. Bond FW, Dryden W, editors. John Wiley and Sons Ltd.; New York: 2002. pp. 1–20. [Google Scholar]
- 18.Jacobsen PB, Meade CD, Stein KD, et al. Efficacy and costs of two forms of stress management training for cancer patients undergoing chemotherapy. J of Clinical Oncol. 2002;20(12):2851–2862. doi: 10.1200/JCO.2002.08.301. [DOI] [PubMed] [Google Scholar]
- 19.Yates P, Aranda S, Hargraves M. Randomized Controlled Trial of an Educational Intervention for Managing Fatigue in Women Receiving Adjuvant Chemotherapy. J Clinical Oncol. 2005;23:6027–6036. doi: 10.1200/JCO.2005.01.271. [DOI] [PubMed] [Google Scholar]
- 20.Meyer T, Mark M. Effects of psychosocial interventions with adult cancer patients: A meta-analysis of randomized experiments. Health Psychology. 1995;14:101–108. doi: 10.1037//0278-6133.14.2.101. [DOI] [PubMed] [Google Scholar]
- 21.Mooney K, Beck S, Friedman R, Ramesh F. Telephone-linked care for cancer symptom monitoring. Cancer Practice. 2002;10:147–154. doi: 10.1046/j.1523-5394.2002.103006.x. [DOI] [PubMed] [Google Scholar]
- 22.Balas EA, Jaffrey F, Kuperman G, et al. Electronic communication with patients. JAMA. 1997;278:152–159. [PubMed] [Google Scholar]
- 23.Searles J, Perrine M, Mundt J, Helzer J. Self-report of drinking using touch-tone telephone: Extending the limits of reliable daily contact. J Stud Alcohol. 1995;56:375–382. doi: 10.15288/jsa.1995.56.375. [DOI] [PubMed] [Google Scholar]
- 24.Kobak KA, Taylor LV, Dottle SL, et al. A computer-administered telephone interview to identify mental disorders. JAMA. 1997;278:905–910. [PubMed] [Google Scholar]
- 25.Piette J. Interactive voice response systems in the diagnosis and management of chronic disease. Am J Manag Care. 2000;6:817–827. [PubMed] [Google Scholar]
- 26.Piette J, Weinberger M, McPhee S. The effect of automated calls with telephone nurse follow-up on patient-centered outcomes of diabetes care (a randomized controlled trial) Medical Care. 2000;38:218–23. doi: 10.1097/00005650-200002000-00011. [DOI] [PubMed] [Google Scholar]
- 27.Naylor MR, Naud JE, Keefe FJ. Journal of Pain. 2002;3:429–438. doi: 10.1054/jpai.2002.129563. [DOI] [PubMed] [Google Scholar]
- 28.Taves DR. Minimization: a new method of assigning patients to treatment and control groups. Clinical Pharmacological Therapy. 1974;15:443–453. doi: 10.1002/cpt1974155443. [DOI] [PubMed] [Google Scholar]
- 29.Katz JN, Chang LC, Sangha O, Fossel A, Bates D. Can comorbidity be measured by questionnaire rather than medical record review? Med Care. 1996;34:73–84. doi: 10.1097/00005650-199601000-00006. [DOI] [PubMed] [Google Scholar]
- 30.Sackett D, Gent M. Controversy in counting and attributing events in clinical trials. N Engl J Medicine. 1979;301:1410–1412. doi: 10.1056/NEJM197912273012602. [DOI] [PubMed] [Google Scholar]
- 31.SAS software, Version 9 of the SAS System for Windows. Copyright © 2002-2003 SAS Institute Inc. SAS and all other SAS Institute Inc. product or service names are registered trademarks or trademarks of SAS Institute Inc.; Cary, NC, USA: [Google Scholar]
- 32.Rasch G. Probabilistic models for Some Intelligence and Attainment Tests. The University of Chicago Press; Chicago, IL: 1960. [Google Scholar]
- 33.Cella D, Dineen K, Arnason B, et al. Validation of the functional assessment of multiple sclerosis quality of life instrument. Neurology. 1996;47:129–139. doi: 10.1212/wnl.47.1.129. [DOI] [PubMed] [Google Scholar]
- 34.Raczek A, Ware J, Bjorner J, et al. Comparison of Rasch and summated rating scales constructed from SF-36 physical functioning items in seven countries: results from IQOLA project. J Clin Epidemiol. 1998;51:1203–1214. doi: 10.1016/s0895-4356(98)00112-7. [DOI] [PubMed] [Google Scholar]
- 35.Bjorner J, Petersen M, Groenvold M, et al. Use of item response theory to develop a shortened version of the EORTC QLQ-C30 emotional functioning scale. Quality of Life Research. 2004;13:1683–1697. doi: 10.1007/s11136-004-7866-x. [DOI] [PubMed] [Google Scholar]
- 36.Chan K, Orlando M, Ghosh-Dastidar B, Duan N, Sherbourne CD. The interview mode effect on the Center for Epidemiological Studies Depression (CES-D) scale: an Item Response Theory analysis. Medical Care. 2004;42(3):281–289. doi: 10.1097/01.mlr.0000115632.78486.1f. [DOI] [PubMed] [Google Scholar]
- 37.Linacre JM, Wright BD. A user's guide to WINSTEPS: Rasch model computer program. MESA Press; Chicago: 2000. [Google Scholar]
- 38.Wright B, Linacre J, Gustafson JE, et al. Reasonable mean-square fit values. Rasch Measure Trans. 1994;8:370. [Google Scholar]
- 39.Searle SR, Speed Fm, Miliken GA. Population marginal means in the linear model: an alternative to least squares means. The American Statistician. 1980;34(4):216–221. [Google Scholar]
- 40.Liang KY, Zeger SL. An overview of methods for the analysis of longitudinal data. Stat Med. 1992;11:1825–1839. doi: 10.1002/sim.4780111406. [DOI] [PubMed] [Google Scholar]
- 41.Cohen J. Statistical power analysis for the behavioral sciences. Lawrence Erlhbaum Associates; Hillsdale, N.J: 1988. [Google Scholar]


