

Abstract
Single-molecule force spectroscopy (SMFS) is a powerful tool to dissect molecular interactions that govern the stability and function of proteins. We applied SMFS to understand the effect of Zn2+ on the molecular interactions underlying the structure of rhodopsin. Force-distance curves obtained from SMFS assays revealed the strength and location of molecular interactions that stabilize structural segments within this receptor. The inclusion of ZnCl2 in SMFS assay buffer increased the stability of most structural segments. This effect was not mimicked by CaCl2, CdCl2, or CoCl2. Thus, Zn2+ stabilizes the structure of rhodopsin in a specific manner.
Zinc is the second most abundant trace element found in the human body (1) and occurs in high concentrations in the retina (2). Zinc deficiency in humans can lead to vision-related disorders such as poor dark adaptation, night blindness, and retinal degeneration (3). The role of Zn2+ in vision is likely related, in part, to rhodopsin, the light receptor that initiates phototransduction in the rod outer segments (ROS)5 of retinal photoreceptor cells (4). Rhodopsin can directly associate with this bivalent metal ion (5, 6), and Zn2+ increases the level of rhodopsin phosphorylation (7). Furthermore, changes are observed in the pattern of thermal bleaching and regeneration of rhodopsin by 11-cis-retinal in the presence and absence of Zn2+ (6, 8). Therefore, Zn2+ appears to affect the structure and function of rhodopsin.
Rhodopsin in native ROS disc membranes has been previously characterized by single-molecule force spectroscopy (SMFS) to reveal the molecular interactions that stabilize the dark state of the receptor (9). The receptor is organized into several stable structural segments that present barriers to unfolding. Forces required to unfold these segments provide a direct measure of the molecular interactions stabilizing the protein in a particular region. SMFS has also been used to characterize the molecular interactions underlying the stability of a few other membrane proteins including bacteriorhodopsin and halorhodopsin from Halobacterium salinarium (10, 11), the sodium/proton antiporter NhaA from Escherichia coli (12), and human aquaporin-1 (13). The sensitivity of SMFS assays enables one to probe the effects of environmental factors like temperature, pH, ion concentration, and oligomeric assembly on the molecular interactions stabilizing a protein (12, 14-16).
In the current study, we use SMFS to monitor the effect of Zn2+ on molecular interactions stabilizing dark-state rhodopsin. Force-distance (F-D) curves obtained from native bovine ROS disc membranes in the presence of Zn2+ revealed that the location of stable structural segments in rhodopsin is unaffected by the inclusion of this bivalent metal ion. However, forces required to unfold these segments in the presence of Zn2+ were significantly increased. Thus, Zn2+ appears to strengthen the molecular interactions that stabilize the native structure of rhodopsin.
EXPERIMENTAL PROCEDURES
ROS Disc Membrane Preparation
All experimental procedures were carried out under dim red light. Centrifugation steps were performed at 4 °C. ROS were purified from fresh bovine retinas as described (17) and stored at −80 °C. To obtain disc membranes, ROS membranes were resuspended using a glass hand-held homogenizer with 13 ml of buffer A (2 mm Tris-HCl, pH 7.4) and incubated overnight at 4 °C. The membrane suspension was centrifuged at 26,500 × g for 30 min. Membranes were then washed twice with 13 ml of buffer A and three times with 3 ml of buffer B (2 mm Tris-HCl, 150 mm NaCl, 2 mm EDTA, pH 7.4), after collecting each time by centrifugation at 26,500 × g for 30 min. Membranes resuspended in buffer A were used for SMFS and atomic force microscopy (AFM) imaging. Alternatively, membranes were resuspended in buffer C (67 mm potassium phosphate, 1 mm magnesium acetate, 0.1 mm EDTA, 1 mm dithiothreitol, 18% sucrose, pH 7.0) and stored at −80 °C. Membranes stored in buffer C were washed twice with buffer A prior to SMFS studies.
SMFS
SMFS was performed as described previously (9). Disc membranes were adsorbed onto freshly cleaved mica surface. Rhodopsin was attached nonspecifically to Si3N4 cantilevers (NPS, Veeco Metrology; nominal spring constant ≈0.08 newton/m) by applying a contact force of ≈1 nN between the AFM stylus and the membrane surface. After a contact time of ≈0.5–1 s, the stylus was retracted from the membrane surface at a constant velocity of 300 nm/s. Experiments were performed on Picoforce (dI-Veeco, USA) and Multimode (dI-Veeco, USA) AFM instruments. Spring constants for AFM cantilevers were calibrated in buffer solution by use of the equipartition theorem (18, 19). All cantilevers exhibited similar spring constants within the uncertainty of the calibration method (≈10%).
All SMFS experiments were performed in SMFS assay buffer (150 mm KCl, 25 mm MgCl2, 20 mm Tris, pH 7.8) at room temperature, unless indicated otherwise. In experiments where membranes were treated with ZnCl2 (Fluka, Sigma), CaCl2 (Merck, Sigma), CdCl2 (Sigma), CoCl2 (Sigma), or CuCl2 (Sigma), the assay buffer was supplemented with the specified concentrations of bivalent metal ions. ROS disc membranes were diluted in assay buffer supplemented with metal ions and incubated on ice for 40–60 min in complete darkness. When membranes were treated with EDTA (Sigma), MgCl2 was excluded from the assay buffer. F-D curves were collected over a period of less than 1 h.
Selection and Analysis of F-D Curves
F-D curves were first separated based on length (9). All F-D curves exhibiting similar overall unfolding spectra and lengths were selected and aligned using identical procedures and criteria established previously (20). Every peak of a single F-D curve was fitted using the worm-like chain (WLC) model with a persistence length of 0.4 nm (21). The number of extended amino acid residues at each peak was calculated from the contour length obtained from the WLC fits assuming an amino acid residue length of 0.36 nm. This approach allowed assignment of unfolding events to structural segments of rhodopsin as described previously (20).
Molecular Dynamics (MD) Simulations
Rhodopsin monomers and dimers were immersed in a membrane composed of dipalmitoylphosphatidylcholine phospholipids. The final system contained 153 dipalmitoylphosphatidylcholine molecules for the rhodopsin monomer (Protein Data Bank code 1U19) and 105 for the rhodopsin dimer (PDB code 1N3M). Positions of Zn2+ were taken from the most updated rhodopsin crystal structures: site 1 from 1GZM and sites 2–4 from 1U19. Periodic box dimensions were 6.33 × 6.33 ×11.0 and 10.0 × 6.33 × 11.0 nm for the rhodopsin monomer and dimer, respectively. Each Zn2+ was given a charge of +2. A simple point charge water model (22) was used and counterions were added to maintain an overall charge equal to zero. The particle mesh Ewald procedure (23, 24) was used for treatment of long-range electrostatic interactions. Initial equilibration of the system was performed by 500 ps MD with Cα atoms of rhodopsin and all Zn2+ frozen. During subsequent 1000 ps MD the Cα atoms and Zn2+ were restrained to their initial positions using harmonic potentials. In MD simulations testing the stability of Zn2+ in its binding sites, Zn2+ was initially positioned in each of the crystal structure binding sites with the freedom to move and Cα atoms of rhodopsin were restrained to their initial positions with harmonic potential. MD simulations were conducted in Gromacs (25) using the standard ffgmx forcefield modified for describing lipids (26).
RESULTS
Unfolding Single Rhodopsin Molecules from Native ROS Disc Membranes
Native ROS disc membranes containing rhodopsin were studied by SMFS (9). Discs flatly adsorbed onto supporting mica were predominantly burst open and displayed a raft-like organization of rhodopsin (9, 27). Single rhodopsin molecules were attached nonspecifically to an AFM stylus. This molecular bridge established between the AFM stylus and the receptor was used to exert a mechanical pulling force sufficient to unfold the protein.
The nonspecific nature of protein attachment to the AFM stylus resulted in interactions with both the terminal region and loops of rhodopsin. Only curves with lengths corresponding to the full-length of the rhodopsin polypeptide chain were selected for analysis. This selection criterion ensured that the F-D curves analyzed represent the unfolding of rhodopsin from its terminal region into an entirely stretched conformation. Previous characterization of disc membranes by SMFS revealed that the membranes adsorbed onto the supporting mica predominantly expose the extracellular surface of rhodopsin (9). Thus, SMFS pulling occurs from the amino-terminal region of rhodopsin.
Two major classes of F-D curves were detected that correspond to the unfolding of an entire rhodopsin polypeptide chain. Curves with a length of ≈65 nm correspond to the unfolding of rhodopsin with an intact native disulfide bond between Cys110 and Cys187 and curves of length ≈95 nm correspond to the unfolding of rhodopsin in the absence of the native disulfide bond (9). Only curves of length ≈65 nm were considered in WLC model analyses (Fig. 1). Each force peak of F-D curves was fit using the WLC model, which describes the stretching of a polymer of a given length (21). This procedure revealed the number of unfolded residues stretched above the membrane surface for a particular force peak, and allowed us to locate molecular interactions established by the protein and map such information on to the secondary structure of rhodopsin (Fig. 2).
FIGURE 1. Single-molecule force spectroscopy on ROS disc membranes.
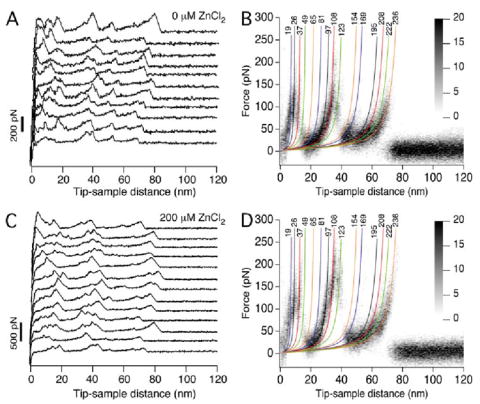
F-D curves were recorded from disc membranes in SMFS assay buffer (A and B) or in SMFS assay buffer supplemented with 200 μm ZnCl2 (C and D). Curves obtained from samples in SMFS assay buffer devoid of ZnCl2 were those reported previously (9). Only curves that exhibited lengths corresponding to the unfolding of a rhodopsin polypeptide chain with an intact Cys110–Cys187 bond (≈65 nm) were analyzed (A and C), and a selection of F-D curves is shown for each condition tested (B and D). Several F-D curves were superimposed (B, n = 42; D, n = 34) to highlight peaks that occurred with high frequency (black) and those that occurred with lower frequency (gray shaded). Each peak in the individual F-D curves was fit with the WLC model to reveal the number of amino acid residues stretched between the probe and the membrane surface. Average values are shown above each fit, and the color of each fit corresponds to the coloring of stable structural segments in Fig. 2.
FIGURE 2. Secondary structure of rhodopsin mapped with stable structural segments.
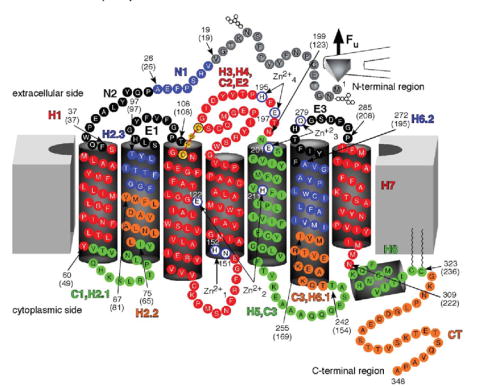
Values from WLC model fitting (Table 1, Fig. 1) were used to estimate the location of stable structural segments in the secondary structure of rhodopsin. Each stable structural segment and its name is colored differently. Arrows indicate the start and end of each structural segment, and the corresponding amino acid residue number is indicated. Numbers in brackets are the values obtained from WLC model fits, which indicate the number of amino acid residues stretched above the membrane. Zn2+-binding sites observed in crystal structures of rhodopsin are shown in white. Amino acid residues that coordinate Zn2+ at those sites are as follows: , Asn151 and His152; , Glu122 and His211; , Glu201 and Gln279; , Glu197 and His195.
Zn2+ Binding Increases the Stability of Rhodopsin
To examine the effect of Zn2+ on the molecular interactions established within rhodopsin we performed SMFS on disc membranes in SMFS assay buffer supplemented with 200 μm ZnCl2. F-D curves revealed the same location for each stable structural segment as that detected in the absence of ZnCl2 (Fig. 1, Table 1). The presence of Zn2+ increased unfolding forces and thus the strength of molecular interactions stabilizing structural segments (Fig. 3A, Table 1). Increased unfolding force was observed for all segments except for the first stable structural segment of the NH2-terminal region (N1) and the stable structural segment involving helix VII (H7). The largest force increases were observed in the four structural segments contained between extracellular loop E1 and helix VI (E1; H3, H4, C2, E2; H5, C3; H6.1). Forces required to unfold these segments were 40–46 pN higher in the presence of 200 μm ZnCl2 than in its absence. Other segments that displayed appreciable increases in unfolding force include helix I (27 pN) and the cytoplasmic tail (30 pN). All other structural regions showed more minor increases in unfolding force. The increase in forces required to overcome unfolding barriers in the presence of 200 μm ZnCl2 points to a stabilizing effect of Zn2+ on the molecular interactions in those regions.
Table 1.
Unfolding forces of stable structural segments
| Secondary structurea | Structural segmentb | Polypeptide segment (aa)c | Average contour length ± SD (aa)d | Average unfolding force ± SD (pN)a | |||||||||||
|---|---|---|---|---|---|---|---|---|---|---|---|---|---|---|---|
| ZnCl2 (μm) | ZnCl2 (μm) | 1 mm EDTA | 200 μm CaCl2 | 200 μm CdCl2 | 200 μm CoCl2 | ||||||||||
| 0f | 200 | 0f | 10 | 25 | 50 | 100 | 200 | 400 | |||||||
| N-terminal region | N1 | 20-26 | 19 ± 2 | 19 ±2 | 131 ± 38
(106) |
109 ± 37
(117) |
108 ± 31
(141) |
129 ± 43
(122) |
134 ± 40
(93) |
130 ± 39
(63) |
130 ± 39
(76) |
116 ± 33
(65) |
109 ± 30 (51) | 125 ± 39 (56) | 104 ± 28
(62) |
| N-terminal region | N2 | 27-37 | 26 ± 2 | 27 ± 2 | 139 ± 38
(121) |
121 ± 36
(117) |
120 ± 38
(128) |
151 ± 51
(138) |
147 ± 43
(89) |
152 ± 40
(67) |
139 ± 41
(81) |
126 ± 32
(70) |
125 ± 37
(57) |
125 ± 40
(58) |
112 ± 28
(59) |
| Helix I | H1 | 38-60 | 37 ± 3 | 37 ± 3 | 132 ± 46
(116) |
124 ± 38
(122) |
124 ± 41
(121) |
155 ± 49
(136) |
146 ± 50
(98) |
159 ± 53
(68) |
141 ± 44
(77) |
119 ± 37
(66) |
126 ± 40
(60) |
125 ± 35 (56) | 112 ± 35
(51) |
| Loop C-I | C1 | 61-75 | 49 ± 5 | 49 ± 5 | 117 ± 47
(41) |
98 ± 39
(50) |
112 ± 51
(49) |
135 ± 57
(82) |
128 ± 51
(47) |
125 ± 59
(48) |
112 ± 55
(42) |
112 ± 56
(26) |
113 ± 46
(28) |
106 ± 43
(30) |
91 ± 40
(23) |
| Helix II | H2.1 | 76-87 | 65 ± 5 | 66 ± 6 | 96 ± 34
(26) |
89 ± 41
(22) |
74 ± 25
(14) |
100 ± 45
(29) |
90 ± 31
(37) |
108 ± 62
(16) |
99 ± 47
(20) |
90 ± 47
(11) |
74 ± 32
(14) |
97 ± 51
(8) |
80 ± 41
(9) |
| Helix II | H2.2 | 88-97 | 81 ± 4 | 82 ± 4 | 89 ± 34
(23) |
76 ± 27
(38) |
82 ± 30
(76) |
90 ± 36
(63) |
104 ± 39
(67) |
103 ± 45
(24) |
100 ± 40
(48) |
82 ± 48
(17) |
94 ± 41
(22) |
94 ± 31
(10) |
75 ± 30
(14) |
| Loop E-I | E1 | 98-108 | 97 ± 4 | 96 ± 3 | 106 ± 38
(118) |
103 ± 31
(146) |
119 ± 35
(161) |
132 ± 45
(175) |
142 ± 49
(130) |
152 ± 44
(85) |
136 ± 41
(114) |
101 ± 36
(70) |
103 ± 30
(59) |
117 ± 37
(67) |
99 ± 32
(57) |
| Helices III & IV, loops C-II & E-II | H3, H4, C2, E2 | 109-199 | 108 ± 2 | 107 ± 1 | 158 ± 53
(187) |
146 ± 37
(165) |
153 ± 40
(175) |
184 ± 53
(198) |
198 ± 54
(139) |
198 ± 50
(105) |
197 ± 52
(129) |
148 ± 42
(87) |
149 ± 40
(82) |
174 ± 42
(84) |
146 ± 41
(73) |
| Helix V & loop C-III | H5, C3 | 200-242 | 123 ± 5 | 121 ± 4 | 138 ± 45
(146) |
136 ± 40
(131) |
151 ± 47
(153) |
167 ± 53
(156) |
182 ± 58
(119) |
180 ± 57
(92) |
177 ± 50
(94) |
127 ± 41
(72) |
152 ± 48
(68) |
173 ± 44
(68) |
126 ± 42
(64) |
| Helix VI | H6.1 | 243-255 | 154 ± 4 | 138 ± 6 | 85 ± 34
(17) |
85 ± 31
(25) |
103 ± 42
(30) |
103 ± 34
(32) |
114 ± 41
(33) |
125 ± 27
(10) |
119 ± 34
(23) |
86 ± 20
(11) |
90 ± 41
(9) |
78 ± 12
(4) |
94 ± 43
(10) |
| Helix VI | H6.2 | 256-272 | 169 ± 6 | 170 ± 7 | 81 ± 34
(127) |
70 ± 35
(91) |
63 ± 20
(98) |
79 ± 35
(122) |
90 ± 47
(86) |
93 ± 47
(44) |
77 ± 38
(56) |
63 ± 14
(72) |
67 ± 33
(53) |
81 ± 31
(35) |
66 ± 37
(42) |
| Loop E-III | E3 | 273-285 | 195 ± 5 | 192 ± 6 | 79 ± 32
(30) |
69 ± 30
(35) |
65 ± 24
(52) |
85 ± 43
(48) |
76 ± 34
(44) |
92 ± 44
(34) |
81 ± 45
(45) |
64 ± 26
(14) |
73 ± 31
(12) |
77 ± 36
(19) |
92 ± 41
(15) |
| Helix VII | H7 | 286-309 | 208 ± 3 | 209 ± 3 | 99 ± 40
(46) |
83 ± 30
(49) |
81 ± 30
(75) |
94 ± 38
(78) |
97 ± 34
(71) |
93 ± 37
(46) |
96 ± 50
(58) |
91 ± 36
(40) |
81 ± 24
(39) |
80 ± 32
(32) |
77 ± 35
(25) |
| Helix 8 | H8 | 310-323 | 222 ± 6 | 223 ± 5 | 104 ± 44
(142) |
88 ± 37
(97) |
96 ± 37
(132) |
107 ± 44
(135) |
122 ± 47
(106) |
118 ± 43
(78) |
108 ± 42
(98) |
89 ± 37
(69) |
99 ± 34
(55) |
97 ± 45
(59) |
89 ± 41
(49) |
| C-terminal region | CT | 324-348 | 236 ± 6 | 236 ± 5 | 109 ± 47
(114) |
94 ±33
(109) |
120 ± 40
(117) |
119 ± 54
(115) |
133 ± 62
(73) |
139 ± 43
(46) |
128 ± 48
(75) |
103 ± 39
(55) |
113 ± 43
(35) |
107 ± 46
(51) |
101 ± 33
(40) |
Secondary structure(s) involved in the stable structural segment.
Name given for each stable structural segment.
Polypeptides that establish a structural segment. The first position in the polypeptide was determined from fitting force peaks to the WLC model.
Average number of amino acid residues (aa) stretched above the membrane obtained by fitting force peaks to the WLC model.
Average unfolding force calculated from force peaks. The number of F-D curves used in the calculations is shown in parentheses.
Data are those reported previously (9).
FIGURE 3. Specificity of ZnCl2 effects on rhodopsin.
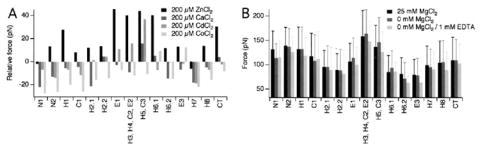
A, F-D curves were collected from disc membranes in SMFS assay buffer supplemented with 200 μm ZnCl2, CaCl2, CdCl2, or CoCl2. The average force required to unfold each stable structural segment in rhodopsin observed in the presence of bivalent metal ions is shown relative to the average force observed in the absence of added bivalent metal ions. B, F-D curves were collected from disc membranes in SMFS assay buffer (25 mm MgCl2), in SMFS assay buffer devoid of MgCl2 (0 mm MgCl2), or in SMFS assay buffer devoid of MgCl2 and supplemented with 1 mm EDTA (0 mm MgCl2, 1 mm EDTA). The average force obtained from each condition is shown. Error bars represent the standard deviation. Values represented in the figure are given in Table 1.
The dependence of the apparent stabilization of stable structural segments on Zn2+ concentration was characterized by performing SMFS in the presence of ZnCl2 at concentrations ranging from 0 to 400 μm (Fig. 4). All structural segments exhibiting an appreciable increase in stability in the presence of 200 μm ZnCl2 showed a clear concentration-dependent relationship with saturation occurring at ≈100 μm of the bivalent metal ion. Estimates of the EC50 for these effects were determined from concentration-dependent curves. EC50 values of 40 and 37 μm were obtained from concentration-dependent curves for structural segments H3, H4, C2, E2 and H5, C3, respectively. The EC50 values revealed from SMFS measurements are in agreement with the equilibrium dissociation constant (KD) of 2–10 μm determined biochemically for Zn2+ binding to rhodopsin (5).
FIGURE 4. Effect of different ZnCl2 concentrations on unfolding forces.
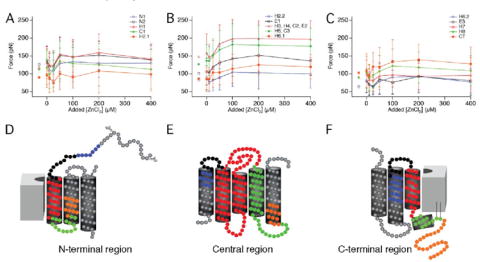
The average force required to unfold each stable structural segment was recorded at increasing concentrations of ZnCl2 (0–400 μm) added to SMFS assay buffer (A–C). The color of the curves corresponds to the structural segments highlighted in D–F. Symbols placed at added [ZnCl2] of less than 0 μm represent data from F-D curves collected in SFMS assay buffer devoid of MgCl2 and in the presence of 1 mm EDTA. Error bars represent the standard deviation. Values represented in the figure are given in Table 1.
Disc membranes studied in SMFS assays were prepared in buffer containing 2 mm EDTA, so most of the free and solvent-exposed Zn2+ should be absent. To test the completeness of Zn2+ chelation, we collected F-D curves in the presence of 1 mm EDTA. The standard SMFS assay buffer used in this study contained 25 mm MgCl2 (“Experimental Procedures”), which would interfere with the chelation of Zn2+ by EDTA. Accordingly, SMFS of disc membranes done in the presence of EDTA was performed in buffer lacking MgCl2. The absence of MgCl2 in the SMFS assay buffer did not significantly change the forces required to unfold stable structural segments (Fig. 3B). Inclusion of 1 mm EDTA resulted in a minor decrease in the externally applied force required to unfold many of the stable structural segments. A Zn2+-binding site has been proposed to reside within the transmembrane helices of rhodopsin (6), which would be inaccessible to EDTA during the preparation of membranes. Unfolding of rhodopsin during SMFS might expose this site to EDTA. The total reduction of forces observed in the presence of EDTA may derive in part from the chelation of this protected Zn2+ during rhodopsin unfolding and in part to a small amount of free or solvent-exposed Zn2+ present even after disc membrane preparation.
Stabilization of Rhodopsin by Zn2+ Is Specific
To determine whether the apparent stabilization of stable structural segments was due specifically to Zn2+ rather than to nonspecific electrostatic effects, other bivalent metal ions were tested. SMFS assays were performed in the presence of 200 μm CaCl2, CdCl2, CoCl2, or CuCl2. F-D curves obtained in the presence of 200 μm CuCl2 did not show any specific peaks corresponding to stable structural segments like the other metal ions (data not shown) and were not included in the analyses. Each of the other bivalent metal ions tested exhibited the same stable structural segments as those observed in the absence of added metal ions and in the presence of 200 μm ZnCl2 (Fig. 1). However, none of those bivalent metal ions were able to mimic the full effects on the magnitude of unfolding forces observed in the presence of ZnCl2 (Fig. 3A), which suggests that the apparent stabilizationafforded by Zn2+ binding is specific.
The increase in force required to overcome unfolding barriers observed in the presence of 200 μm ZnCl2 were partially reproducible at a couple of the stable structural segments in thepresence of CdCl2 and CoCl2. In the presence of CoCl2, F-Dcurves displayed an equal increase in unfolding force for structural segment E3 as that observed in the presence of ZnCl2. F-D curves recorded in the presence of CdCl2 showed a marked but lower increase in unfolding force compared with those obtained with ZnCl2 in segment H5, C3. The ability of Co2+ Cd2+ to partially mimic the effects of Zn2+ in those specific segments may indicate that these ions bind, to some extent, to Zn2+-binding sites responsible for those regions.
Effect of Zn2+ on the Native Disulfide Bond between Cys110–Cys187
The native disulfide bond between Cys110 and Cys187 in rhodopsin is highly conserved among Family A G protein-coupled receptors (GPCRs) and stabilizes the structure of this receptor. In SMFS studies, the native disulfide bond between Cys110 and Cys187 in rhodopsin remains intact in some instances but is absent in others (9), resulting in two classes of F-D curves. The presence of the native disulfide bond of rhodopsin reduces the effective length of the entirely stretched polypeptide chain by 77 amino acid residues, which resulted in F-D curves with a length of ≈65 nm. F-D curves exhibiting lengths of ≈95 nm are indicative of a stretched rhodopsin molecule in the absence of the native disulfide bond. The native Cys110–Cys187 disulfide bond is likely replaced by a non-native disulfide bond between Cys185 and Cys187 during unfolding in these instances (9). Formation of this alternative covalent bond can be favored by environmental changes or by naturally occurring point mutations that cause destabilization or misfolding of rhodopsin, which leads in turn to retinitis pigmentosa (9, 28, 29), a neurodegenerative disease causing blindness.
The ratio of the two classes of F-D curves was determined for each of the different ZnCl2 concentrations tested (Fig. 5). The proportion of curves representing the unfolding of rhodopsin with an intact Cys110–Cys187 disulfide bond became greater as the concentration of ZnCl2 was increased in the assay buffer. Thus, Zn2+ appears to stabilize or favor the maintenance of this disulfide bond. An increase in the proportion of curves corresponding to the unfolding of rhodopsin in the presence of the Cys110–Cys187 bond was also observed in the presence of CaCl2, CdCl2, and CoCl2. Whereas the apparent stabilization of rhodopsin indicated by increases in pulling force required to unfold structural segments appears to be a specific effect of Zn2+, the stabilization and preservation of the Cys110–Cys187 disulfide bond appears to be a result of nonspecific electrostatic effects. This nonspecific effect can involve hydrophilic residues in close proximity to Cys110 and Cys187. Alternatively, the bivalent metal ions may alter the surrounding lipid bilayer in a manner that favors the preservation of the native Cys110–Cys187 disulfide bond.
FIGURE 5. Preservation of the Cys110–Cys187 disulfide bond by nonspecific electrostatic effects.
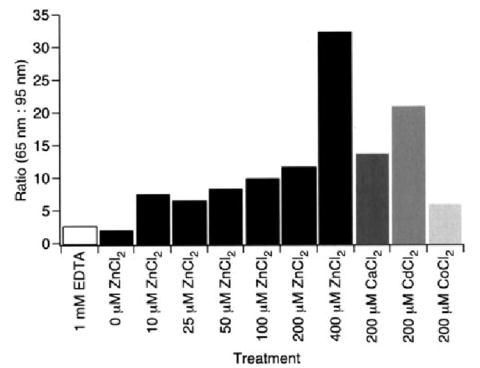
Ratios of F-D curves corresponding to the unfolding of rhodopsin in the presence (65 nm) and absence (95 nm) of the Cys110–Cys187 disulfide bond are shown. F-D curves were obtained from samples either in SMFS assay buffer supplemented with bivalent metal ions or in SMFS assay buffer without added MgCl2 and supplemented with 1 mm EDTA. The number of curves used to calculate the ratio is as follows: 1 mm EDTA, 264; 0 μm ZnCl2, 274; 10 μm ZnCl2, 187; 25 μm ZnCl2, 202; 50 μm ZnCl2, 222; 100 μm ZnCl2, 315; 200 μm ZnCl2, 114; 400 μm ZnCl2, 133; 200 μm CaCl2, 89; 200 μm CdCl2, 88; 200 μm CoCl2, 85.
DISCUSSION
SMFS on bovine ROS disc membranes was performed to elucidate the role of Zn2+ in the structure of rhodopsin. F-D curves record the unfolding pathway of individual rhodopsin molecules and provide information about the molecular interactions that stabilize the protein. Molecular interactions of the receptor stabilize structural segments that establish barriers to unfolding. The magnitude of the force required to unfold stable structural segments reflects the strength of molecular interactions stabilizing that segment (35, 36).
The presence of ZnCl2 in SMFS assay buffer resulted in an increase in the force required to unfold most of the stable structural segments of the receptor. The location of the stable structural segments, however, remained unchanged. The Zn2+-induced increase in the unfolding force of stable structural segments was saturable and specific to Zn2+. Thus, Zn2+ interacts specifically with rhodopsin and can alter molecular interactions within the protein that stabilizes the structure of the receptor.
The stability of rhodopsin is often inferred from thermal bleaching studies. ZnCl2 (15–100 μm) increases the rate of thermal bleaching of rhodopsin, both in solution and in ROS membranes (6, 8), suggesting that exogenous Zn2+ decreases the thermal stability of the protein. This effect is in apparent disagreement with the SMFS data. Both the SMFS and thermal bleaching data point to an effect on the structure of the receptor molecule. Thermal bleaching assays indirectly detect effects on the structure of the receptor by measuring the hydrolysis of the chromophore. It may be incorrect to assume a direct correlation between the hydrolysis rate of the chromophore and the structural stability of rhodopsin. Hence, SMFS may provide a better measure of protein stability because it directly detects molecular interactions occurring within a protein.
Is the Effect of Zn2+ Physiologically Relevant?
The eye has one of the largest pools of Zn2+ in the human body and the retina, in particular, contains one of the highest concentrations of Zn2+ in ocular tissues (2, 37). Significant levels of chelatable Zn2+ are found in photoreceptor cells (38-40). The concentration of free Zn2+ in photoreceptor cells, however, is unknown. If the concentration of free Zn2+ in photoreceptor cells is comparable with those found in brain then it could reach the micromolar range (41). This range of Zn2+ concentration suggests that the effects observed in the current study can be physiologically significant.
A Zn2+-binding site in rhodopsin has been proposed to involve His211 (6). H211P is a naturally occurring point mutation that causes misfolding and results in retinitis pigmentosa. Misfolding of this and other point mutants of rhodopsin results in the replacement of the native disulfide bond between Cys110 and Cys187 by the non-native disulfide bond between Cys185 and Cys187 (29). Disruption of the Zn2+-binding site involving His211 has been proposed to underlie the mechanism of these effects (6). Thus, Zn2+ may stabilize and promote the proper folding of rhodopsin.
Zn2+-binding Sites in Rhodopsin
Zn2+ can bind to purified rhodopsin, rhodopsin in disc membranes, and rhodopsin in three-dimensional crystals (5, 6, 30-34). The binding site for Zn2+ is specific for this bivalent metal ion because no other bivalent metal ion except Cu2+ can fully displace radioactive Zn2+ bound to rhodopsin in disc membranes (5). Cd2+ and Co2+ can partially compete with radioactive Zn2+, which may explain their ability to partially mimic the effect of Zn2+ at a few of the stable structural segments in rhodopsin. The specificity of Zn2+-binding sites is further supported by the observation that Zn2+-induced effects on the thermal bleaching of rhodopsin cannot be mimicked by other bivalent metal ions (8).
Sites in rhodopsin that were occupied by Zn2+ in crystal structures of the receptor in its inactive dark state are shown in Fig. 6A (30-34). These are the same sites considered elsewhere (6), except we have excluded a site that bridges a non-physiological dimer interface occurring only in three-dimensional crystals (32). The concentration of Zn2+ under crystallization conditions is extremely high (65–90 mm) so all of the sites observed in crystal structures of rhodopsin may not be physiologically relevant.
FIGURE 6. Side view of a rhodopsin dimer model.
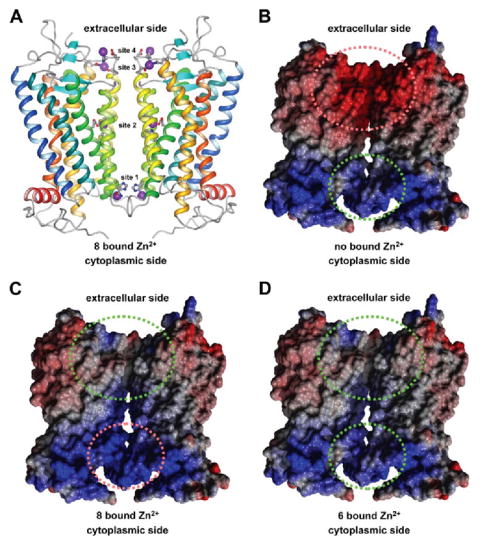
A, the position of Zn2+ in binding sites observed in crystal structures of rhodopsin are highlighted as purple spheres. Helices of rhodopsin are colored as follows: H-I in blue, H-II in blue-green, H-III in green, H-IV in green-yellow, H-V in yellow, H-VI in orange, H-VII and H-8 in red Amino acid residues that coordinate Zn2+ are shown in ball-and-stick representations. The figure was drawn using MolMol (57). B–D, the electrostatic potential is shown for a rhodopsin dimer without bound Zn2+ (B), with 8 bound Zn2+ (sites 1–4) (C), and with 6 bound Zn2+ (sites 2–4) (D). The electrostatic potential is colored follows: blue, positive; red, negative; white, neutral. Green and red dashed ellipses indicate favorable and unfa vorable electrostatic interactions, respectively. B–D were drawn using Yasara (version 6.2 Yasara Biosciences, Graz, Austria).
The stability of Zn2+ in each of the crystal structure Zn2+-binding sites was tested by MD simulations. Such simulations revealed that Zn2+ at sites 2–4 did not change locations within their binding sites, which suggests that Zn2+ binding at these sites is stable. In contrast, Zn2+ at site 1 moved significantly out of its binding site, which suggests that Zn2+ binding at this site is unstable and likely to be non-physiological. The Zn2+-binding site buried within the transmembrane helices (site 2) has been confirmed by mutagenesis studies (6).
Zn2+-binding sites have been determined by mutagenesis in other GPCRs (42-46). Mutations at such sites either abolish or significantly attenuate the effects of Zn2+ on the binding properties of GPCR ligands. The investigated sites were localized to solvent-accessible regions in the extracellular and cytoplasmic exposed sides of the receptors.
Zn2+ Binding Has a Global Effect on Rhodopsin
Whether the effect of Zn2+ on rhodopsin is local or global has not been studied to date. It has been proposed that the folding of rhodopsin is a highly cooperative process and that long-range interactions contribute to the stability and function of this protein (47). Within such a framework, the effect of changes at one location in the protein would not be localized to that region, but rather, could propagate to other areas resulting in global effects rather than just local ones. This framework is reflected in retinitis pigmentosa point mutations in rhodopsin that demonstrate the tight functional and structural coupling of transmembrane domains and the extracellular region (29, 48, 49).
In the sodium-proton antiporter NhaA, binding of the ligand Na+ results in a highly localized effect that does not perturb molecular interactions in neighboring helices (12). The localized effect of Na+ binding is detected as an additional force peak in F-D curves. The additional peak likely results from interactions established within the region of the ligand-binding site in NhaA. In contrast, the binding of Zn2+ to rhodopsin did not change the molecular interactions of a single stable structural segment but rather increased the force required to unfold most of the detected stable structural segments. This observation points to a stabilizing effect that is not confined locally to regions in close proximity to Zn2+-binding sites, but rather, is propagated throughout the entire molecule.
Although the global effect of Zn2+ increased the unfolding force of stable structural segments, the magnitude of these changes was not the same across all segments. The global effect of Zn2+ affected each of the stable structural segments differently, and the nature of those changes requires further investigation. Surprisingly, the COOH-terminal region (cytoplasmic tail) showed a marked increase in stability in the presence of Zn2+. Because most of the receptor molecule is unfolded out of the membrane during unfolding of this region, all of the molecular interactions with the rest of the receptor would be absent and the global stabilizing effects of Zn2+ should be absent as well. Assuming a dimeric model of rhodopsin, the COOH-terminal region would be in contact with an adjacent rhodopsin molecule (50). Thus, the observed increase in force of this segment may derive from molecular interactions involving regions in the partner rhodopsin molecule.
Implications of Zn2+ Binding on the Oligomeric Nature of Rhodopsin
Upon close examination of the Zn2+-binding sites considered in our study, it is apparent that these sites line up along the putative dimer interface of rhodopsin, which has been proposed based on packing constraints from AFM studies (Fig. 6A) (50, 51). Oligomerization of rhodopsin and other GPCRs has only recently become an appreciated concept and likely plays a central role in the signaling process (52). The binding of Zn2+ to rhodopsin changes the electrostatic potential of the putative dimer interface of the receptor (Fig. 6). Electrostatic interactions at the dimer interface must be optimized for dimerization to occur.
In the absence of bound Zn2+ (Fig. 6B), the contact area at the cytoplasmic side is characterized by a slightly positive electrostatic potential that would not prevent the dimerization of rhodopsin. In contrast, the contact area at the extracellular side has a strong negative potential that would introduce a strong repulsion and thereby hinder dimerization. Binding of Zn2+ to all 8 sites observed in crystal structures eliminates the repulsive negative electrostatic potential at the extracellular contact area (Fig. 6C). However, the electrostatic potential at the cytoplasmic contact area becomes strongly positive and therefore repulsive. The optimal electrostatic potential at the dimer interface of rhodopsin will occur when all Zn2+-binding sites are occupied except for the site at the cytoplasmic surface (Fig. 6D).
SMFS studies on monomeric, dimeric, and trimeric forms of bacteriorhodopsin in purple membranes display similar mechanisms of membrane protein stabilization to those observed in the current investigation (15). F-D curves of different bacteriorhodopsin oligomeric assemblies reveal that the stability of structural segments changes with the oligomeric state. Bacteriorhodopsin present exclusively as monomers exhibits the lowest stability, whereas those present as trimers exhibit the highest stability. The naturally occurring trimeric state of bacteriorhodopsin enhances the stability of almost every structural segment established within the molecule. Similar to rhodopsin, some structural segments were stabilized to a greater extent than others. Assembly of bacteriorhodopsin into trimers appears to be a natural mechanism to enhance the stability of the protein. This mechanism allows for proper function of the light-driven proton pump under the harsh environmental conditions encountered by H. salinarium. A similar stabilizing mechanism may also exist in rhodopsin dimers. Localization of crystal structure Zn2+-binding sites at the dimer interface of rhodopsin suggests that this bivalent metal ion modulates the intermolecular interactions between adjacent rhodopsin molecules that in turn modulate intramolecular interactions to enhance the stability and function of this receptor.
Zn2+ and Other GPCRs
Rhodopsin is a prototypical member of the GPCR superfamily (53), so the potential physiological role of Zn2+ in rhodopsin signaling may extend to other members of the GPCR family. Many GPCRs modulate activities in the central nervous system. The brain, similarly to the eye, contains high concentrations of Zn2+. The concentration of Zn2+ in the brain has been estimated to be 150 μm (1) and it has been suggested that the release of Zn2+ into the synapses of hippocampal neurons can result in local concentrations as high as 300 μm (54). Several GPCRs residing in brain reportedly bind Zn2+ with micromolar binding affinities and modulate the binding properties of agonists, antagonists, and inverse agonists (42, 44-46, 55, 56). Similarly, the dissociation constant of Zn2+ for rhodopsin in disc membrane and purified rhodopsin in the dark has been estimated to be 2–10 μm (5), and the maximal regeneration of rhodopsin by its chromophore is reduced in the presence of Zn2+ (8). These observations suggest that Zn2+ can bind to rhodopsin and other GPCRs under physiological conditions and may play a role in signaling processes.
Acknowledgments
The modeling studies were partly carried out at the ICM Computer Center, Warsaw University, Poland.
Footnotes
This work was supported in part by the Deutsche Forschungsgesellschaft, the Bundesministerium für Bildung und Forschung, Polish Government Grant 3P05F02625, Amgen Inc., and National Institutes of Health Grant EY08061.
The on-line version of this article (available at http://www.jbc.org) contains supplemental Fig. S1.
The abbreviations used are: ROS, rod outer segment; AFM, atomic force microscopy; F-D, force-distance; GPCR, G protein-coupled receptor; MD, molecular dynamics; SMFS, single-molecule force spectroscopy; WLC, worm-like chain.
References
- 1.Weiss JH, Sensi SL, Koh JY. Trends Pharmacol Sci. 2000;21:395–401. doi: 10.1016/s0165-6147(00)01541-8. [DOI] [PubMed] [Google Scholar]
- 2.Grahn BH, Paterson PG, Gottschall-Pass KT, Zhang Z. J Am Coll Nutr. 2001;20:106–118. doi: 10.1080/07315724.2001.10719022. [DOI] [PubMed] [Google Scholar]
- 3.Ugarte M, Osborne NN. Prog Neurobiol. 2001;64:219–249. doi: 10.1016/s0301-0082(00)00057-5. [DOI] [PubMed] [Google Scholar]
- 4.Palczewski K. Annu Rev Biochem. 2006;75:743–767. doi: 10.1146/annurev.biochem.75.103004.142743. [DOI] [PMC free article] [PubMed] [Google Scholar]
- 5.Shuster TA, Nagy AK, Conly DC, Farber DB. Biochem J. 1992;282:123–128. doi: 10.1042/bj2820123. [DOI] [PMC free article] [PubMed] [Google Scholar]
- 6.Stojanovic A, Stitham J, Hwa J. J Biol Chem. 2004;279:35932–35941. doi: 10.1074/jbc.M403821200. [DOI] [PubMed] [Google Scholar]
- 7.Shuster TA, Martin F, Nagy AK. Curr Eye Res. 1996;15:1019–1024. doi: 10.3109/02713689609017650. [DOI] [PubMed] [Google Scholar]
- 8.del Valle LJ, Ramon E, Canavate X, Dias P, Garriga P. J Biol Chem. 2003;278:4719–4724. doi: 10.1074/jbc.M210760200. [DOI] [PubMed] [Google Scholar]
- 9.Sapra KT, Park PS, Filipek S, Engel A, Muller DJ, Palczewski K. J Mol Biol. 2006;358:255–269. doi: 10.1016/j.jmb.2006.02.008. [DOI] [PubMed] [Google Scholar]
- 10.Oesterhelt F, Oesterhelt D, Pfeiffer M, Engel A, Gaub HE, Müller DJ. Science. 2000;288:143–146. doi: 10.1126/science.288.5463.143. [DOI] [PubMed] [Google Scholar]
- 11.Cisneros DA, Oesterhelt D, Müller DJ. Structure (Camb) 2005;13:235–242. doi: 10.1016/j.str.2004.12.005. [DOI] [PubMed] [Google Scholar]
- 12.Kedrov A, Krieg M, Ziegler C, Kuhlbrandt W, Müller DJ. EMBO Rep. 2005;6:668–674. doi: 10.1038/sj.embor.7400455. [DOI] [PMC free article] [PubMed] [Google Scholar]
- 13.Moller C, Fotiadis D, Suda K, Engel A, Kessler M, Muller DJ. J Struct Biol. 2003;142:369–378. doi: 10.1016/s1047-8477(03)00066-2. [DOI] [PubMed] [Google Scholar]
- 14.Janovjak H, Kessler M, Oesterhelt D, Gaub H, Müller DJ. EMBO J. 2003;22:5220–5229. doi: 10.1093/emboj/cdg509. [DOI] [PMC free article] [PubMed] [Google Scholar]
- 15.Sapra KT, Besir H, Oesterhelt D, Muller DJ. J Mol Biol. 2006;355:640–650. doi: 10.1016/j.jmb.2005.10.080. [DOI] [PubMed] [Google Scholar]
- 16.Kedrov A, Ziegler C, Muller DJ. J Mol Biol. 2006;362:925–932. doi: 10.1016/j.jmb.2006.07.049. [DOI] [PubMed] [Google Scholar]
- 17.Papermaster DS. Methods Enzymol. 1982;81:48–52. doi: 10.1016/s0076-6879(82)81010-0. [DOI] [PubMed] [Google Scholar]
- 18.Butt H-J, Jaschke M. Nanotechnology. 1995;6:1–7. [Google Scholar]
- 19.Florin E-L, Rief M, Lehmann H, Ludwig M, Dornmair C, Moy VT, Gaub HE. Biosens Bioelectron. 1995;10:895–901. [Google Scholar]
- 20.Müller DJ, Kessler M, Oesterhelt F, Moller C, Oesterhelt D, Gaub H. Biophys J. 2002;83:3578–3588. doi: 10.1016/S0006-3495(02)75358-7. [DOI] [PMC free article] [PubMed] [Google Scholar]
- 21.Rief M, Gautel M, Oesterhelt F, Fernandez JM, Gaub HE. Science. 1997;276:1109–1112. doi: 10.1126/science.276.5315.1109. [DOI] [PubMed] [Google Scholar]
- 22.van der Spoel D, van Maaren PJ, Berendsen HJC. J Chem Phys. 1998;108:10220–10230. [Google Scholar]
- 23.Darden T, York D, Pedersen L. J Chem Phys. 1993;98:10089–10092. [Google Scholar]
- 24.Essmann U, Perera L, Berkowitz ML, Darden T, Lee H, Pedersen LG. J Chem Phys. 1995;103:8577–8593. [Google Scholar]
- 25.Van Der Spoel D, Lindahl E, Hess B, Groenhof G, Mark AE, Berendsen HJ. J Comput Chem. 2005;26:1701–1718. doi: 10.1002/jcc.20291. [DOI] [PubMed] [Google Scholar]
- 26.Berger O, Edholm O, Jahnig F. Biophys J. 1997;72:2002–2013. doi: 10.1016/S0006-3495(97)78845-3. [DOI] [PMC free article] [PubMed] [Google Scholar]
- 27.Fotiadis D, Liang Y, Filipek S, Saperstein DA, Engel A, Palczewski K. Nature. 2003;421:127–128. doi: 10.1038/421127a. [DOI] [PubMed] [Google Scholar]
- 28.Kono M, Yu H, Oprian DD. Biochemistry. 1998;37:1302–1305. doi: 10.1021/bi9721445. [DOI] [PubMed] [Google Scholar]
- 29.Hwa J, Klein-Seetharaman J, Khorana HG. Proc Natl Acad Sci U S A. 2001;98:4872–4876. doi: 10.1073/pnas.061632798. [DOI] [PMC free article] [PubMed] [Google Scholar]
- 30.Li J, Edwards PC, Burghammer M, Villa C, Schertler GF. J Mol Biol. 2004;343:1409–1438. doi: 10.1016/j.jmb.2004.08.090. [DOI] [PubMed] [Google Scholar]
- 31.Teller DC, Okada T, Behnke CA, Palczewski K, Stenkamp RE. Biochemistry. 2001;40:7761–7772. doi: 10.1021/bi0155091. [DOI] [PMC free article] [PubMed] [Google Scholar]
- 32.Okada T, Fujiyoshi Y, Silow M, Navarro J, Landau EM, Shichida Y. Proc Natl Acad Sci U S A. 2002;99:5982–5987. doi: 10.1073/pnas.082666399. [DOI] [PMC free article] [PubMed] [Google Scholar]
- 33.Okada T, Sugihara M, Bondar AN, Elstner M, Entel P, Buss V. J Mol Biol. 2004;342:571–583. doi: 10.1016/j.jmb.2004.07.044. [DOI] [PubMed] [Google Scholar]
- 34.Palczewski K, Kumasaka T, Hori T, Behnke CA, Motoshima H, Fox BA, Le TI, Teller DC, Okada T, Stenkamp RE, Yamamoto M, Miyano M. Science. 2000;289:739–745. doi: 10.1126/science.289.5480.739. [DOI] [PubMed] [Google Scholar]
- 35.Janovjak H, Kedrov A, Cisneros DA, Sapra KT, Struckmeier J, Muller DJ. Neurobiol Aging. 2006;27:546–561. doi: 10.1016/j.neurobiolaging.2005.03.031. [DOI] [PubMed] [Google Scholar]
- 36.Muller DJ, Sapra KT, Scheuring S, Kedrov A, Frederix PL, Fotiadis D, Engel A. Curr Opin Struct Biol. 2006;16:489–495. doi: 10.1016/j.sbi.2006.06.001. [DOI] [PubMed] [Google Scholar]
- 37.Karcioglu ZA. Surv Ophthalmol. 1982;27:114–122. doi: 10.1016/0039-6257(82)90195-3. [DOI] [PubMed] [Google Scholar]
- 38.Ugarte M, Osborne NN. Gen Pharmacol. 1998;30:297–303. doi: 10.1016/s0306-3623(97)00358-3. [DOI] [PubMed] [Google Scholar]
- 39.Ugarte M, Osborne NN. Exp Eye Res. 1999;69:459–461. doi: 10.1006/exer.1999.0727. [DOI] [PubMed] [Google Scholar]
- 40.Hirayama Y. Acta Histochem. 1990;89:107–111. doi: 10.1016/S0065-1281(11)80328-4. [DOI] [PubMed] [Google Scholar]
- 41.Frederickson CJ. Int Rev Neurobiol. 1989;31:145–238. doi: 10.1016/s0074-7742(08)60279-2. [DOI] [PubMed] [Google Scholar]
- 42.Holst B, Elling CE, Schwartz TW. J Biol Chem. 2002;277:47662–47670. doi: 10.1074/jbc.M202103200. [DOI] [PubMed] [Google Scholar]
- 43.Rosenkilde MM, Lucibello M, Holst B, Schwartz TW. FEBS Lett. 1998;439:35–40. doi: 10.1016/s0014-5793(98)01331-3. [DOI] [PubMed] [Google Scholar]
- 44.Swaminath G, Lee TW, Kobilka B. J Biol Chem. 2003;278:352–356. doi: 10.1074/jbc.M206424200. [DOI] [PubMed] [Google Scholar]
- 45.Liu Y, Teeter MM, DuRand CJ, Neve KA. Biochem Biophys Res Commun. 2006;339:873–879. doi: 10.1016/j.bbrc.2005.11.110. [DOI] [PubMed] [Google Scholar]
- 46.Fowler CB, Pogozheva ID, LeVine H, 3rd, Mosberg HI. Biochemistry. 2004;43:8700–8710. doi: 10.1021/bi036067r. [DOI] [PubMed] [Google Scholar]
- 47.Klein-Seetharaman J. Trends Pharmacol Sci. 2005;26:183–189. doi: 10.1016/j.tips.2005.02.009. [DOI] [PubMed] [Google Scholar]
- 48.Hwa J, Garriga P, Liu X, Khorana HG. Proc Natl Acad Sci U S A. 1997;94:10571–10576. doi: 10.1073/pnas.94.20.10571. [DOI] [PMC free article] [PubMed] [Google Scholar]
- 49.Rader AJ, Anderson G, Isin B, Khorana HG, Bahar I, Klein-Seetharaman J. Proc Natl Acad Sci U S A. 2004;101:7246–7251. doi: 10.1073/pnas.0401429101. [DOI] [PMC free article] [PubMed] [Google Scholar]
- 50.Fotiadis D, Liang Y, Filipek S, Saperstein DA, Engel A, Palczewski K. FEBS Lett. 2004;564:281–288. doi: 10.1016/S0014-5793(04)00194-2. [DOI] [PMC free article] [PubMed] [Google Scholar]
- 51.Liang Y, Fotiadis D, Filipek S, Saperstein DA, Palczewski K, Engel A. J Biol Chem. 2003;278:21655–21662. doi: 10.1074/jbc.M302536200. [DOI] [PMC free article] [PubMed] [Google Scholar]
- 52.Park PS-H, Filipek S, Wells JW, Palczewski K. Biochemistry. 2004;43:15643–15656. doi: 10.1021/bi047907k. [DOI] [PMC free article] [PubMed] [Google Scholar]
- 53.Filipek S, Stenkamp RE, Teller DC, Palczewski K. Annu Rev Physiol. 2003;65:851–879. doi: 10.1146/annurev.physiol.65.092101.142611. [DOI] [PMC free article] [PubMed] [Google Scholar]
- 54.Assaf SY, Chung SH. Nature. 1984;308:734–736. doi: 10.1038/308734a0. [DOI] [PubMed] [Google Scholar]
- 55.Schetz JA, Sibley DR. J Neurochem. 1997;68:1990–1997. doi: 10.1046/j.1471-4159.1997.68051990.x. [DOI] [PubMed] [Google Scholar]
- 56.Schetz JA, Chu A, Sibley DR. J Pharmacol Exp Ther. 1999;289:956–964. [PubMed] [Google Scholar]
- 57.Koradi R, Billeter M, Wuthrich K. J Mol Graph. 1996;14:51–55. doi: 10.1016/0263-7855(96)00009-4. [DOI] [PubMed] [Google Scholar]