Abstract
Snai2, encoded by the SNAI2 gene, has been shown to modulate epithelial-mesenchymal transformation (EMT), the conversion of sessile epithelial cells attached to adjacent cells and to the basement membrane into dissociated and motile fibroblastic cells. EMT occurs during development, wound healing, and carcinoma progression. Using Snai2-null mice (Snai2lacZ), we evaluated the role of Snai2 in UV radiation (UVR)-induced skin carcinogenesis. In chronically UVR-exposed nontumor-bearing skin from Snai2-null mice, inflammation and epidermal proliferation were decreased compared with wild-type (+/+) skin. Snai2-null mice had a consistently lower tumor burden than +/+ mice. In addition, null mice developed fewer aggressive spindle cell tumors, believed to arise from squamous cell carcinomas that have undergone EMT, than +/+ mice; however, the difference in tumor type distribution between the two genotypes was not statistically significant. No metastases were observed in either the +/+ or Snai2-null mice. Using quantitative reverse transcriptase-polymerase chain reaction and immunohistochemistry, we showed that the spindle cell tumors in the Snai2-null mice demonstrated impaired EMT, as shown by decreased vimentin and increased cadherin 1 expression. This study confirms a role for Snai2 in EMT, but demonstrates that Snai2 expression is not required for the development or progression of UVR-induced skin tumors.
The process of epithelial-mesenchymal transformation (EMT) occurs at several stages of embryonic development, including gastrulation and neural crest cell migration.1 EMT is characterized by loss of cell/cell adhesion mediated by desmosomes and adherens junctions, increased secretion of extracellular matrix-degrading proteases, enhanced motility, loss of cytokeratin expression, and de novo expression of vimentin.2 Neoplastic cells may recapitulate these normal developmental processes, exploiting them to foster tumor growth and spread. Certain poorly differentiated carcinomas have been found to lose desmosomes and adherens junctions, express vimentin, acquire a spindle cell phenotype, overexpress proteases, and become highly motile; these changes are associated with enhanced invasive and metastatic potential.1,3,4,5,6 Dysregulation of genes important in developmental EMT has been implicated in these EMT-like processes.7
Two highly conserved members of the Snail family of zinc-finger transcription factors, Snai1 (Snail) and Snai2 (Slug), play roles in developmental EMT.1 Snai1 and Snai2 recognize and bind to the same DNA sequence; however, their transcriptional regulatory activities are not identical,8,9 and they play distinct roles during development, as shown by spatial and temporal differences in their patterns of expression.10 In addition, although Snai1 expression is essential for normal embryonic development in mice, Snai2-null embryos are viable.11 Snai2-null mice are small, with minor craniofacial defects, pigmentary alterations, macrocytic anemia, and increased apoptosis in the thymic cortex.11,12,13 Snai2 also seems to induce EMT-like events in adult epithelial cells. Constitutive expression of murine Snai2 in a rat bladder epithelial cell line in vitro causes dissociation of desmosomes, increased cell spreading, and cell dispersion.14 Our previous studies indicated that SNAI2 expression is induced in keratinocytes undergoing EMT: SNAI2 is expressed at the margins of healing wounds in vitro and in vivo, and expression of exogenous Snai2 in keratinocytes enhances their ability to re-epithelialize wounds in vitro.15 Expression of exogenous SNAI2 in keratinocytes is associated with enhanced migration, decreased desmosome number, redistribution of desmosomal proteins from the cell membrane to the cytoplasm, and decreased integrin expression.15,16
The final stage of malignant progression in mouse epidermal carcinogenesis involves the evolution from squamous cell carcinoma (SCC) to the highly aggressive spindle cell tumor.17 This transition from epithelial to spindle cell morphology resembles EMT and has been associated with epigenetic alterations that include cadherin 1 (Cdh1; E-cadherin) methylation, demethylation of the SNAI1 promoter, and a global decrease in DNA methylation.18 We have shown that UVR exposure induces Snai1 and Snai2 expression in the epidermis of mice.19 Persistent elevation of the encoded mediators in response to chronic UVR exposure may promote the progression of UVR-induced SCC through their ability to modulate cell adhesion, motility, proliferation, and apoptosis.19 To test this prediction, we examined the contribution of Snai2 to the development of UVR-induced nonmelanoma skin tumors in a mouse model. This study was the first to test directly the role of Snai2 in the de novo development of tumors in response to a complete carcinogen. Snai2-null mice developed skin tumors when chronically exposed to UVR, demonstrating that Snai2 expression is not required for skin carcinogenesis. However, the Snai2-null mice had a lower tumor burden and developed fewer aggressive spindle cell tumors than +/+ mice. In addition, the spindle cell tumors in Snai2-null mice had a more epithelial gene expression profile than those in +/+ mice.
Materials and Methods
Mice
Inbred 129S1/SvImJ mice used for this study (originally the kind gift of Dr. Thomas Gridley, Jackson Laboratory, Bar Harbor, ME) have been described previously.11 In these mice, the β-galactosidase gene has been inserted into the Snai2 gene, resulting in the production of a mutant allele (Snai2lacZ) that encodes a fusion protein lacking Snai2 activity. Twenty wild-type (+/+) and 20 Snai2-null mice were included in the study. Thirteen of the mice in each group were females and seven were males. Mice were obtained from a breeding colony maintained at the Ohio State University. The breeding colony was maintained in ventilated microisolator cages; cages were opened and mice were manipulated in a class II biosafety cabinet. Sentinel mice on each rack were housed in contact with soiled bedding and tested quarterly by serology, tape testing, gut maceration, bacterial culture, and PCR for common rodent pathogens, including viruses, parasites, and bacteria. All sentinel mice from the breeding colony remained free of pathogens, except for murine norovirus.
UVR Exposure
UVR was provided by Kodacel-filtered Westinghouse FS-40 lamps that emitted wavelengths between 280 and 400 nm, with a peak at 313. Based on determinations of skin thickness, 1600 J/m2 represented 1 minimal erythemal dose. Beginning at 10 to 12 weeks of age, the mice were exposed to 3200 J/m2 (2 minimal erythemal doses) of UVR three times a week for 50 weeks. Forty-eight hours before the first UVR dose, the mice were shaved and excess hair was removed using Nair. Immediately before the first UVR exposure, skin thickness was determined by measuring the thickness of a skin tent with digital calipers in three different areas of the back; these individual values were then averaged. Skin thickness was measured before every UVR exposure for the first 2 weeks and then once weekly until week 42, when most mice had developed tumors. Once tumors were noted, tumor size and location were monitored weekly. Mice with tumors exceeding 1 cm were removed early from the study. All remaining mice were sacrificed at week 50 by carbon dioxide asphyxiation.
Histopathology
Immediately after death, samples of nontumor skin, the entirety of each tumor less than 3 mm in diameter, and half of each tumor larger than 3 mm in diameter were fixed in 10% neutral buffered formalin. The right inguinal lymph node, cervical lymph nodes, thymus, spleen, mesenteric lymph nodes, liver, kidneys, heart, and lung of each mouse were also fixed for histological examination. Formalin-fixed samples were embedded in paraffin, sectioned at 4- to 5-μm thickness, and stained with hematoxylin and eosin (H&E).
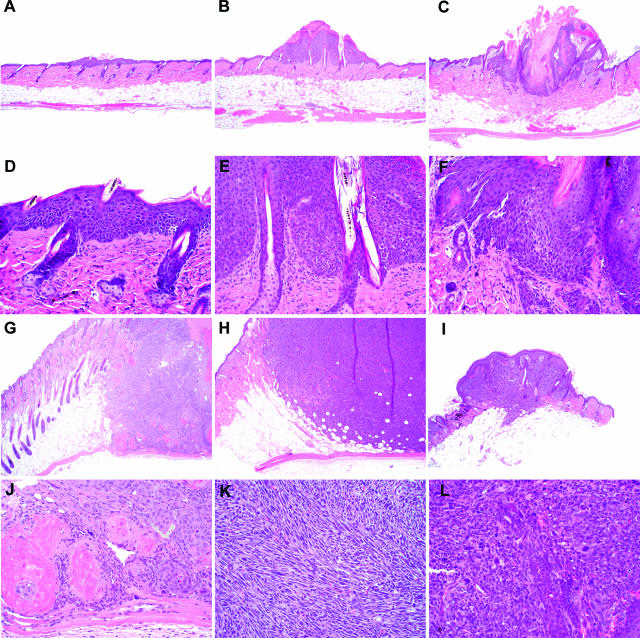
Tumors identified grossly were classified based on their histological appearance as hyperplasia, papillomas, microinvasive squamous cell carcinomas (miSCCs), SCCs, spindle cell tumors, or anaplastic tumors (Figure 1, A–L). Hyperplastic lesions were focal areas of increased epidermal thickness, without significant dysplasia, exophytic growth, or hyperkeratosis. Because these hyperplastic lesions were not true neoplasms, they were excluded from further consideration. A papilloma was defined as a focal area of increased epidermal thickness with an exophytic growth pattern, hyperkeratosis, and minimal dysplastic change. MiSCCs were similar to papillomas, except there was evidence of penetration of the basement membrane with invasion of basal cells into the surrounding stroma; these tumors remained confined to the dermis. SCC demonstrated extensive invasion into the dermis and often invaded the panniculus carnosus. Neoplastic epithelial cells in SCC were frequently dysplastic, and keratin pearls were present. Spindle cell tumors varied in their extent of invasion but demonstrated loss of the epithelial phenotype; most neoplastic cells had a spindleoid morphology, and cornification was not observed. Anaplastic tumors also varied in their extent of invasion; cells were markedly atypical with frequent karyomegaly and numerous mitotic figures.
Figure 1.
Tumors and tumor-like lesions were classified histologically as hyperplasia (A and D), papilloma (B and E), microinvasive SCC (C and F), SCC (G and J), spindle cell tumor (H and K), or anaplastic tumor (I and L). Original magnifications: ×40 (A–C, G–I); ×200 (D–F, J–L).
Immunohistochemistry and Histochemistry
Formalin-fixed paraffin-embedded tissue specimens were sectioned at 4 μm and mounted on glass slides. The specimens were deparaffinized, rehydrated, pretreated with DAKO target retrieval solution (DAKO, Carpinteria, CA) using a digital decloaking chamber (Biocare Medical, Concord, CA) and then heated to 125°C for 30 seconds for antigen retrieval. Peroxidase blocking was performed with a 3% peroxidase solution for 5 minutes. Serum-free protein block (DAKO) was applied for 10 minutes. Primary antibodies included polyclonal rabbit anti-Cd3e (Cd3e; DAKO) diluted 1:100, monoclonal rat anti-mouse keratin 8 (Krt8; Developmental Studies Hybridoma Bank, University of Iowa Department of Biological Sciences, Ames, IA) diluted 1:250, monoclonal rat anti-mouse anti-Ki-67 (Mki67; DAKO) diluted 1:200, and rabbit anti-mouse keratin 14 (Krt14; Covance Research Products, Berkeley, CA) diluted 1:10,000. All antibodies were diluted in DAKO antibody diluent and applied to the slides for 30 minutes. Sections were incubated with biotinylated secondary antibody (rabbit anti-rat, anti-mouse, or anti-rat) (Vector Laboratories, Burlingame, CA) diluted 1:200 in serum-free protein block for 30 minutes, followed by a 30-minute incubation with ABC reagent (R.T.U. Vectastain Elite ABC; Vector Laboratories), a 5-minute incubation with chromogen (liquid DAB substrate; DAKO), and hematoxylin counterstaining. Rinses were performed using DAKO wash buffer (DAKO). The slides were then dehydrated and coverslipped.
For Cdh1 detection, slide preparation, antigen retrieval, and blocking were performed as previously described. The biotinylated goat anti-mouse E-cadherin (Cdh1; R&D Biosystems, Minneapolis, MN) diluted with DAKO antibody diluent to 15 μg/ml and then applied to the slides for 30 minutes. Chromogen development, counterstaining, dehydration, and coverslipping were then performed as previously described. Routine acid fast staining was used to identify dermal mast cells.20
Morphometry
Epidermal thickness was determined using an ocular micrometer. Six different fields per mouse were measured at a magnification of ×600 and the values from each mouse were averaged. The number of dermal neutrophils and mast cells in the nontumor chronically exposed skin was counted on H&E-and acid-fast-stained sections, respectively. Neutrophils and mast cells were counted in six different ×400 fields per mouse, and the values were averaged. Cd3e-positive cells with strong cytoplasmic immunoreactivity were counted in the epidermis and dermis of different ×400 fields. These numbers were averaged for each genotype and compared with the Cd3e-positive cell counts from five +/+ and five null mice not exposed to UVR. In each of these fields, the total number of epidermal cells was also counted, and the number of Cd3e-positive epidermal cells was expressed as a percentage of total epidermal cells. The epidermal cell count also served as an indicator of epidermal thickness.
For Krt8, Krt14, and Cdh1 immunoreactivity, tumors were graded on a scale of 0 to 3. Grade 0 tumors had no immunoreactivity; grade 1 tumors had 1 to 5% immunopositive cells; grade 2 tumors had 5 to 10% immunopositive cells; grade 3 tumors had 10 to 15% immunopositive cells. For Mki67 immunoreactivity, spindle cell tumors were graded on a scale of 1 to 3. Grade 1 tumors had 0 to 25% immunopositive epidermal cell nuclei; grade 2 tumors had 25 to 50% immunopositive nuclei; grade 3 tumors had 50 to 75% immunopositive epidermal nuclei.
Quantitative RT-PCR
Samples of nontumor skin from all mice and half of each tumor larger than 3 mm were frozen in liquid nitrogen for subsequent RNA analysis. Frozen tumor samples were homogenized in TRIzol (Invitrogen, Carlsbad, CA) for RNA isolation. Five μg of pooled total RNA was treated with DNaseI (Ambion, Austin, TX), and cDNA was produced by reverse transcription of 500 ng of this RNA using Superscript II (Invitrogen) and oligo(dT) primers, as directed by the manufacturer. Quantitative RT-PCR was performed using primer sets for glyceraldehyde-3-phosphate dehydrogenase (Gapdh; 5′-TGATGACATCAAGAAGGTGAAC-3′/5′-ATGGCCTTACATGGCCTCCAAGG-3′), Snai2 (5′-GAT- GTGCCCTCAGGTTTGAT-3′/5′-ACACATTGCCTTGTGTC- TGC-3′), Snai1 (5′-CTCACTGCCAGGACTCCTTC-3′/5′- TGTCCAGAGGCTACACCTCA-3′, Cdh1 (5′-GGTCTCTTGTCCCTTCCACA-3′/5′-CCTGACCCACACCAAAGTCT-3′, vimentin (Vim) (5′-AATGCTTCTCTGGCACGTCT-3′/5′-GCTCCTGGATCTCTTCATCG-3′), and matrix metalloprotease-2 (Mmp2; 5′-CACCTACACCAAGAACTTCC-3′/5′-GAACACAGCCTTCTCCTCCT-3′). The Brilliant SYBR Green QPCR mix (Stratagene, La Jolla, CA) was used as directed with 100 nmol/L of each primer in an MX3000P real-time PCR system (Stratagene). Fifty cycles at 94°C (30 seconds), 60°C (30 seconds), and 72°C (30 seconds) were performed. The data analyzed in this study were collected between cycles 15 and 35. The negative controls were consistently negative even after the full 50 amplification cycles. RNA concentrations were calculated using the LinReg PCR program, which uses four points in the best linear region of amplification to determine starting mRNA concentration and PCR efficiency for each sample.21 Gapdh was used as an internal standard to account for efficiency of reverse transcription and amplification. Expression values for each primer set were normalized to Gapdh values. For all quantitative RT-PCR analyses, three replicate PCRs were performed.
Statistics
Skin thickness, tumor number, and tumor area were determined by weekly observation. For comparison of tumor grade, tumors that were too small for histopathological analysis and those classified histologically as hyperplasia were not included. Pooled data for male and female mice of each genotype were compared as follows: a one-tailed t-test, assuming equal variance was applied to the skin thickness data, basic tumor data, tumor burden data, and quantitative RT-PCR data, and distribution of tumor classes in the genotypes was compared by Fisher’s exact test. Time to tumor onset in the genotypes was compared by the Kaplan-Meier statistic. To test for differences between the sexes within each genotype, nonparametric statistical approaches were used because of the small sample sizes. Fisher’s exact test was used to determine whether the occurrence of tumors differed and the Wilcoxon rank-sum test was used to assess whether there was a difference in tumor area or number of tumors per mouse. Significance was defined as a P value less than or equal to 0.05.
Results
Skin Thickness
Before UVR exposure, skin from the null mice was significantly thinner than that of the +/+ mice (0.82 mm ± 0.31 versus 1.03 mm ± 0.12, P = 0.02), as measured by caliper; therefore, skin thickness was calculated as percent change compared with pre-exposure thickness. Total skin thickness in +/+ mice peaked during the second week of UVR exposure at 163 ± 38.9% of the initial value versus 110 ± 38.9% of the initial value in the null mice; however, this difference was not significant (P = 0.07). By 6 weeks of exposure, skin thickness in the +/+ mice had reached a minimum (61.5 ± 22.8% of initial thickness). At this time point, the skin thickness of the null mice had also declined (62.8 ± 76.6% of initial thickness); the difference between the two genotypes was not significant (P = 0.5). The skin thickness of the null mice subsequently continued to decline, reaching a minimum by 9 weeks (20.8 ± 34.8% of initial value), meanwhile skin thickness of the +/+ mice remained at 66.8 ± 17.7% of the initial value; the difference between the genotypes was significant (P = 0.0007) at this time point. Throughout the remainder of the study, skin thickness in all mice progressively increased. The final skin thickness measurements were taken after 42 weeks of exposure, and, at that time, +/+ skin was significantly thicker than null skin; +/+ skin was 107 ± 32.2% of the initial thickness, whereas null skin was 37.9 ± 21.7% of the thickness before the beginning of the study, (P = 4 × 10⁻⁵).
The epidermis of unexposed Snai2-null mice, measured in histological sections of skin of control mice, was significantly thinner than that of +/+ mice (7.38 ± 0.99 μm versus 8.91 ± 1.67 μm, P = 0.02). At the termination of the present study, the epidermal thickness measured from histological sections was significantly lower in null mice compared with the +/+ mice (8.91 ± 1.67 μm versus 7.38 ± 0.99 μm, P = 0.02). In unexposed null mice, there were 90.7 ± 8.18 epidermal cells per ×400 field compared with 126.5 ± 31.9 epidermal cells in null mice exposed to UVR for 50 weeks (P = 0.01). In unexposed +/+ mice, there were 93.6 ± 11.0 epidermal cells per ×400 field compared with 157.4 ± 23.2 epidermal cells in the chronically exposed +/+ mice (P = 3 × 10⁻⁶). Thus, there were significantly fewer epidermal cells per field in Snai2-null mice in unexposed skin and after chronic UVR exposure. Reduced epidermal thickness in Snai2-null mice both before and after chronic UVR exposure was consistent with the reported roles for Snai2 in epidermal differentiation and proliferation.19,22
Inflammation
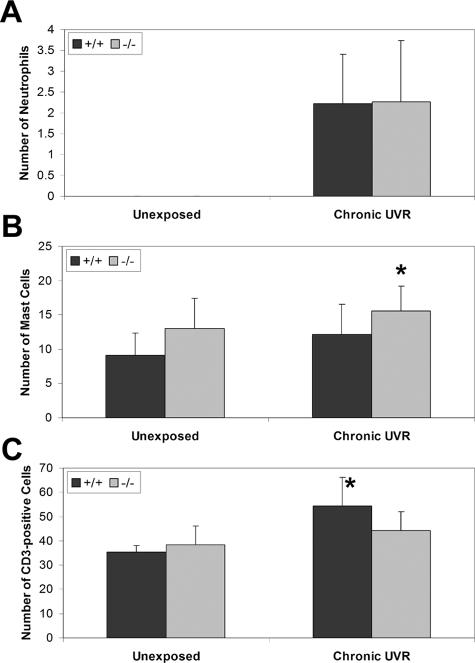
Only occasional neutrophils were observed in the dermis of colony control Snai2-null and +/+ mice. After chronic UVR exposure, there was no difference in the number of dermal neutrophils between the +/+ and Snai2-null mice (2.23 ± 1.18 cells versus 2.27 ± 1.46 cells per ×400 field, P = 0.5) (Figure 2A). Significantly more mast cells were present in the dermis of unexposed control Snai2-null mice compared with +/+ mice (13.03 ± 4.35 cells versus 9.17 ± 3.21 cell per ×400 field, P = 0.05). A similar significant difference was seen after chronic UVR exposure (15.56 ± 3.65 cells per ×400 field in null mice versus 12.18 ± 4.31 cells per ×400 field in +/+ mice, P = 0.006) (Figure 2B). There was no difference in the number of Cd3e-positive cells in the dermis of skin from unexposed control Snai2-null and +/+ mice (Figure 2C). However, in response to chronic UVR exposure, there was a significant increase in Cd3e-positive cells in the dermis of the +/+ mice (35.30 ± 2.81 per ×400 field in unexposed mice versus 54.42 ± 11.77 per ×400 field in UVR-exposed mice, P = 0.0009); a similar increase in Cd3e-positive cells did not occur in the dermis of Snai2-null mice (38.33 ± 7.85 per ×400 field in unexposed mice versus 44.24 ± 7.70 per ×400 field in UVR-exposed mice, P = 0.2). As a result, there were significantly more Cd3e-positive cells in the dermis of the +/+ mice than the null mice in response to chronic UVR exposure (P = 0.02).
Figure 2.
There were differences in inflammatory cell infiltrates in chronically UVR-exposed nontumor skin from +/+ and Snai2-null mice. A: In both genotypes, there were markedly increased numbers of neutrophils in the chronically exposed skin, compared with the unexposed skin, in which neutrophils were rarely observed. There was no difference in the number of neutrophils between +/+ and Snai2-null mice. B: There were significantly more mast cells in the chronically exposed Snai2-null skin, compared with +/+ skin. *P = 0.05. C: Increased numbers of Cd3e-positive cells were present in the dermis after chronic UVR exposure, with significantly fewer Cd3e-positive cells in the chronically exposed Snai2-null skin, compared with +/+ skin. *P = 0.0009.
Tumor Development
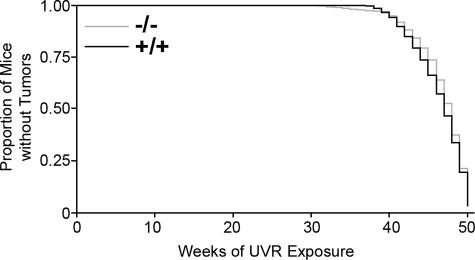
The first tumor was noted at week 29 of UVR exposure in a Snai2-null mouse. As shown in Figure 3 and Table 1, there was no significant difference in time to tumor onset between the two genotypes. Sixteen of the 20 +/+ mice (80%) developed skin tumors. Only 13 of 20 (65%) of null mice developed tumors; however, seven null mice were removed early from the study because of problems unrelated to UVR exposure (for example, inanition, priapism, and preputial gland abscess); 13 of 18 (72%) of the null mice that remained on the study past week 35 developed skin tumors.
Figure 3.
There was no difference in the time to tumor onset between the +/+ and Snai2-null mice as shown in this Kaplan-Meier plot.
Table 1.
Tumor Summary
| Genotype | Mice with tumors* (%) | Onset of first tumor† (week) | Tumors per mouse‡ | Tumor area (mm2) |
|---|---|---|---|---|
| +/+ | 80.0 | 42.4 ± 3.8 | 1.9 ± 1.5 | 66.9 ± 212.6 |
| −/− | 72.2 | 43.5 ± 5.6 | 1.4 ± 1.5 | 32.7 ± 64.0 |
Data are given as mean ± SD.
Reflects percentage of mice remaining on the study past 35 weeks of exposure that developed skin tumors.
Does not include mice that did not develop tumors.
Includes mice that did not develop tumors.
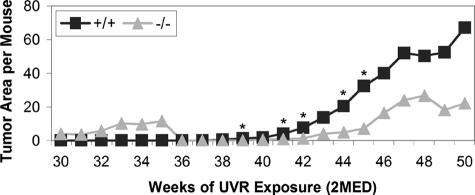
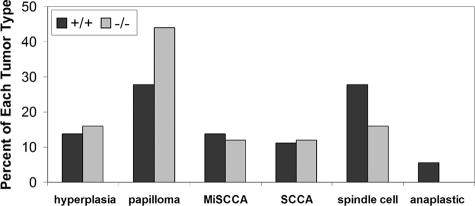
When tumor burden, calculated as total tumor area per mouse per week (including hyperplastic lesions), was compared between genotypes (Figure 4), the +/+ mice consistently had a higher tumor burden. This difference between the +/+ and null mice was significant at weeks 39 (1.14 ± 2.60 versus 0 ± 0, P = 0.04), 41 (4.08 ± 6.60 versus 1.02 ± 2.78, P = 0.04), 42 (7.52 ± 12.72 versus 1.32 ± 3.08, P = 0.03), 44 (20.40 ± 29.86 versus 5.00 ± 11.65, P = 0.03), and 45 (32.32 ± 45.52 versus 7.32 ± 16.54, P = 0.04). Although there was no statistically significant difference in the distribution of tumor types in the genotypes, as compared by χ2, null mice had a smaller proportion of aggressive tumors than +/+ mice (Figure 5). Fifteen of the 25 tumors noted grossly (15 of 25, 60%) in Snai2-null mice were hyperplastic lesions or benign papillomas, whereas hyperplastic lesions and papillomas constituted 15 of 36 (42%) of the tumors in +/+ mice. Twelve of 36 (33%) of the tumors in +/+ mice and 4 of 25 (16%) of the tumors in Snai2-null mice were the more mesenchymal-appearing spindle cell or anaplastic tumors. None of the mice developed metastases. Statistically significant differences between sexes within genotypes in tumor number, size, or total area were not observed. Overall, these findings suggest that the conversion of benign papillomas to miSCCs and malignant epithelial tumors to spindle cell and anaplastic tumors was slower in Snai2-null mice than in +/+ mice.
Figure 4.
Calculation of tumor burden (total tumor area per mouse) for each genotype revealed significant differences between the genotypes at most time points between 39 and 45 weeks of exposure. *P < 0.04.
Figure 5.
As shown in this graph of the proportion of tumor types for each genotype, Snai2-null mice developed fewer aggressive spindle cell and anaplastic tumors than +/+ mice. The two genotypes developed similar proportions of miSCCs and SCCs. Differences in lesion distribution between the two genotypes were not significant when compared by χ2 analysis.
Expression of Snai1 and Snai2
Given the small number of epithelial tumors available for RNA analysis, relative expression values from all epithelial tumors (papillomas, miSCCs, and SCCs) were pooled and compared with the pooled values from spindle cell and anaplastic tumors. Hyperplastic lesions were not included. These analyses included 10 +/+ spindle cell and anaplastic tumors, four null spindle cell tumors, six +/+ epithelial tumors, and five null epithelial tumors. Snail1 and Snai2 expression levels in normal skin were provided by analysis of RNA samples from two +/+ mice and two null control mice.
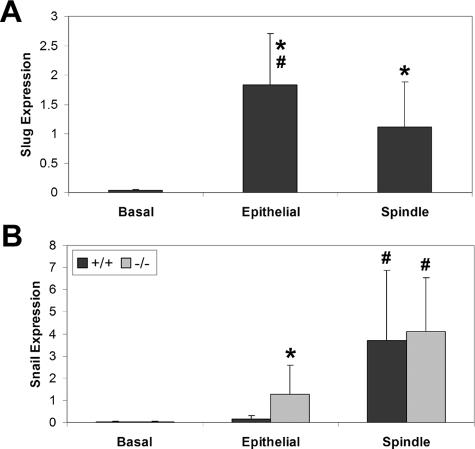
Quantitative RT-PCR for Snai2 expression was performed only on RNA from +/+ tumors. There was significantly higher expression of Snai2 in both epithelial tumors (P = 0.02) and spindle cell tumors (P = 0.04) than in normal skin (Figure 6). The difference between Snai2 expression in the epithelial tumors versus the spindle tumors was also significant (P = 0.05), with higher expression in epithelial than in spindle cell tumors. In contrast to Snai2 expression, Snai1 expression in +/+ tumors was higher in spindle cell tumors than in epithelial tumors (Figure 6). There was significantly increased Snail expression in both the +/+ (P = 0.009) and null (P = 0.03) spindle cell tumors compared with epithelial tumors in the same genotype. There was also significantly higher Snai1 expression in null epithelial tumors than in +/+ epithelial tumors (P = 0.031), and there was significantly higher Snai1 expression in the null spindle cell tumors than in normal skin from the null mice (P = 0.05). There was no significant difference in Snai1 expression between normal +/+ skin and either the epithelial or the spindle cell tumors from +/+ mice.
Figure 6.
Quantitative RT-PCR analysis of normal skin (basal), epithelial tumors, and spindle cell tumors from +/+ and Snai2-null mice revealed differing patterns of expression for Snai1 and Snai2 in epithelial and spindle cell tumors of +/+ and Snai2-null mice. A: Snai2 expression was significantly higher in epithelial and spindle cell tumors than in normal skin of +/+ mice. *P < 0.04. Snai2 expression was also significantly higher in epithelial than in spindle cell tumors of these mice. #P < 0.05. Expression of Snai2 was not evaluated in Snai2-null mice. B: Snai1 expression was significantly higher in Snai2-null spindle cell tumors than in normal skin from Snai2-null mice. *P < 0.05. Snai1 expression was significantly higher in epithelial tumors of Snai2-null mice than in epithelial tumors of +/+ mice. *P < 0.03. In addition, there was significantly increased expression of Snai1 in spindle cell tumors of both +/+ and Snai2-null mice compared with epithelial tumors in the same genotype. #P < 0.03.
Expression of Snai2 and Snail Target Genes
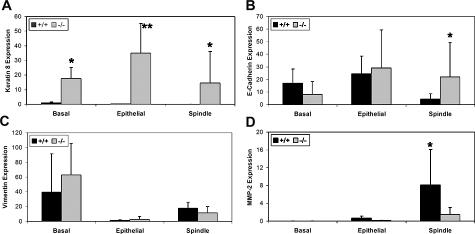
Snai2 expression has been reported to repress Krt8 expression in a mammary epithelial cell line23 and Krt8 is aberrantly expressed in the epidermis of Snai2-null mice (manuscript in submission). In keeping with these reports, Krt8 mRNA expression was minimal in the normal skin of control +/+ mice and significantly higher (P = 0.05) in the normal skin of control null mice (Figure 7A). Krt8 expression was also significantly higher in null epithelial tumors (P = 0.001) and spindle cell tumors (P = 0.02) compared with the same tumor types from the +/+ mice. There was no significant difference in Krt8 expression among normal skin, epithelial tumors, and spindle cell tumors of null mice. Although Krt8 expression has been reported to be a marker of skin tumor progression in UVR-induced mouse skin tumors,24 we observed that Krt8 expression levels in the +/+ epithelial tumors and the spindle tumors were significantly lower (P = 0.009 and 0.0002, respectively) than expression in normal skin. In addition, there was significantly less Krt8 expression in the +/+ spindle cell tumors than in the +/+ epithelial tumors (P = 0.02).
Figure 7.
Quantitative RT-PCR analysis of normal skin (basal), epithelial tumors, and spindle cell tumors from +/+ and Snai2-null mice showed altered expression of some Snail family target genes. A: Krt8 expression was significantly elevated in skin, epithelial tumors, and spindle cell tumors of Snai2-null mice compared with similar samples from +/+ mice. *P < 0.05. B: Cdh1 expression was significantly higher in the spindle cell tumors of Snai2-null mice compared with the same tumor type from +/+ mice. *P < 0.05. C: Significant differences between +/+ and Snai2-null mice for Vim expression were not seen in normal skin, epithelial tumors, or spindle cell tumors. However, for both genotypes, both normal skin and spindle cell tumors expressed significantly more Vim than epithelial tumors. D: Mmp2 expression was significantly higher in the spindle cell tumors of +/+ compared with Snai2-null mice. *P < 0.05.
The CDH1 gene has been reported to be a target of transcriptional repression by both Snai1 and Snai2.8,25 As expected in tumors expressing high levels of Snai1, there was significantly lower Cdh1 expression in the spindle cell tumors from the +/+ mice as compared with normal control skin (P = 0.006) or epithelial tumors (P = 0.0003). However, the same difference was not seen in spindle cell tumors from null mice. Cdh1 expression did not change significantly from control skin in either the epithelial or spindle cell null tumors. Moreover, there was significantly higher Cdh1 expression in spindle cell tumors from the null mice as compared with those from +/+ mice (P = 0.03) (Figure 7B). Thus, in the absence of Snai2 expression, even elevated levels of Snai1 were unable to lead to significantly suppressed Cdh1 expression in spindle cell tumors. These findings suggest that spindle cell tumors in +/+ mice had a more mesenchymal phenotype than morphologically similar tumors in Snai2-null mice.
In both the Snai2-null mice and +/+ mice, there was significantly lower Vim expression in epithelial tumors compared with normal control skin (P = 0.007 and P = 0.03, respectively) (Figure 7C). In addition, in the null mice there was significantly less Vim expression in the spindle tumors as compared with the normal skin (P = 0.0298). In both the +/+ and null mice, spindle cell tumors expressed significantly more Vim than did the epithelial tumors in the same genotype (P = 8 × 10⁻⁵ and P = 0.04, respectively), as expected if these spindle cell tumors have a more mesenchymal phenotype. However, Vim expression did not differ significantly between the two genotypes in normal skin, epithelial tumors, or spindle cell tumors. Thus, levels of Vim expression did not reflect a difference between +/+ and Snai2-null tumors in the mesenchymal character of the spindle cell tumors.
Mmp2 has been shown to be induced by Snai1 expression,26,27 as corroborated by this study (Figure 7D). In both the +/+ and null tumors, there was higher Mmp2 expression in the spindle cell tumors expressing increased levels of Snai1 than in the epithelial tumors (P = 0.02 and P = 0.05, respectively). In addition, both epithelial and spindle cell tumors from +/+ mice had higher Mmp2 expression than those from null mice; for epithelial tumors, this difference was significant (P = 0.02). These findings suggest that Snai2 also contributed to Mmp2 expression in +/+ tumors.
Immunohistochemical Characterization of Spindle Cell Tumors
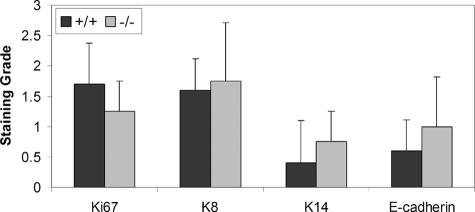
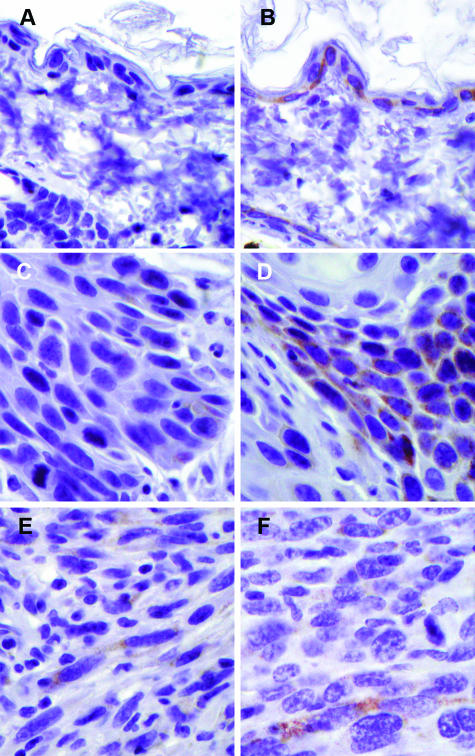
Spindle cell tumors arising in Snai2-null mice demonstrated somewhat stronger immunoreactivity for the epithelial markers Krt8, Krt14, and Cdh1 than +/+ spindle cell tumors (Figure 8). In normal skin, Cdh1 immunoreactivity was localized to the cell membrane; however, in all of the spindle cell tumors, Cdh1 immunoreactivity was cytoplasmic, indicating a redistribution of Cdh1 in these neoplastic cells. Despite the marked difference in Krt8 mRNA levels between +/+ and Snai2-null spindle cell tumors, expression of Krt8 protein, as revealed by immunohistochemistry, was only modestly elevated in Snai2-null spindle cell tumors compared with +/+ tumors (Figure 9). As illustrated in Figure 9, however, genotype-related differences in Krt8 expression were clearly visible both in unexposed skin and in SCCs. Detection of the proliferation marker Mki67 demonstrated slightly fewer proliferating cells in the Snai2-null spindle cell tumors than in the +/+ tumors.
Figure 8.
As shown in this figure, spindle cell tumors from Snai2-null mice had decreased Mki67 staining compared with +/+ spindle cell tumors and had increased staining for Krt8, Krt14, and Cdh1.
Figure 9.
Immunohistochemistry for Krt8 revealed widespread Krt8 expression in the unexposed skin of Snai2-null mice (A) compared with no detectable Krt8 expression in the unexposed skin of +/+ (B). There was greater Krt8 immunoreactivity in the SCC of Snai2-null mice (C) compared with SCC in +/+ mice (D). On the other hand, there was much less difference in the difference in Krt8 immunoreactivity of spindle cell tumors of +/+ mice (E) versus Snai2-null mice (F). Original magnifications, ×600.
Discussion
Snai2 and Epidermal Proliferation
Very early increases in skin thickness are indicators of UVR-induced dermal edema and inflammation, whereas later changes reflect epidermal and dermal changes, as well as altered hair growth patterns. Other studies in our laboratory have shown that the initial cutaneous inflammatory response to UVR is suppressed in Snai2-null mice compared with +/+ mice. As expected, initial depilation followed by UVR exposure stimulated synchronized hair growth in all mice. The initial hair growth cycle was somewhat prolonged in the Snai2-null mice; however, by 3 months of UVR exposure, hair cycles in all mice were essentially asynchronous and did not differ between the genotypes. Our findings of decreased skin and, in particular, epidermal thickness late in the study suggest a decreased proliferative response of Snai2-null epidermis to chronic UVR exposure compared with +/+ epidermis. This decrease was somewhat unexpected because Snai1 has been shown to block cell-cycle progression by repressing cyclin D transcription and overexpression of SNAI2 in keratinocytes in vitro results in decreased proliferation without changes in cyclin D expression.16 Our recent work, however, demonstrated decreased expression of cyclin D2, cyclin G2, and epithelial mitogen in untreated Snai2-null epidermis, as compared with untreated +/+ epidermis (manuscript in submission). Moreover, UVR induction of keratin 6 (Krt6), a marker of proliferation, is delayed in Snai2-null compared with +/+ mice, suggesting an impaired proliferative response.22 Taken together, our findings from this study and previous studies, suggest that Snai2 expression is required for a robust proliferative epidermal response to UVR. Decreased UVR-induced epidermal proliferation in Snai2-null skin may have contributed to the development of fewer tumors, smaller tumors, and less aggressive tumors in the null mice than in the +/+ mice because decreased epidermal proliferation would decrease the potential to accumulate mutations contributing to tumor progression. It is also possible that epidermal cell transit time was decreased in Snai2-null mice, leading to increased epidermal cell loss and reduced epidermal thickness, even in the absence of altered proliferation. This possibility remains to be investigated.
Snai2 and Cutaneous Inflammation
In humans, UVR-induced cutaneous inflammation has been shown to drive the conversion of actinic keratosis to SCC.28 Chronic UVR exposure causes constitutive induction of cyclooxygenase 2 (Ptgs2) in the skin, which results in increases in prostaglandin E2 (PGE2), inflammation, and reactive oxygen intermediates.29 PGE2 can act as a tumor promoter by contributing to the uncontrolled proliferation of damaged cells.29 High levels of Ptgs2 expression have been associated with more aggressive tumors, and oral or topical Ptgs2 inhibitors protect against skin tumor development in UVR-exposed mice.29 The cancer preventive effect of Ptgs2 inhibition may be attributable to decreased UVR-induced inflammation or to enhanced apoptosis of UVR-damaged keratinocytes because PGE2 is required for the growth of skin tumor cells.28
The present studies demonstrated significantly fewer Cde3-positive cells in the dermis of null mice chronically exposed to UVR, in comparison with similarly treated +/+ mice. At the same time, the numbers of mast cells in the dermis of both unexposed and chronically UVR-exposed Snai2-null epidermis were significantly higher than the numbers in +/+ skin. Numbers of neutrophils did not differ between +/+ and Snai2-null skin either before or after chronic UVR exposure. Thus, although Snai2 expression clearly had an impact on the inflammatory response of the skin to UVR, the implications of this altered response for skin carcinogenesis are not immediately apparent.
The finding of increased dermal mast cells after chronic UVR exposure has been previously reported in mice.22 The functional significance of increased mast cells after chronic UVR-exposure is still unclear. Hart and colleagues30 showed a direct correlation between the number of dermal mast cells and the degree of UVR-associated immunosuppression. It is hypothesized that these increased numbers of mast cells and subsequent immunosuppression would allow the development of skin tumors; however, no relationship has been identified between the number of mast cells and the incidence of skin tumors.31
Snai2 and Skin Carcinogenesis
The expression of detectable levels of various keratins and Cdh1 in the spindle cell tumors in this study suggested that they were of epithelial origin, as proposed by other investigators.17 The occurrence of a similar variety of tumor types in both Snai2-null and +/+ mice indicated that Snai2 was not required for tumor development or progression. However, Snai2-null mice had a consistently lower tumor burden than +/+ mice and the null mice developed a higher proportion of benign tumors. Spindle cell tumors in +/+ mice had a more mesenchymal phenotype than spindle cell tumors in Snai2-null mice. This suggested that Snai2 expression in +/+ tumors enhanced tumor progression and EMT in response to chronic UVR exposure.
In +/+ mice, Snai2 expression was higher in epithelial tumors than in spindle cell tumors, whereas Snai1 expression was higher in the more aggressive spindle tumors. This finding supports the findings of Kurrey and colleagues32 who reported that Snai2 expression was effective in triggering EMT but that maintenance of EMT required continuous Snai1 expression. In the epithelial ovarian cancer cell line, SKOV3, Snai2 suppressed expression of adherens junction (Cdh1 and β-catenin), tight junction (occludin and ZO-1), and desmosome (desmoglein 2) components, whereas Snai1 only suppressed expression of adherens and tight junction components. Furthermore, Snai2 expression preceded Snai1 expression in response to hypoxic conditions.32 Savagner and colleagues14 found that Snai2 expression induced the first phase of growth factor-induced EMT, including desmosome dissociation, cell spreading, and initiation of cell separation in a rat bladder carcinoma cell line (NBT-II). However, Snai2 expression alone was not able to induce the second phase of EMT, which included enhanced cell motility, repression of cytokeratin expression, and activation of vimentin expression. In the present study, significantly increased Snai1 expression in the epithelial tumors of Snai2-null mice compared with +/+ mice suggested that Snai1 expression might have substituted for enhanced Snai2 expression in driving evolution of epithelial tumors to a more aggressive phenotype.
The importance of Snai1 expression in epithelial tumor progression has previously been demonstrated. In a study comparing the expression of Snai1 and Snai2 in invasive and noninvasive mouse epidermal keratinocyte cell lines, it was shown that invasive cell lines expressed Snai1, whereas both types of cell line expressed Snai2.8 Furthermore, canine kidney epithelial cells (MDCK cells) overexpressing Snai1 or Snai2 demonstrated different morphologies when transplanted into BALB/C nude (Foxn1nu) mice. Snai1-expressing cells formed undifferentiated spindle cell tumors with no evidence of epithelial differentiation, whereas Snai2-expressing cells formed carcinosarcomas characterized by areas of glandular differentiation surrounded by proliferating undifferentiated malignant spindle cells.33 Similarly, Snai1-transfected MDCK cells with decreased Cdh1 expression demonstrated increased motility and invasion in in vitro assays and increased tumor growth in an athymic nu/nu xenograft model.8 The increased invasiveness of these cells suggests that ectopic expression of SNAI1 also affects other genes involved in motility and migration, in addition to genes regulating cell adhesion,8 In addition, SNAI1 expression has been shown to correlate inversely with the grade of differentiation of human breast carcinomas.34 In infiltrating ductal carcinomas, SNAI1 expression was associated with the presence of lymph node metastases, whereas all SNAI1-negative infiltrative ductal carcinomas lacked lymph node metastases.34 These data further demonstrate a role for SNAI1 in inducing an invasive and migratory phenotype in epithelial cells and identify SNAI1 expression as a marker of metastatic potential.34
Snai2 Targets during EMT in Skin Tumors
Cdh1 is a cell-cell adhesion molecule that complexes with the actin cytoskeleton via cytoplasmic catenins to form and maintain intercellular junctions and polarization of epithelial cells.35,36 Disruption of Cdh1-mediated cell adhesion commonly occurs during the transition from noninvasive tumors to invasive malignant carcinomas.37,38 Decreased CDH1 expression is a hallmark of EMT.39 Both SNAI1 and SNAI2 have been shown to repress CDH1 expression and induce EMT.8,14,25 In the present studies, Cdh1 expression at both the RNA and protein levels was lower in the spindle cell tumors than in the epithelial tumors from +/+ mice, but not in tumors from the Snai2-null mice. The finding of persistent Cdh1 expression in spindle cell tumors from the Snai2-null mice is consistent with the role of SNAI2 in repressing CDH1 expression and fostering EMT. This finding suggests that although the spindle cell tumors in the two genotypes were morphologically similar, spindle cell tumors in the Snai2-null mice maintained a more epithelial gene expression profile than those in +/+ mice. Thus EMT was impaired in UVR-induced skin tumors in Snai2-null mice.
Matrix metalloprotease expression has also been strongly linked with EMT and carcinoma progression driven by Snail family transcription factors. Transfection of human hepatocellular carcinoma cell lines with Snai1 increased expression of MMP1, MMP2, MMP7, and MMP14; decreased CDH1 expression; and enhanced tumor invasive activity.27 In another study, human oral SCC cells transfected with Snai1 developed a mesenchymal phenotype, increased invasive behavior, de novo expression of VIM, and high levels of Mmp2 activity.26 Moreover, overexpression of MMP2 has been demonstrated in stromal and neoplastic cells near the invasive front of a neoplasm, a site of EMT.40,41 Our study found that Mmp2 expression was greatest in the spindle cell tumors of both +/+ and Snai2-null mice; however, Mmp2 expression was significantly higher in +/+ spindle cell tumors than in Snai2-null tumors. This finding was consistent with impaired EMT in Snai2-null mice as suggested by Cdh1 findings.
Loss of keratin expression accompanied by de novo expression of Vim is a further characteristic of EMT in carcinomas. In the present studies, Vim expression was higher in both the +/+ and null spindle cell tumors than in the epithelial tumors. In the absence of Snai2, there was decreased Vim and significantly increased Cdh1 expression in the spindle cell tumors, supporting the conclusion that EMT was impaired in Snai2-null tumors. We saw markedly elevated Krt8 transcription in the skin and skin tumors of Snai2-null mice compared with +/+ mice. We observed enhanced expression of Krt8 in both unexposed epidermis and SCC of Snai2-null mice, a finding in keeping with levels of mRNA expression. However, the difference in mRNA expression in spindle cell tumors was not reflected in markedly altered immunohistochemical reactivity for Krt8. In general, Krt8 expression is regarded as a marker of skin tumor progression, because the KRT8 gene is not normally expressed in the adult epidermis, but is often aberrantly expressed in SCCs.24,42,43 Moreover, expression of exogenous KRT8 in a variety of cell lines results in anchorage-independent growth, shortened doubling times, increased invasive and migratory capabilities, and apoptosis resistance in vitro as well as enhanced metastasis in vivo.44,45,46 After treatment with a promoter, transgenic mice that express human Krt8 and Hras in the skin develop more aggressive undifferentiated SCC than mice expressing Hras only.47 However, an effect of Krt8 expression on spindle cell conversion has not been reported. Nor has the expression of Krt8 in spindle cell tumors been investigated. To date, all reports of keratin immunoreactivity in spindle cell tumors of mouse skin have used either pan-cytokeratin antibodies or antibodies against Krt14 alone.48,49,50,51 Thus, although Krt8 expression in mouse skin is believed to be modulated at the transcriptional level,24 our results suggest that Krt8 levels, at least in spindle cell tumors, may be regulated by mechanisms other than transcriptional control.
In summary, our studies show that Snai2 expression is not required for the development of UVR-induced SCC or their progression to more mesenchymal tumor types. However, tumor growth and progression were slower in Snai2-null than in +/+ mice and spindle cells tumors in Snai2-null mice maintained a more epithelial phenotype than tumors of similar appearance in +/+ mice. Our studies support the conclusions of other investigators regarding the relative roles of SNAI1 and SNAI2 in tumor progression. It seems that increased SNAI2 expression precedes increased SNAI1 expression during tumor development and that enhanced SNAI1 expression is required for complete EMT to occur. Moreover, our studies support a role for both SNAI1 and SNAI2 in modulating expression of the CDH1 and MMP2 genes during tumor evolution. Our studies also suggest additional roles for SNAI2 in UVR-induced epidermal proliferation and cutaneous inflammation.
Footnotes
Address reprint requests to Donna F. Kusewitt, Department of Veterinary Biosciences, The Ohio State University College of Veterinary Medicine, 1925 Coffey Rd., Columbus, OH 43235. E-mail: kusewitt.1@osu.edu.
Supported by the National Institutes of Health (grant R01 CA089216).
References
- Carver EA, Jiang R, Lan Y, Oram KF, Gridley T. The mouse snail gene encodes a key regulator of the epithelial-mesenchymal transition. Mol Cell Biol. 2001;21:8184–8188. doi: 10.1128/MCB.21.23.8184-8188.2001. [DOI] [PMC free article] [PubMed] [Google Scholar]
- Makinen M, Stenback F. Skin tumor development and keratin expression in different experimental models. Relation to inducing agent and target tissue structure. Exp Toxicol Pathol. 1998;50:199–208. doi: 10.1016/S0940-2993(98)80084-5. [DOI] [PubMed] [Google Scholar]
- DiGiovanna JJ. Posttransplantation skin cancer: scope of the problem and role for systemic retinoid chemoprevention. Transplant Proc. 1998;30:2771–2778. doi: 10.1016/s0041-1345(98)00806-9. [DOI] [PubMed] [Google Scholar]
- Grimes HL, Chan TO, Zweidler-McKay PA, Tong B, Tsichlis PN. The Gfi-1 proto-oncoprotein contains a novel transcriptional repressor domain. SNAG, and inhibits G1 arrest induced by interleukin-2 withdrawal. Mol Cell Biol. 1996;16:6263–6272. doi: 10.1128/mcb.16.11.6263. [DOI] [PMC free article] [PubMed] [Google Scholar]
- Iyer PV, Leong AS. Poorly differentiated squamous cell carcinomas of the skin can express vimentin. J Cutan Pathol. 1992;19:34–39. doi: 10.1111/j.1600-0560.1992.tb01556.x. [DOI] [PubMed] [Google Scholar]
- Mazzalupo S, Wawersik MJ, Coulombe PA. An ex vivo assay to assess the potential of skin keratinocytes for wound epithelialization. J Invest Dermatol. 2002;118:866–870. doi: 10.1046/j.1523-1747.2002.01736.x. [DOI] [PubMed] [Google Scholar]
- Kang Y, Massague J. Epithelial-mesenchymal transitions: twist in development and metastasis. Cell. 2004;118:277–279. doi: 10.1016/j.cell.2004.07.011. [DOI] [PubMed] [Google Scholar]
- Cano A, Perez-Moreno MA, Rodrigo I, Locascio A, Blanco MJ, del Barrio MG, Portillo F, Nieto MA. The transcription factor Snail controls epithelial-mesenchymal transitions by repressing E-cadherin expression. Nat Cell Biol. 2000;2:76–83. doi: 10.1038/35000025. [DOI] [PubMed] [Google Scholar]
- Hemavathy K, Ashraf SI, Ip YT. Snail/Slug family of repressors: slowly going into the fast lane of development and cancer. Gene. 2000;257:1–12. doi: 10.1016/s0378-1119(00)00371-1. [DOI] [PubMed] [Google Scholar]
- Sefton M, Sanchez S, Nieto MA. Conserved and divergent roles for members of the Snail family of transcription factors in the chick and mouse embryo. Development. 1998;125:3111–3121. doi: 10.1242/dev.125.16.3111. [DOI] [PubMed] [Google Scholar]
- Jiang R, Lan Y, Norton CR, Sundberg JP, Gridley T. The Slug gene is not essential for mesoderm or neural crest development in mice. Dev Biol. 1998;198:277–285. [PubMed] [Google Scholar]
- Pérez-Losada J, Sanchez-Martin M, Rodriguez-Garcia A, Sanchez ML, Orfao A, Flores T, Sanchez-Garcia I. Zinc-finger transcription factor Slug contributes to the function of the stem cell factor c-kit signaling pathway. Blood. 2002;100:1274–1286. [PubMed] [Google Scholar]
- Mukhtar H, Elmets CA. Photocarcinogenesis: mechanisms, models, and human health implications. Photochem Photobiol. 1996;63:356–357. doi: 10.1111/j.1751-1097.1996.tb03040.x. [DOI] [PubMed] [Google Scholar]
- Savagner P, Yamada KM, Thiery JP. The zinc-finger protein Slug causes desmosome dissociation, an initial and necessary step for growth-factor-induced epithelial-mesenchymal transition. J Cell Biol. 1997;137:1403–1419. doi: 10.1083/jcb.137.6.1403. [DOI] [PMC free article] [PubMed] [Google Scholar]
- Savagner P, Kusewitt DF, Carver EA, Magnino F, Choi C, Gridley T, Hudson LG. Development transcription factor Slug is required for effective re-epithelialization by adult keratinocytes. J Cell Physiol. 2005;202:858–866. doi: 10.1002/jcp.20188. [DOI] [PubMed] [Google Scholar]
- Turner FE, Broad S, Khanim FL, Jeanes A, Talma S, Hughes S, Tselepis C, Hotchin NA. Slug regulates integrin expression and cell proliferation in human epidermal keratinocytes. J Biol Chem. 2006;281:21321–21331. doi: 10.1074/jbc.M509731200. [DOI] [PubMed] [Google Scholar]
- Pons M, Cigudosa JC, Rodriguez-Perales S, Bella JL, Gonzalez C, Gamallo C, Quintanilla M. Chromosomal instability and phenotypic plasticity during the squamous-spindle carcinoma transition: association of a specific T(14;15) with malignant progression. Oncogene. 2005;24:7608–7618. doi: 10.1038/sj.onc.1208903. [DOI] [PubMed] [Google Scholar]
- Fraga MF, Herranz M, Espada J, Ballestar E, Paz MF, Ropero S, Erkek E, Bozdogan O, Peinado H, Niveleau A, Mao JH, Balmain A, Cano A, Esteller M. A mouse skin multistage carcinogenesis model reflects the aberrant DNA methylation patterns of human tumors. Cancer Res. 2004;64:5527–5534. doi: 10.1158/0008-5472.CAN-03-4061. [DOI] [PubMed] [Google Scholar]
- Hudson LG, Choi C, Newkirk KM, Parkhani J, Cooper KL, Lu P, Kusewitt DF. Ultraviolet radiation stimulates expression of Snail family transcription factors in keratinocytes. Mol Carcinog. 2007;46:257–268. doi: 10.1002/mc.20257. [DOI] [PubMed] [Google Scholar]
- Sheehan D, Hrapchak B. Columbus: Battelle Press,; Theory and Practice of Histotechnology, (ed 2.) 1980:pp 235–237. [Google Scholar]
- Ramakers C, Ruijter JM, Deprez RH, Moorman AF. Assumption-free analysis of quantitative real-time polymerase chain reaction (PCR) data. Neurosci Lett. 2003;339:62–66. doi: 10.1016/s0304-3940(02)01423-4. [DOI] [PubMed] [Google Scholar]
- Clydesdale GJ, Dandie GW, Muller HK. Ultraviolet light induced injury: immunological and inflammatory effects. Immunol Cell Biol. 2001;79:547–568. doi: 10.1046/j.1440-1711.2001.01047.x. [DOI] [PubMed] [Google Scholar]
- Tripathi MK, Misra SM, Chaudhuri G. Negative regulation of the expressions of cytokeratins 8 and 19 by SLUG repressor protein in human breast cells. Biochem Biophys Res Commun. 2005;329:508–515. doi: 10.1016/j.bbrc.2005.02.006. [DOI] [PMC free article] [PubMed] [Google Scholar]
- Larcher F, Bauluz C, Diaz-Guerra M, Quintanila M, Conti CJ, Ballestin C, Jorcano JL. Aberrant expression of the simple epithelial type II keratin 8 by mouse skin carcinomas but not papillomas. Mol Carcinog. 1992;6:112–121. doi: 10.1002/mc.2940060206. [DOI] [PubMed] [Google Scholar]
- Bolós V, Peinado H, Perez-Moreno MA, Fraga MF, Esteller M, Cano A. The transcription factor Slug represses E-cadherin expression and induces epithelial to mesenchymal transitions: a comparison with Snail and E47 repressors. J Cell Sci. 2003;116:499–511. doi: 10.1242/jcs.00224. [DOI] [PubMed] [Google Scholar]
- Yokoyama K, Kamata N, Fujimoto R, Tsutsumi S, Tomonari M, Taki M, Hosokawa H, Nagayama M. Increased invasion and matrix metalloproteinase-2 expression by Snail-induced mesenchymal transition in squamous cell carcinomas. Int J Oncol. 2003;22:891–898. [PubMed] [Google Scholar]
- Miyoshi A, Kitajima Y, Sumi K, Sato K, Hagiwara A, Koga Y, Miyazaki K. Snail and SIP1 increase cancer invasion by upregulating MMP family in hepatocellular carcinoma cells. Br J Cancer. 2004;90:1265–1273. doi: 10.1038/sj.bjc.6601685. [DOI] [PMC free article] [PubMed] [Google Scholar]
- Halliday GM. Inflammation, gene mutation and photoimmunosuppression in response to UVR-induced oxidative damage contributes to photocarcinogenesis. Mutat Res. 2005;571:107–120. doi: 10.1016/j.mrfmmm.2004.09.013. [DOI] [PubMed] [Google Scholar]
- Wilgus TA, Koki AT, Zweifel BS, Kusewitt DF, Rubal PA, Oberyszyn TM. Inhibition of cutaneous ultraviolet light B-mediated inflammation and tumor formation with topical celecoxib treatment. Mol Carcinog. 2003;38:49–58. doi: 10.1002/mc.10141. [DOI] [PubMed] [Google Scholar]
- Hart PH, Grimbaldeston MA, Swift GJ, Jaksic A, Noon FP, Finlay-Jones JJ. Dermal mast cells determine susceptibility to UVB-induced systemic suppression of contact hypersensitivity responses in mice. J Exp Med. 1998;187:2045–2053. doi: 10.1084/jem.187.12.2045. [DOI] [PMC free article] [PubMed] [Google Scholar]
- Grimbaldeston MA, Finlay-Jones JJ, Hart PH. Mast cells in photodamaged skin: what is their role in skin cancer? Photochem Photobiol Sci. 2006;5:177–183. doi: 10.1039/b504344a. [DOI] [PubMed] [Google Scholar]
- Kurrey NK, Amit K, Bapat SA. Snail and Slug are major determinants of ovarian cancer invasiveness at the transcriptional level. Gynecol Oncol. 2005;97:155–165. doi: 10.1016/j.ygyno.2004.12.043. [DOI] [PubMed] [Google Scholar]
- Moreno-Bueno G, Cubillo E, Sarrio D, Peinado H, Rodriguez-Pinilla SM, Villa S, Bolos V, Jorda M, Fabra A, Portillo F, Palacios J, Cano A. Genetic profiling of epithelial cells expressing E-cadherin repressors revels a distinct role for snail, slug and E47 factors in epithelial-mesenchymal transition. Cancer Res. 2006;66:9543–9556. doi: 10.1158/0008-5472.CAN-06-0479. [DOI] [PubMed] [Google Scholar]
- Blanco MJ, Moreno-Beuno G, Sarrio D, Locascio A, Cano A, Palacios J, Angela Nieto M. Correlation of Snail expression with histologic grade and lymph node status in breast carcinomas. Oncogene. 2002;21:3241–3246. doi: 10.1038/sj.onc.1205416. [DOI] [PubMed] [Google Scholar]
- Yokoyama K, Kamata N, Hayashi E, Hoteiya T, Ueda N, Fujimoto R, Nagayama M. Reverse correlation of E-cadherin and snail expression in oral squamous cell carcinoma cells in vitro. Oral Oncol. 2001;37:65–71. doi: 10.1016/s1368-8375(00)00059-2. [DOI] [PubMed] [Google Scholar]
- Poser I, Dominguez D, Garcia de Herreros A, Varnai A, Buettner R, Bosserhoff AK. Loss of E-cadherin expression in melanoma cells involves up-regulation of the transcriptional repressor snail. J Biol Chem. 2001;276:24661–24666. doi: 10.1074/jbc.M011224200. [DOI] [PubMed] [Google Scholar]
- Birchmeier W, Behrens J. Cadherin expression in carcinomas: role in the formation of cell junctions and the prevention of invasiveness. Biochim Biophys Acta. 1994;1198:11–26. doi: 10.1016/0304-419x(94)90003-5. [DOI] [PubMed] [Google Scholar]
- Perl AK, Wilgenbus P, Dahl U, Semb H, Christofori G. A causal role for E-cadherin in the transition from adenoma to carcinoma. Nature. 1998;392:190–193. doi: 10.1038/32433. [DOI] [PubMed] [Google Scholar]
- Conacci-Sorrell M, Simcha I, Ben-Yedidia T, Blechman J, Savagner P, Ben-Ze’ev A. Autoregulation of E-cadherin expression by cadherin-cadherin interactions: the roles of β-catenin signaling, slug and MAPK. J Cell Biol. 2003;163:847–857. doi: 10.1083/jcb.200308162. [DOI] [PMC free article] [PubMed] [Google Scholar]
- Sier CF, Kubben FJ, Ganesh S, Heerding MM, Griffioen G, Hanemaaijer R, vanKrieken JH, Lamers CB, Verspaget HW. Tissue levels of matrix metalloproteinases MMP2 and MMP-9 are related to overall survival of patients with gastric carcinoma. Br J Cancer. 1996;74:413–417. doi: 10.1038/bjc.1996.374. [DOI] [PMC free article] [PubMed] [Google Scholar]
- Kuniyasu H, Troncoso P, Johnston D, Bucana CD, Tahara E, Fidler IJ, Pettaway CA. Relative expression of type IV collagenase. E-cadherin and vascular endothelial growth factor/vascular permeability factor in prostatectomy specimens distinguishes organ-confirmed from pathologically advanced prostate cancer. Clin Cancer Res. 2000;6:2295–2308. [PubMed] [Google Scholar]
- Hendrix MJC, Seftor EA, Chu YW, Trevor KT, Seftor REB. Role of intermediate filaments in migration, invasion and metastasis. Cancer Metastasis Rev. 1996;15:507–525. doi: 10.1007/BF00054016. [DOI] [PubMed] [Google Scholar]
- Oshima RG, Baribault H, Caulin C. Oncogenic regulation and function of keratins 8 and 18. Cancer Metastasis Rev. 1996;15:445–471. doi: 10.1007/BF00054012. [DOI] [PubMed] [Google Scholar]
- Chu YW, Seftor EA, Romer LH, Hendrix MJC. Experimental coexpression of vimentin and keratin intermediate filaments in human melanoma cells augments motility. Am J Pathol. 1996;148:63–69. [PMC free article] [PubMed] [Google Scholar]
- Gilbert S, Loranger A, Daigle N, Marceau N. Simple epithelium keratins 8 and 18 provide resistance to Fas-mediated apoptosis. The protection occurs through a receptor-targeting modulation. J Cell Biol. 2001;154:763–773. doi: 10.1083/jcb.200102130. [DOI] [PMC free article] [PubMed] [Google Scholar]
- Raul U, Sawant S, Dange P, Kalraiya R, Ingle A, Vaidya M. Implications of cytokeratin 8/18 filament formation in stratified epithelial cells: induction of transformed phenotype. Int J Cancer. 2004;111:662–668. doi: 10.1002/ijc.20349. [DOI] [PubMed] [Google Scholar]
- Casanova ML, Bravo A, Martinez-Palacio J, Fernandez-Acenero MJ, Villanueva C, Larcher F, Conti CJ, Jorcano JL. Epidermal abnormalities and increased malignancy of skin tumors in human epidermal keratin 8-expressing transgenic mice. FASEB J. 2004;18:1556–1558. doi: 10.1096/fj.04-1683fje. [DOI] [PubMed] [Google Scholar]
- Morison WL, Jerdan MS, Hoover TL, Farmer ER. UV radiation-induced tumors in haired mice: identification as squamous cell carcinomas. J Natl Cancer Inst. 1986;77:1155–1162. [PubMed] [Google Scholar]
- Canfield PJ, Greenoak GE, Macasaet EN, Reeve VE, Gallagher CH. The characterization of squamous cell carcinoma induced by ultraviolet irradiation in hairless mice. Pathology. 1988;20:109–117. doi: 10.3109/00313028809066620. [DOI] [PubMed] [Google Scholar]
- Klein-Szanto AJ, Larcher F, Bonfil RD, Conti CJ. Multistage chemical carcinogenesis protocols produce spindle cell carcinomas of the mouse skin. Carcinogenesis. 1989;10:2169–2172. doi: 10.1093/carcin/10.11.2169. [DOI] [PubMed] [Google Scholar]
- Stoler AB, Stenback F, Balmain A. The conversion of mouse skin squamous cell carcinomas to spindle cell carcinomas is a recessive event. J Cell Biol. 1993;122:1103–1117. doi: 10.1083/jcb.122.5.1103. [DOI] [PMC free article] [PubMed] [Google Scholar]


