Abstract
We described a multiple-stage ion-trap mass spectrometric approach to characterize the structures of phosphatidylinositol and phosphatidyl-myoinositol mannosides (PIMs) in a complex mixture isolated from Mycobacterium bovis Bacillus Calmette Guérin. The positions of the fatty acyl substituents of PIMs at the glycerol backbone can be easily assigned, based on the findings that the ions arising from losses of the fatty acid substituent at sn-2 as molecules of acid and of ketene, respectively (that is, the [M – H – R2CO2H]− and [M – H – R2CH=CO]− ions), are respectively more abundant than the ions arising from the analogous losses at sn-1 (that is, the [M – H – R1CO2H]− and [M – H – R1CH=CO]− ions) in the MS2 product-ion spectra of the [M – H]− ions desorbed by electrospray ionization (ESI). Further dissociation of the [M – H – R2CO2H]− and [M – H – R1CO2H]− ions gives rise to a pair of unique ions corresponding to losses of 74 and 56 Da (that is, [M – H – RxCO2H – 56]− and [M – H – RxCO2H – 74]− ions, x = 1, 2), respectively, probably arising from various losses of the glycerol. The profile of theion-pair in the MS3 spectrum of the [M – H – R2CO2H]− ion is readily distinguishable from in the MS3 spectrum of the [M – H – R1CO2H]− ion and thus the assignment of the fatty acid substituents at the glycerol backbone can be confirmed. The product-ion spectra of the [M – H]− ions from 2-lyso-PIM and from 1-lyso-PIM are discernible and both spectra contain a unique ion that arises from primary loss of the fatty acid substituent at the glycerol backbone, followed by loss of a bicyclic glycerophosphate ester moiety of 136 Da. The combined structural information from the MS2 and MS2 product-ion spectra permit the complex structures of PIMs that consist of various isomers to be unveiled in detail.
The occurrence of inositol and mannose as components of a phospholipid fraction from Mycobacterium species was first noted by Anderson et al. [1-4]. Substantial studies in both M. tuberculosis and M. phlei. by Ballou and coworkers [5-8] led to the discovery of a family of phosphatidyl-myo-inositol mannosides (PIMs) consisting of from one to five mannose units. The subclass of PIM6 was later isolated by Sasaki [9]. PIM molecules are part of the cytosplasmic membrane as well as the mycobacterial cell wall. Other important components of the mycobacterial cell wall are the lipoarabinomannans (LAMs) and the lipomannans (LMs), which are derived from PIMs. The importance of these lipoglycans in the immunopathogenesis of tuberculosis is well known. PIMs form the common anchor of LM and LAM and play an important role in the biological functions of these molecules [10]. PIM2 was shown to elicit the production of proinflammatory cytokines from macrophages [11] and also has been shown to recruit natural killer T cells, which have a primary role in the local granulomatous response [12-14]. A role for surface-exposed PIMs as M. tuberculosis adhesins that mediate attachment to nonphagocytic cells has also been established [15, 16]. Analysis of infected macrophages revealed that PIMs, among other myco-bacterial lipids, are actively trafficked out of the myco-bacterial phagosome, suggesting a potential role for these constituents in extending the influence of the bacterium over its surroundings [17].
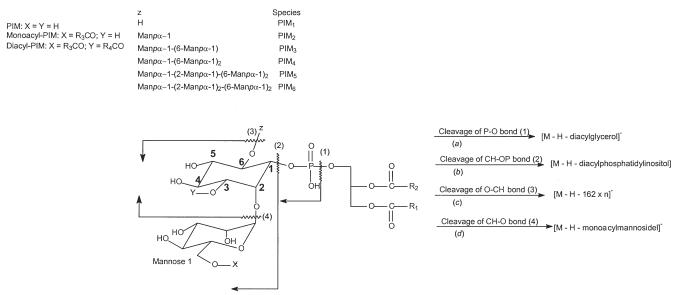
Phosphatidyl-myo-inositol mannoside (PIM) consists of a phosphatidylinositol nucleus, in which a mannosyl residue is glycosidically attached by an α]-(1→2) linkage to the O-2-position of the inositol to form a phosphatidylinositol monomannoside (PIM1). From M. tuberculosis and M. phlei, Lee and Ballou established the complete structure of phosphatidylinositol dimannoside (PIM2) that consists of a second mannosyl residue attached to the O-6-position of the myo-inositol by α-D-(1→6)-linkage. The structure of phosphatidylinositol pentamannoside (PIM5) defined by the same authors is a glycosylated chain elongation of PIM2 occurring at position O-6 of the second mannose by addition of two α-(1→6)-linked mannosyl residues and one α(1→2)-linked mannosyl residue [8]. Chatterjee et al. [18] described the presence of a phosphatidylinositol hexamannoside (PIM6) isolated from M. tuberculosis. The structure of the glycosidic part of PIM6 has been established and corresponds to α-D-Manp-(1→2)-α-D-Manp-(1→2)-α-DManp-(1→6)-α-D-Manp-(1→6)-α-D-Manp-(1→6) linked to the myo-inositol ring along with the mannosyl residue attached to position 2 [18, 19] (see Ifor structure of PIM6).
In addition to the two fatty acid groups connected to the glycerol backbone, a series of PIMs containing one or two additional fatty acyl residues can be found on various PIMs including PIM6, PIM5, PIM4, PIM3, and PIM2 [20-22]. Earlier studies by Khoo et al. using fast atom bombardment–mass spectrometry (FAB-MS) analyses of the perdeuteroacetyl and permethyl derivatives of PIMs along with gas chromatography (GC)/MS analysis suggested that the third fatty acyl group in acyl-PIM2 and its lyso form is bonded to the 6-position of the mannose linked to the O-2 of the myo-inositol [23]. This structure is confirmed by Gilleron et al., whose group later demonstrated that a fourth acylation site is located at the C-3 of the myo-inositol, using GC/MS, matrix-assisted laser desorption ionization–time of flight (MALDI-TOF), and electrospray ionization tandem mass spectrometry (ESI-MSMS), in combination with extensive studies with NMR spectroscopy [24-27]. The acylation state of PIM6 was recently found to be consistent with that observed for PIM2. PIMs are extremely heterogeneous by nature. For example, the PIM6 family constitutes 10 or 12 acyl forms [26].
Although the structure of PIMs has been established using the traditional methods, a simple multiple-stage ion-trap mass spectrometric approach toward to the structural elucidation of PIMs has not been described. In this first part of the report, we shall describe the mechanism(s) underlying the fragmentation processes of PI and PIMs upon collisional activation decomposition (CAD) in an ion-trap, as well as the structural characterization of PI and of the subclass of PIMs (diacylated PIMs). The mass spectrometric methods for structural characterization of monoacyl-PIMs (triacylated PIMs) and diacyl-PIMs (tetraacylated PIMs) will be presented separately in a companion paper of this report [28]. This unique multiple-stage tandem mass spectrometric method permits the complex structures of PIMs, including various isomers, to be revealed in detail.
Experimental
Isolation of PIMs from M. bovis Bacillus Calmette Guérin (BCG)
Mid-log mycobacterial cultures were harvested and washed twice with sterile H2O with 0.05% Tween. The pellet was extracted with chloroform/methanol (2:1 vol/vol) twice at 50 °C followed by a Folch wash [29] to remove the hydrophilic contaminants. The organic phase was dried under N2 and stored at −20 °C. Total lipid extracts were fractionated over silica gel-60 (EM Science, Fort Washington, PA, USA) using increasing amounts of 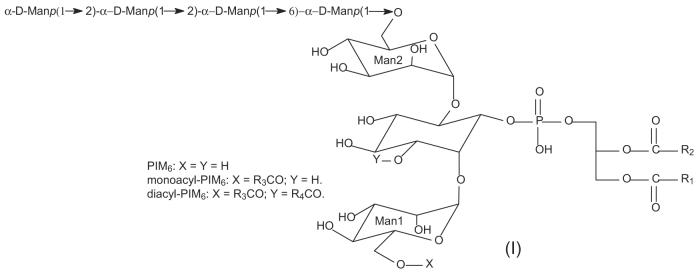 methanol in chloroform, and the phospholipids including PIMs fraction were eluted between 7 and 50% chloroform. The fractions were purified on preparative TLC plates (aluminum-backed, 250 mm thick silica; EM Science) using a mixture of water:chloroform:methanol (4:64:32, by volume), and the individual bands were scraped from the plate and extracted from the silica in chloroform/methanol (2/1 by volume).
Mass Spectrometry
Negative-ion multiple-stage tandem mass spectrometry experiments were conducted on a Finnigan (San Jose, CA) LCQ DECA ion-trap mass spectrometer (ITMS) equipped with an Xcalibur operating system. Lipid extracts in methanol/chloroform solution (vol/vol, 1/1) were continuously infused (3 μL/min) to the ESI source, where the skimmer was set at ground potential, the electrospray needle was at 4.5 kV, and temperature of the heated capillary was at 260 °C. To obtain the CAD product-ion spectra from the MSn (n = 2, 3, 4) experiments, the automatic gain control of the ion trap was set to 5 × 10⁷, with a maximum injection time of 400 ms. Helium was used as the buffer and collision gas at a pressure of 1 × 10⁻³ mbar. The MSn experiments were carried out with a relative collision energy ranging from 30 to 38% and with a default activation q value at 0.25. The activation time was set at 100 ms. The mass resolution was 0.6 Da at half peak height throughout the acquired mass range. MALDITOF spectra of the lipid extract were acquired in the reflector mode using a Voyager DE STR mass spectrometer (PerSeptive Biosystems, Framingham, MA, USA) equipped with a 337 nm nitrogen laser and delayed extraction as previously described [26]. The final mass spectra were from an average of 5–10 spectra, in which each spectrum is a collection from 200 laser shots.
Nomenclatures
Phosphatidyl-myo-inositol mono-, di-, tri-, tetra-, penta-, and hexamannosides are denoted as PIM1, PIM2, PIM3, PIM4, PIM5, and PIM6, respectively. The abbreviation PIM used here is to denote PIM bearing two fatty acid substituents on their glycerol moiety [30]. In some instances, PIM(s) signify the entire class of phosphatidyl-myo-inositol mannosides, including lyso-PIMs, PIMs (diacylated PIMs), monoacyl-PIMs (triacylated PIMs), and diacyl-PIMs (tetraacylated PIMs). To simplify data interpretation, we adopt the rules recommended by IUPAC with modification for designation of the fatty acyl substituents and the mannosyl moieties. The man-nose attached to the O-2 of the myo-inositol by a α-(1→2)-linkage is designated as mannose 1, and the mannosyl residue that is glycosidically attached to the myo-inositol by a α-(1→6) linkage is designated as mannose 2. The fatty acid substituents attached to the stereospecific numbering (sn) of C1 (sn-1) and C2 (sn-2) of the glycerol backbone are designated as R1CO2H and R2CO2H, respectively. The fatty acid substituent attached to the O-6′ position of mannose 1 is designated as R3CO2H and the fourth fatty acid substituent bonded to the O-3 position of myo-inositol is designed as R4CO2H [30]. The abbreviation, such as (19:0/16:0)-PIM2 signifies that the phosphatidyl-myo-inositol dimannoside has tubercurostearoyl (19:0-) and palmitoyl (16:0-) residues located at sn-1 and sn-2 of the glycerol backbone, respectively. The 16:0-(19:0/16:0)-PIM2 signifies that the monoacyl PIM2 contains a 16:0-fatty acyl residue at O-6 position of the mannose 1 residue, and the 19:0- and 16:0-fatty acyl residues are respectively located at sn-1 and sn-2 of the glycerol backbone; whereas the (16:0, 18:1)(19:0/16:0)-PIM2 signifies that the diacyl-PIM2 molecule has palmitoyl, oleoyl (18:1-), tubercurostearoyl, and palmitoyl fatty acyl substituents corresponding to the R3CO-, R4CO-, R1CO-, and R2CO-substituents, respectively. The product-ion spectra obtained from the MSn (n = 2, 3, 4) experiments were designated as the MSn spectra (n = 2, 3, 4).
Results and Discussion
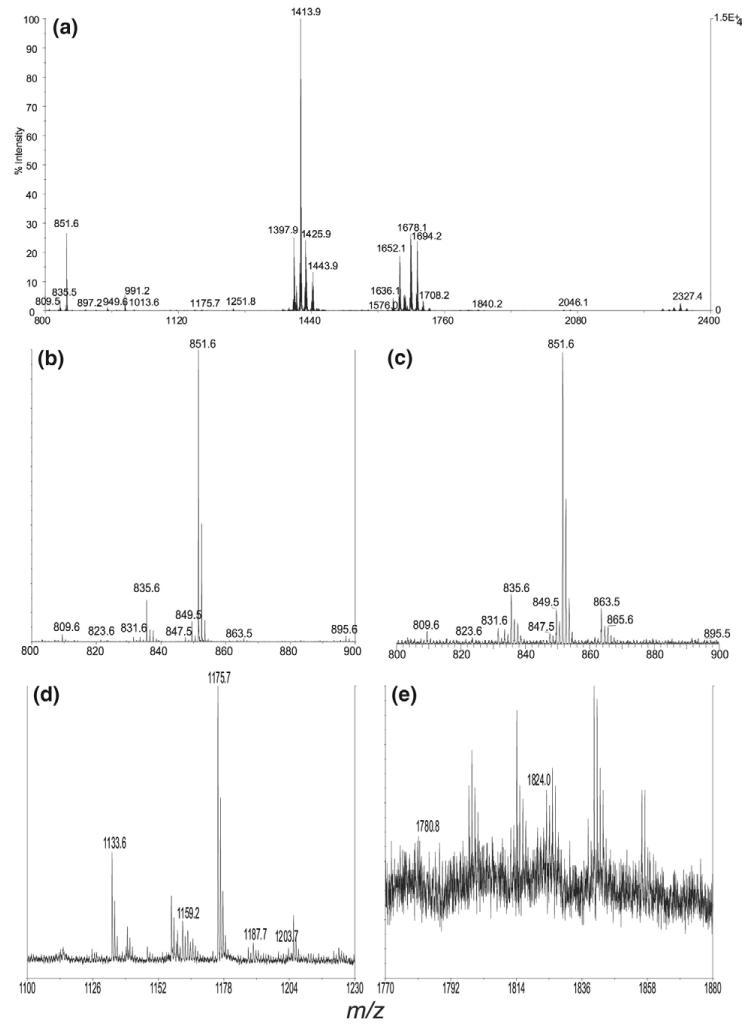
Both PIMs and PI consist of a phosphatidylinositol nucleus and readily yield the deprotonated anions ([M – H]−) using ESI-MS in the negative-ion mode. Although MALDI-TOF-MS with reflectron and delayed extraction features affords ultimate resolution and superb sensitivity, multiple-stage ion-trap mass spectrometry with ESI provides valuable information for structural characterization of PIMs. The mass spectrum of the lipid extracts from M. bovis BCG obtained by MALDI-TOF (Figure 1a) is similar to that obtained by ESI IT-MS (data not shown). The spectrum is dominated by the ions arising from the phosphatidylinositol (PI) and PIM molecules, consistent with those previously reported for M. tuberculosis, M. bovis BCG, and M. smegmatis [27]. To gain insight into the mechanism(s) underlying the fragmentation processes of PIMs, we first conducted studies on the PI including PI standards using multiple-stage ion-trap mass spectrometry.
Figure 1.
(a) The MALDI/TOF mass spectrum of the PIMs isolated from Mycobaterium bovis BCG. The ions that represent (b) the PI species (from 800 to 900 Da), (d) the PIM2 species (from 1100 to 1230 Da), and (e) the PIM6 species (from 1770 to 1880 Da) are also shown. The ESI/MS spectrum of the PI ions (c) is nearly identical to that shown in (b).
The Fragmentation Processes of PI Revealed by IT Multiple-stage Tandem Mass Spectrometry
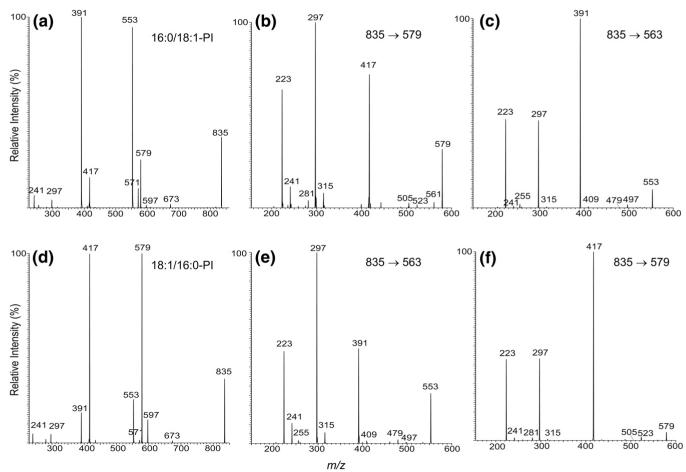
Both the 16:0/18:1-PI and 18:1/16:0-PI standards yield prominent [M – H]− ions at m/z 835, when subjected to ESI. The IT MS2 product-ion spectrum of 16:0/18:1-PI (Figure 2a) is dominated by the ions at m/z 553 and 579, arising from losses of the oleic (18:1) and palmitic (16:0) acids, respectively. The m/z 553 ion is more abundant than the m/z 579 ion, indicating that the 16:0- and 18:1-fatty acyl moieties are located at sn-1 and sn-2, respectively, consistent with the notion that the ion reflecting the loss of the fatty acid substituent at sn-2 is more abundant than that reflecting the similar loss at sn-1 [31, 32]. The assignment of the fatty acyl substituents is also consistent with the observation of a higher abundance of the ion at m/z 571 than the ion at m/z 597, reflecting losses of the 18:1- and 16:0-fatty acyl substituents as ketenes, respectively.
Figure 2.
The IT MS2 spectrum of the [M – H]− ion of 16:0/18:1-PI at m/z 835 (a) and its IT MS3 spectra of the ions at m/z 579 (835 → 579) (b) and at m/z 553 (835 → 553) (c). The IT MS2 spectrum of the [M – H]− ion of 18:1/16:0-PI at m/z 835 (d) and its IT-MS3 spectra of the ions at m/z 553 (835 → 553) (e) and at m/z 579 (835 → 579) (f).
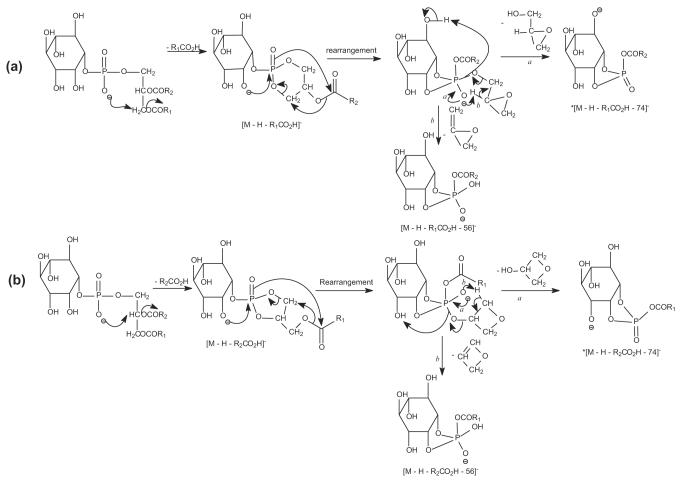
Further loss of the inositol moiety from ions at m/z 579 (835 – R2CO2H) and 553 (835 – R1CO2H) gives rise to the ions at m/z 417 and 391, respectively [32]. The m/z 391 ion (835 – R2CO2H – 162) involving loss of the fatty acid at sn-2 is more abundant than the m/z 417 ion (835 – R1CO2H – 162) involving loss of the fatty acid at sn-1, further supporting the assignment that the 16:0- and 18:1-fatty acyl substituents are located at sn-1 and sn-2 of the glycerol backbone, respectively. The fragmentation pathways for the loss of the inositol residue are supported by the IT MS3 spectra of the m/z 579 (835 → 579) (Figure 2b) and 553 (835 → 553) (Figure 2c) ions. The MS3 spectrum of the ion at m/z 579 also contains ions at m/z 523 (579 – 56) and 505 (579 – 74) that arise from various losses of the glycerol moiety. The analogous ions at m/z 497 (553 – 56) and 479 (553 – 74) were also observed in the MS3 spectrum of the m/z 553 ion (Figure 2c). The pathways leading to the formation of these ions may involve a rearrangement process that forms a phosphoester intermediate, followed by elimination of the glycerol moiety in various forms (Scheme 1). Although these ions are of low abundance, the analogous ions from the similar fragmentation processes are prominent in the MS3 spectra of the [M – H – R1(or 2)CO2H]− ions arising from monoacyl- or diacylPIMs and are indicative for the fatty acyl substituents that reside at glycerol backbone (that is, R1CO- and R2CO-), allowing us to distinguish them from those residing at the glycoside [28].
Scheme 1.
The mechanism proposed for formation of *[M-H-RxCO2H-74]− and [M-H-RxCO2H-56]− ions (x = 1,2). * = the anionic charge site is not to be specific and probably on one of the oxygens of the inositol.
Further losses of the 18:1-fatty acyl substituent as an acid and as a ketene from the ion at m/z 579 gives rise to m/z 297 and 315, respectively (Figure 2b). These latter ions are also seen in the MS3 spectrum of the m/z 553 ion (Figure 2c) arising from the analogous losses of the 16:0-fatty acyl substituent, although the ion at m/z 315 is of low abundance. This preferential loss of the second fatty acyl moiety as a ketene molecule from the [M – H – R1CO2H]− ion at m/z 579, over that from the [M – H – R2CO2H]− precursor ion at m/z 553 is also useful for differentiation of the fatty acyl substituents at the glycerol backbone.
The above fragmentation processes are further supported by the IT MS2 spectrum of the [M – H]− ion of 18:1/16:0-PI at m/z 835 (Figure 2d), and by its IT MS3 spectra of the ions at m/z 579 (835 → 579) (Figure 2e) and at 553 (835 → 553) (Figure 2f). The spectra from MSn (n = 2, 3) from the two isomers are readily distinguishable and are applicable for differentiation of the positional isomers of PI.
Structural Characterization of PI Species in the Lipid Extracts from M. bovis BCG
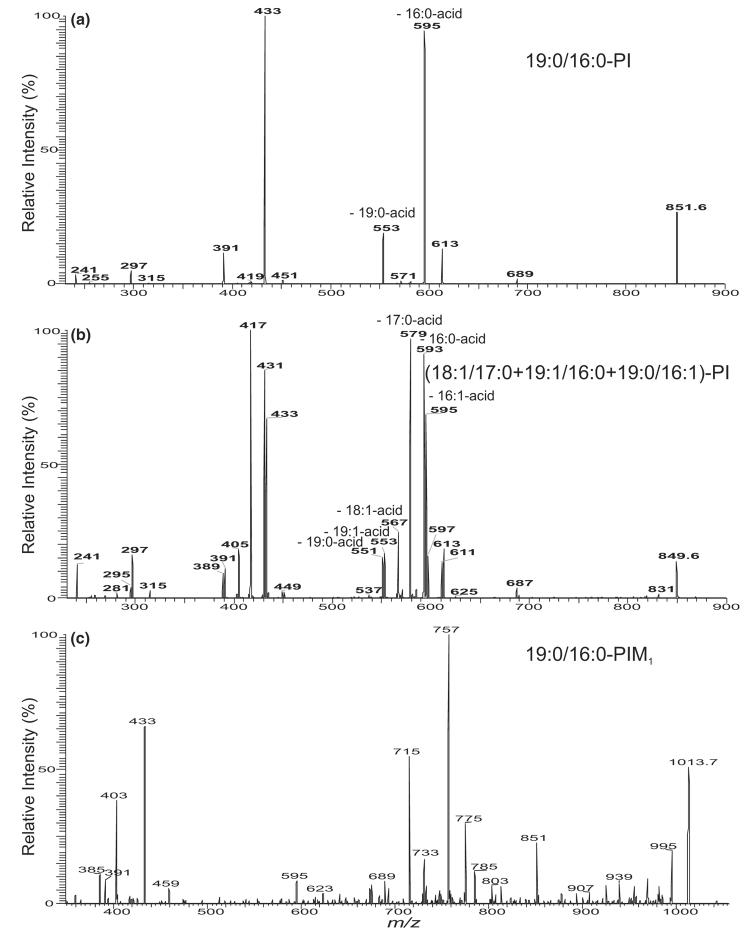
In addition to the ion at m/z 835 that arises from an 18:1/16:0-PI molecule as described earlier, the major PI species in M. bovis BCG was seen at m/z 851 (Figure 1b and c). The MS2 spectrum of the m/z 851 ion is dominated by the ions at m/z 595 and 553 (Figure 3a), arising from the losses of the palmitic (16:0) and tubercurostearic (10-methyl-octadecanoic acid) (19:0) acids, respectively. The m/z 595 ion is more abundant than the m/z 553 ion, indicating that the 16:0- and 19:0-fatty acyl moieties reside at sn-2 and sn-1, respectively. The profile of the spectrum is similar to that arising from 18:1/16:0-PI (Figure 2d), therefore, a 19:0/16:0-PI structure can be assigned.
Figure 3.
The IT MS2 spectra of the [M – H]− ions of 19:0/16:0-PI at m/z 851 (a) and of the ion at m/z 849 (b), which consists of two major 18:1/17:0-PI and 19:1/16:0-PI isomers, along with a minor 19:0/16:1-PI structure. Panel (c) shows the IT MS2 spectrum of the [M – H]− ion of 19:0/16:0-PIM1 at m/z 1013, which contains the ions analogous to those arising from 19:0/16:0-PI (a).
The ions at m/z 831, 833, and 849 (Figure 1b and c) are composed with several isomeric structures (Table 1). For example, the MS2 spectrum of the ion at m/z 849 (Figure 3b) contains a major set of the ions at m/z 595 (849 – C15H29CO2H) and 551 (849 – C18H37CO2H), arising from losses of 16:1- and 19:0-fatty acid moieties, respectively. The ion sets at m/z 593 (849 – C15H31CO2H) and 553 (849 – C18H35CO2H), arising from losses of 16:0- and 19:1-fatty acid moieties, respectively, and at m/z 567 (849 – C17H33CO2H) and 579 (849 – C16H33CO2H), arising from losses of 18:1- and 17:0-fatty acid moieties, respectively, are also present. The former ions in each set are respectively more abundant than the latter ions, indicating that the m/z 849 represent the major 19:0/16:1-PI species, as well as 19:1/16:0-PI and 17:0/18:1-PI structures. The structural assignment is also consistent with the presence of the ions at m/z 433/389, 431/391, and 417/405, arising from further loss of the inositol residue.
Table 1.
Composition of PI, PIMs, and 2-lyso-PIMs from M. bovis BCG
| [M – H]− | Structure | [M – H]− | Structure | [M – H]− | Structure |
|---|---|---|---|---|---|
| 809.6 | 16:0/16:0-PI | 851.6 | 19:0/16:0-PI | 1295.7 | 16:0/16:0-PIM3 |
| 823.6 | 17:0/16:0-PI | 861.6 | 18:1/18:1-PI | 1321.7 | 18:1/16:0-PIM3 |
| 19:0/14:0-PI | 863.6 | 18:0/18:1-PI | 1337.7 | 19:0/16:0-PIM3 | |
| 831.6 | 18:1/16:2-PI | 971.6 | 16:0/16:0-PIM1 | 1781.8 | 16:0/16:0-PIM6 |
| 833.6 | 18:2/16:0-PI | 997.6 | 18:1/16:0-PIM1 | 1807.8 | 18:1/16:0-PIM6 |
| 18:1/16:1-PI | 1013.6 | 19:0/16:0-PIM1 | 1823.9 | 19:0/16:0-PIM6 | |
| 835.6 | 18:1/16:0-PI | 1025.6 | 18:0/18:1-PIM1 | 895.6 | 16:0/0-PIM2 |
| 847.6 | 19:2/16:0-PI | 1033.6 | 16:0/16:0-PIM2 | 1543.6 | 16:0/0-PIM6 |
| 19:0/16:2-PI | 1159.6 | 18:1/16:0-PIM2 | 1781.8 | 16:0-(16:0/0)-PIM6 | |
| 19:1/16:1-PI | 1175.7 | 19:0/16:0-PIM2 | 1807.8 | 16:0-(18:1/0)-PIM6 | |
| 849.6 | 19:0/16:1-PI | 1187.7 | 18:0/18:1-PIM2 | 1823.9 | 16:0-(19:0/0)-PIM6 |
| 19:1/16:0-PI | 1203.7 | 19:0/18:0-PIM2 | |||
| 17:0/18:0-PI |
Characterization of Molecular Species of PIMs
a. PIM1
We were able to characterize four ion species at m/z 971, 997, 1013, and 1025 that belong to the PIM1 family, although they are of extremely low abundance. It is not clear, however, whether these ions were generated from dissociation of the higher glycosylated PIMs by elimination of the glycosyl residue upon ESI. As shown in Figure 3c, the IT MS2 spectrum of the m/z 1013 ion contains the ions at m/z 757 and 715, corresponding to the losses of the palmitic (16:0) and tuber-curostearic (19:0) acids, respectively, along with the ions at m/z 775 (1013 – C14H29CH=CO) and 733 (1013 – C17H35CH=CO), arising from the respective losses of the corresponding fatty acyl substituents as ketenes. The ion at m/z 757 is more abundant than the ion at m/z 715 ion and the ion at m/z 775 is also more abundant than the ion at m/z 733, indicating that the 16:0- and 19:0-fatty acyl substituents are located at sn-2 and sn-1 of the glycerol backbone, respectively. This result is similar to that observed for 19:0/16:0-PI (Figure 3a), consistent with the notion that the ions arising from losses of the fatty acid substituent at sn-2 as an acid and as a ketene are more abundant than those arising from the similar losses at sn-1, respectively.
The loss of the mannosyl moiety (mannose 1) gives rise to the ion at m/z 851 (1013 – 162), followed by loss of the inositol moiety to yield the ion at m/z 689 (851 – 162), which gives rise to ions at m/z 433 and 391 by further losses of the 16:0- and 19:0-fatty acid substituents, respectively. Again, the ion at m/z 433 (689 – C15H31CO2H) is more abundant than the ion at m/z 391 (689 – C18H37CO2H), consistent with the assignment that the 16:0- and 19:0-fatty acyl moieties are located at sn-2 and sn-1, respectively.
The ion at m/z 459 (1013 – C15H31CO2H – C18H37CO2H) is formed from the combined losses of the 16:0- and 19:0-fatty acid substituents and the ion at m/z 477 arises from loss of the 16:0-fatty acid at sn-2 (or the 19:0-fatty acid at sn-1), followed by loss of the 19:0-fatty acid at sn-1 (or the 16:0-fatty acid at sn-2) as a ketene. Elimination of the diacylglycerol moiety from m/z 1013 gives rise to m/z 403 (Scheme 2, route a), which signifies a PIM1 molecule. An analogous ion arising from the similar loss of the diacylglycerol moiety is also present in all the MS2 spectra of the [M – H]− ions from the PIM families, including monoacyl- and diacyl-PIMs and is useful for determination of their acylation and glycosylation states [28]. The above information indicates that the ion at m/z 1013 consists of a (19:0/16:0)-PIM1 structure. Similar results were also observed for the ions at m/z 997, 971, and 1025 (data not shown), representing (18:1/16:0)-PIM1, 16:0/16:0-PIM1, and 18:0/18:1-PIM1 structures, respectively.
Scheme 2.
The major fragmentation processes commonly observed for PIMs following resonance excitation in an ion-trap.
b. PIM2
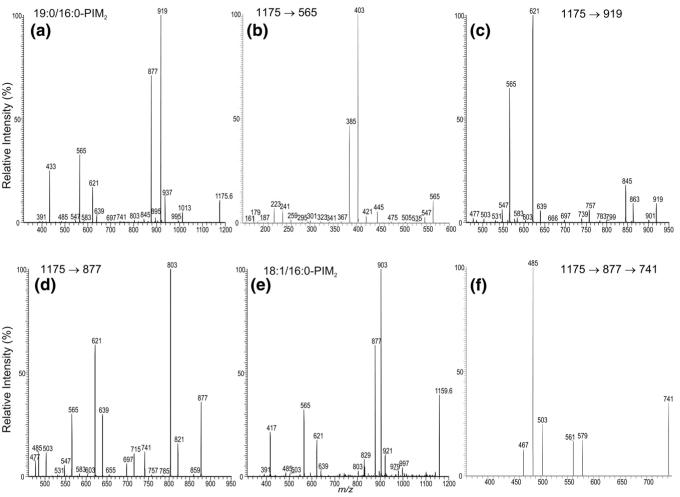
The [M – H] ]− ions of the PIM2 family were observed at m/z 1175, 1159, and 1133, respectively (Figure 1b). Fragmentation processes of these ions are similar to those observed for PIM1. As shown in Figure 4a, the MS2 spectrum of the m/z 1175 ion contains fragment ions analogous to those observed for 19:0/16:0-PIM1 (Figure 3c). However, the ions at m/z 919 (1175 – C15H31CO2H) and 877 (1175 – C18H37CO2H), reflecting losses of the 16:0- and 19:0-fatty acid substituents, respectively, are among the most prominent, whereas the ions at m/z 937 and 895, reflecting losses of the similar fatty acid substituents as ketenes, respectively, are of low abundance. Again, the assignment of the 16:0- and 19:0-fatty acyl substituents at sn-2 and sn-1, respectively, are based on the findings that the ions at m/z 937 and 919 are respectively more abundant than the ions at m/z 895 and 877.
Figure 4.
The IT MS2 spectrum of the [M – H]− ion of 19:0/16:0-PIM2 at m/z 1175 (a) and its IT MS3 spectra of the ions at m/z 565 (1175 → 565) (b), at m/z 919 (1175 → 919) (c), at m/z 877 (1175 → 877) (d), and the MS4 spectrum at m/z 741 (1175 → 877 → 741) (f). Panel (e) shows the IT MS2 spectrum of the [M – H]− ion of 18:1/16:0-PIM2 at m/z 1159.
The combined losses of the 16:0- and 19:0-fatty acyl substituents give rise to the ion at m/z 621, and the ion at m/z 639 corresponds to losses of the 19:0-fatty acid and the 16:0-fatty acyl ketene as described earlier. The ions at m/z 565 (1175 – 610) and 485 arise from loss of the 19:0/16:0-diacylglycerol and 19:0/16:0-phosphatidic acid residues by cleavages of the P—OO and C—OO bonds, respectively (Scheme 2, routes a and b). These two ions are 162 Da higher than the analogous ions observed in the MS2 spectrum of 19:0/16:0-PIM1 at m/z 1013 (Figure 3c), suggesting the presence of an additional mannosyl group attached to the O-2 of myo-inositol. The presence of this additional mannosyl residue is further supported by the MS3 spectrum of the ion at m/z 565 (Figure 4b), which shows the ions at m/z 403 (565 – 162) and 385 (565 – 180) arising from loss of a mannosyl moiety, as well as the ions at m/z 241 (403 – 162) and 223 (403 – 180) arising from further loss of an additional glycosyl moiety.
The ions at m/z 845 (919 – 74) and 803 (877 – 74) (Figure 4a) arise from m/z 919 and 877, respectively, by the similar fragmentation pathway that eliminates the glycerol moiety as described for PI. This pathway is supported by the MS3 spectra of the [M–H–R CO2H]− ion at m/z 919 (1175 → 919, Figure 4c), and the [M – H–R1CO2H]− ion at m/z 877 (1175 → 877, Figure 4d). In the former spectrum, the ion at m/z 845 (863 – 74) is slightly more abundant than the ion at m/z 863 (919 – 56), arising from the various losses of the glycerol moieties; whereas the analogous ion at m/z 803 (877 – 74) is the most prominent and is much more abundant than the ion at m/z 821 (877 – 56) in the latter spectrum. The profiles of these two spectra are readily distinguishable, similar to those observed for PI. The apparent differences in the MS3 spectra arising from the [M – H – R CO2H]− and from the [M – H – R CO2H]− ions provide a simple method for determining the positions of the fatty acyl substituents on the glycerol backbone. The unique losses of the 56 and 74 Da observed in the MS3 spectra of the [M – H – R1(or 2)CO2H]− ions also allow distinction of the fatty acyl substituents residing at the glycerol backbone from those residing at mannosyl or inositol residue in the PIMs containing one or two additional fatty acid moieties (that is, monoacyl- and diacyl PIMs) [28]. Similar results were also observed for the [M – H]− ions of 18:1/16:0-PIM2 at m/z 1159 (Figure 4e) and of 16:0/16:0-PIM2 at m/z 1133 (not shown).
In Figure 4d, an ion at m/z 741 (877 – 136) is also observed. Further dissociation of the m/z 741 ion gives rise to ions at m/z 485 and 503 (Figure 4f), corresponding to losses of a 16:0-fatty acyl substituent as an acid and as an ketene, respectively. These results indicate that the ion at m/z 741 probably represents a deprotonated palmitoyl-Man-Ino-Man anion arising from further loss of a bicyclic glycerophosphate ester moiety (136 Da) (discussed later in 2-lyso-PIMs), suggesting that the ion at m/z 1175 may also consist of a minor 16:0-(19:0/0)-PIM2 isomer, as previously described by Gilleron et al. [25]. The presence of the 16:0-(19:0/0)-PIM2 isomer is also consistent with the observation of a minor peak at m/z 803 in Figure 4a, signifying the attachment of a palmitoyl residue to mannose 1 [28]. However, Khoo et al. reported that monoacyl-2-lyso-PIM2s, rather than PIM2s (diacylated PIM2) are the predominant species found in the lipid extract from Mycobacterium tuberculosis [23].
c. PIM3
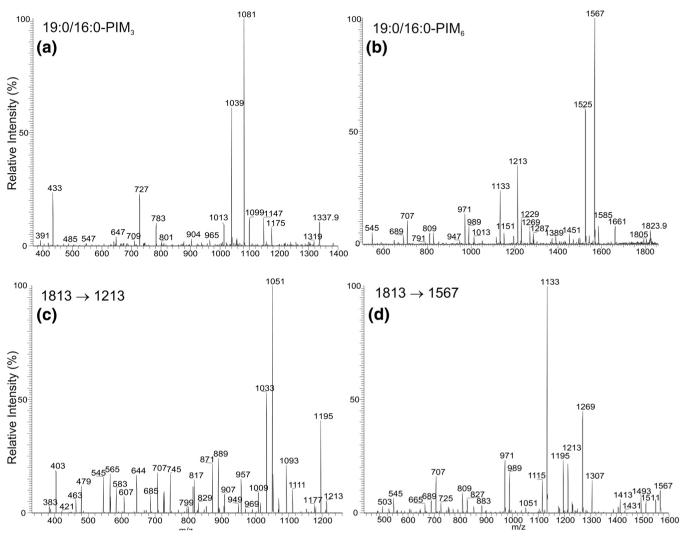
The ions at m/z 1295.8, 1321.9, and 1337.9, corresponding to 16:0/16:0-, 18:1/16:0-, and 19:0/16:0-PIM3, respectively, are also of low abundance. Again, it is not clear whether these ions originate from the dissociation of other PIMs with higher glycosylation state during the process of ESI. The profile of the IT MS2 spectrum of the ion at m/z 1337 (Figure 5a) is nearly identical to that observed for 19:0/16:0-PIM1 (Figure 3c) and 19:0/16:0-PIM2 (Figure 4a), consistent with the assignment that the 16:0- and 19:0-fatty acyl substituents are located at sn-2 and sn-1, respectively. The ion at m/z 1175 is produced from loss of a mannosyl residue, probably from the terminal mannosyl residue attached to mannose 2, whereas the ion at m/z 1013 probably arises from direct loss of the disaccharide mannosyl residue. The m/z 783 ion arises from the combined losses of the 16:0- and 19:0-fatty acids, and the ion at m/z 801 mainly arises from loss of the 19:0-fatty acid plus the loss of the 16:0-fatty acyl substituent as a ketene, as described earlier. The ions at m/z 727 and 647 are formed from the loss of the diacylglycerol and the phosphatidic acid moieties, respectively. These two ions are 162 Da higher than the analogous ions at m/z 565 and 485 observed in the MS2 spectrum of 19:0/16:0-PIM2 at m/z 1175 (Figure 4a), indicating that the molecule contains an additional mannosyl residue. Similar results were also observed for the [M – H]− ions of 16:0/16:0-PIM3 at m/z 1295.8 and of 18:1/16:0-PIM3 at m/z 1321.8 (data not shown).
Figure 5.
The IT MS2 product-ion spectrum of the [M – H]− ion of 19:0/16:0-PIM3 at m/z 1337 (a) and of 19:0/16:0-PIM6 at m/z 1823 (b), and its MS3 product-ion spectra of the ions at m/z 1213 (1823 → 1213) (c) and at m/z 1567 (1823 → 1567) (d).
d. PIM6
The ions corresponding to the PIM4 and PIM5 families were not observed. However, the ions belong to the PIM6 subclass were observed at m/z 1781.9, 1807.9, and 1823.9 (Figure 1d). The MS2 spectrum of the m/z 1823 ion (Figure 5b) is dominated by the ions at m/z 1567 and 1525 arising from losses of the 16:0-fatty acid substituent at sn-2 and the 19:0-fatty acyl substituent at sn-1, respectively. The ions at m/z 1585 and 1543 arise from the similar losses of the 16:0- and 19:0-fatty acyl substituents as ketenes, respectively. The ions corresponding to losses of the diacylglycerol and the phosphatidic acid moieties, respectively, were observed at m/z 1213 and 1133. These two ions are 486 Da (162 × 3) higher than the analogous ions at m/z 727 and 647 observed in the MS2 spectrum of 19:0/16:0-PIM3 (Figure 5a), suggesting that the molecule contained an additional trimannosyl residue. These two ions bearing the sugar moiety are more prominent than the analogous ions at m/z 727 and 647 observed for 19:0/16:0-PIM3 (Figure 5a), which are also more prominent than the analogous ions at m/z 565 and 485 observed for 19:0/16:0-PIM2 (Figure 4a). These results are consistent with the findings that the abundances of the ions that reflect the sugar moiety increase as the glycosyl chain increases [33], similar to that observed for monoacyl- and diacylacyl-PIMs [28].
The MS3 spectrum arising from the m/z 1213 ion (1823 → 1213, Figure 5c) consists of series ions at m/z 1051 (1213 − 162), 889 (1213 − 2 × 162), 727 (1213 − 3 × 162), 565 (1213 − 4 × 162), and 403 (1213 − 4 × 162), by losses of the various glycoside residues; whereas the m/z 1133 ion also undergoes similar losses of the mannoside residues to give rise to ions at m/z 971, 809, 647, and 485, as confirmed by its MS3 spectrum (1823 → 1133, data not shown). The ion at m/z 1013 (Figure 5b) is equivalent to the [M – H]− ion of 19:0/16:0-PIM1, arising from direct loss of a pentamannosyl residue by the same bond cleavage as observed for 19:0/16:0-PIM3.
Further dissociation of the m/z 1567 ion (1823 → 1567) (Figure 5d) leads to ions at m/z 1511 (1567 – 56) and 1493 (1567 – 74); the m/z 1525 ion also gives rise to ions at m/z 1469 (1525 – 56) and 1451 (1525 – 74) (1823 → 1525, data not shown) by various losses of the glycerol residue by the mechanism as described earlier. These unique patterns observed in the MS3 spectra further confirm that the fatty acyl substituents are located at the glycerol backbone. Similar results were also observed for the ions at m/z 1807 and 1781, which represent the (18:1/16:0)-PIM6 and (16:0/16:0)-PIM6 structures, respectively (data not shown).
In addition to the assigned structure of 19:0/16:0-PIM6, the ion at m/z 1823 may also represent a 16:0-(19:0/0)-PIM6, a 2-lyso-PIM6 molecule. This is based on the findings that the spectrum also contains the ion at m/z 1389, arising from further loss of 136 Da from 1525, which may arise from loss of the 19:0-fatty acid substituent at sn-1. The structural characterization of 2-lyso-PIM is discussed below.
Characterization of 2-Lyso-PIMs
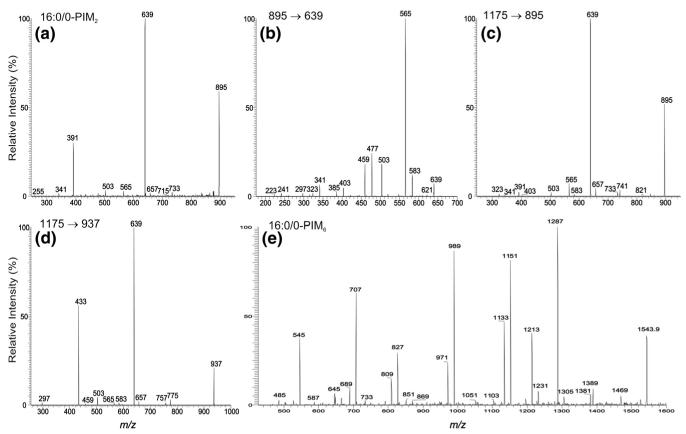
The ions observed at m/z 895 and 1543 probably belong to 2-lyso-PIM species. The IT MS2 spectrum of the m/z 895 ion (Figure 6a) is dominated by the ion at m/z 639, arising from loss of a 16:0-fatty acid, and the ion at m/z 657, arising from loss of the 16:0-fatty acyl substituent as a ketene, is of low abundance. The ion at m/z 733 (895 – 162) arises from loss of a sugar moiety, whereas the m/z 503 ion arises from m/z 639, probably by loss of a bicyclic glycerophosphate ester moiety of 136 Da (Scheme 3) [34]. This fragmentation pathway is supported by the IT MS3 spectrum of m/z 639 (895 → 639) (Figure 6b), which yields the ion at m/z 503. The spectrum also contains a prominent ion at m/z 565 (639 – 74), along with the ion at m/z 583 (639 – 56). The profile of these two ions indicates that the ion at m/z 639 is a fragment ion from a 16:0/0-PIM2 precursor that eliminates the 16:0-fatty acyl substituent at sn-1.
Figure 6.
The IT MS2 spectrum of the [M – H]− ion of 16:0/0-PIM2 at m/z 895 (a), and its IT MS3 spectrum of the ion at m/z 639 (895 → 639) (b). Panel (c) shows the IT MS3 spectrum of the ion at m/z 895 (1175 → 895), generated by elimination of the 19:0-fatty acid substituent at sn-2 as a ketene from the [M – H]− ion of 19:0/16:0-PIM2 at m/z 1175. The ion is equivalent to a 0/16:0-PIM2, a 1-lyso-PIM2 isomer. Panel (d) shows the IT MS3 spectrum of the ion at m/z 937 (1175 → 937), which is equivalent to a 19:0/0-PIM2, a 2-lyso-PIM2 isomer generated by elimination of the 16:0-fatty acid substituent at sn-1 as a ketene from 19:0/16:0-PIM2. Panel (e) shows the IT MS2 spectrum of the [M – H]− ion of 16:0/0-PIM6 at m/z 1543.
Scheme 3.
The fragmentation pathways proposed for monoacyl-2-lyso PIM2.
To confirm the assignment, an IT MS3 spectrum of the [M – H]− ion of 0/16:0-PIM2 at m/z 895 ion, a 1-lyso-PIM2 isomeric ion, generated from 19:0/16:0-PIM2 at m/z 1175 by loss of the 19:0-fatty acyl substituent at sn-1 as a ketene was obtained. The spectrum (Figure 6c) is similar to that arising from 16:0/0-PIM2 (Figure 6a), but the ion at m/z 391 is of low abundance. In contrast, an analogous ion at m/z 433 is abundant in the MS3 spectrum of (19:0/0)-PIM2 at m/z 937 (1175 → 937) (Figure 6d), a 2-lyso-PIM2 isomer generated from 19:0/16:0-PIM2 by primary loss of the 16:0-fatty acyl substituent at sn-2 as a ketene. The profile of the spectrum (Figure 6d) is similar to that in Figure 6a, but different from that in Figure 6c, supporting the idea that the MS2 spectrum of the ion at m/z 895 (Figure 6a) arises from a 2-lyso- rather than a 1-lyso-PIM2 isomer.
The MS2 spectrum of the [M – H]− ion of 16:0/0-PIM6 at m/z 1543 (Figure 6e) contains a prominent ion at m/z 1287 arising from loss of the 16:0-fatty acyl substituent. Again, the spectrum also contains the ion at m/z 1151, arising from loss of a bicyclic glycerophosphate ester moiety (136 Da) from m/z 1287. However, the analogous ion arising from loss of 136 is not observed for all the PIM, monoacyl-, and diacyl-PIM subclasses [28] and appears to be observed only for lyso-PIM families. The ion at m/z 1151 gives two series ions at m/z 989 (1151 − 162), 827 (1151 − 2 × 162), and 665 (1151 − 3 × 162) and at m/z 1133 (1151 – H2O), 971 (1133 − 162), 809 (1133 − 2 × 162), and 647 (1133 − 3 × 162) by various losses of the sugar moieties. These ions are of high abundance, consistent with the notion that the ions bearing the sugar moiety become more prominent as the glycosyl chain increases as described earlier.
Conclusions
The positions of the fatty acyl substituents on the glycerol backbone of the PIMs can be easily assigned because the [M – H – R2CO2H]− and [M – H – R2CH=CO]− ions are respectively more abundant than the [M – H – R1CO2H]− and [M – H – R1CH=CO]− ions. This assignment can also be established by the findings that the profile of the ion-pair corresponding to neutral losses of 74 and 56 Da in the MS3 spectrum of the [M – H – R2CO2H]− ion is readily distinguishable from that in the MS3 spectrum of the [M – H – R1CO2H]− ion. These features in the MS3 spectra are useful for the confirmation of positions of the fatty acyl substituents, in particular, when the fatty acyl residues attached to the inositol and to the mannosyl residues are to be distinguished. The multiple-stage IT mass spectrometric approach toward to structural characterization of complex PIM molecules, including monoacyl-PIMs (triacylated PIMs) and diacyl-PIMs (tetraacylated PIMs), is described in a companion paper that follows [28]
Acknowledgments
This research was supported by US Public Health Service Grants P41-RR-00954, R37-DK-34388, P60-DK-20579, P01-HL-57278, and P30-DK-56341 and AI 055936.
References
- 1.Anderson RJ, Renfrew AG. The Chemistry of the Lipoids of Tubercle Bacilli. XIII. The Occurrence of Mannose in the Phosphatide from Human Tubercle Bacilli. J. Am. Chem. Soc. 1930;52:1252–1254. [Google Scholar]
- 2.Anderson RJ. The Chemistry of the Lipoids of Tubercle Bacilli. XIV. The Occurrence of Inosite in the Phosphatide of Human Tubercle Bacilli. J. Am. Chem. Soc. 1930;52:1607–1608. [Google Scholar]
- 3.Anderson RJ, Roberts EG. The Chemistry of the Lipoids of Tubercle Bacilli. XXI. The Polysaccharide Occurring in the Phosphatide from the Human Tubercle Bacilli. J. Am. Chem. Soc. 1930;52:5023–5029. [Google Scholar]
- 4.Anderson RJ, Lothrop WC, Creighton MM. The Chemistry of the Lipids of Tubercle Bacilli. LIII. Studies on the Phosphatide of the Human Tubercle Bacillus. J. Biol. Chem. 1938;125:299–308. [Google Scholar]
- 5.Lee YC, Ballou CE. Complete Structures of the Glycophospholipids of Mycobacteria. Biochemistry. 1965;4:1395–1404. doi: 10.1021/bi00883a026. [DOI] [PubMed] [Google Scholar]
- 6.Ballou CE, Vilkas E, Lederer E. Structural Studies on the Myoinositol Phospholipids of Mycobacterium tuberculosis (var. bovis, strain BCG) J. Biol. Chem. 1963;238:69–76. [PubMed] [Google Scholar]
- 7.Ballou CE, Lee YC. The Structure of a Myoinositol Mannoside from Mycobacterium tuberculosis Glycolipid. Biochemistry. 1964;3:682–685. doi: 10.1021/bi00893a014. [DOI] [PubMed] [Google Scholar]
- 8.Lee YC, Ballou CE. Structural Studies on the Myoinositol Manno-sides from the Glycolipids of Mycobacterium tuberculosis and Myco-bacterium phlei. J. Biol. Chem. 1964;239:1316–1327. [PubMed] [Google Scholar]
- 9.Sasaki A. Isolation and Characterization of Serologically Active Phosphatidylinositol Oligomannosides of Mycobacterium tuberculosis. J. Biochem. (Tokyo) 1975;78:547–554. doi: 10.1093/oxfordjournals.jbchem.a130939. [DOI] [PubMed] [Google Scholar]
- 10.Hunter SW, Brennan PJ. Evidence for the Presence of a Phosphatidylinositol Anchor on the Lipoarabinomannan and Lipomannan of Mycobacterium tuberculosis. J. Biol. Chem. 1990;265:9272–9279. [PubMed] [Google Scholar]
- 11.Rhoades ER, Hsu FF, Torrelles JB, Turk J, Chatterjee D, Russell DG. Identification and Macrophage-activating Activity of Glycolipids Released from Intracellular Mycobacterium bovis BCG. Mol. Microbiol. 2003;48:875–888. doi: 10.1046/j.1365-2958.2003.03473.x. [DOI] [PubMed] [Google Scholar]
- 12.Fischer K, Scotet E, Niemeyer M, Koebernick H, Zerrahn J, Maillet S, Hurwitz R, Kursar M, Bonneville M, Kaufmann SHE, Schaible UE. Mycobacterial Phosphatidylinositol Mannoside Is a Natural Antigen for CD1d-restricted T Cells. Proc. Natl. Acad. Sci. U.S.A. 2004;101:10685–10690. doi: 10.1073/pnas.0403787101. [DOI] [PMC free article] [PubMed] [Google Scholar]
- 13.Chatterjee D, Khoo KH. Mycobacterial Lipoarabinomannan: An Extraordinary Lipoheteroglycan with Profound Physiological Effects. Glycobiology. 1998;8:113–120. doi: 10.1093/glycob/8.2.113. [DOI] [PubMed] [Google Scholar]
- 14.Apostolou I, Takahama Y, Belmant C, Kawano T, Huerre M, Marchal G, Cui J, Taniguchi M, Nakauchi H, Fournie JJ, Kourilsky P, Gachelin G. Murine Natural Killer Cells Contribute to the Granulomatous Reaction Caused by Mycobacterial Cell Walls. Proc. Natl. Acad. Sci. U.S.A. 1999;96:5141–5146. doi: 10.1073/pnas.96.9.5141. [DOI] [PMC free article] [PubMed] [Google Scholar]
- 15.Cywes C, Hoppe HC, Daffe M, Ehlers MR. Nonopsonic Binding of Mycobacterium tuberculosis to Complement Receptor Type 3 Is Mediated by Capsular Polysaccharides and Is Strain Dependent. Infect. Immun. 1997;65:4258–4266. doi: 10.1128/iai.65.10.4258-4266.1997. [DOI] [PMC free article] [PubMed] [Google Scholar]
- 16.Hoppe HC, de Wet BJ, Cywes C, Daffe M, Ehlers MR. Identification of Phosphatidylinositol Mannoside as a Mycobacterial Adhesin Mediating Both Direct and Opsonic Binding to Nonphagocytic Mammalian Cells. Infect. Immun. 1997;65:3896–3905. doi: 10.1128/iai.65.9.3896-3905.1997. [DOI] [PMC free article] [PubMed] [Google Scholar]
- 17.Beatty WL, Rhoades ER, Ullrich HJ, Chatterjee D, Heuser JE, Russell DG. Trafficking and Release of Mycobacterial Lipids from Infected Macrophages. Traffic. 2000;1:235–247. doi: 10.1034/j.1600-0854.2000.010306.x. [DOI] [PubMed] [Google Scholar]
- 18.Chatterjee D, Hunter SW, McNeil M, Brennan PJ. Lipoarabinomannan: Multiglycosylated Form of the Mycobacterial Mannosylphosphatidylinositols. J. Biol. Chem. 1992;267:6228–6233. [PubMed] [Google Scholar]
- 19.Severn WB, Furneaux RH, Falshaw R, Atkinson PH. Chemical and Spectroscopic Characterisation of the Phosphatidylinositol Mannooligosaccharides from Mycobacterium bovis AN5 and WAg201 and Mycobacterium smegmatis mc2 155. Carbohydr. Res. 1998;308:397–408. doi: 10.1016/s0008-6215(98)00108-6. [DOI] [PubMed] [Google Scholar]
- 20.Pangborn MC, McKinney JA. Purification of Serologically Active Phosphoinositides of Mycobacterium tuberculosis. J. Lipid Res. 1966;7:627–633. [PubMed] [Google Scholar]
- 21.Brennan PJ, Ballou CE. Biosynthesis of Mannophosphoinositides by Mycobacterium phlei. Enzymatic Acylation of the Dimannophosphoinositides. J. Biol. Chem. 1968;243:2975–2984. [PubMed] [Google Scholar]
- 22.Khuller GK, Subrahmanyam D. On the Mannophosphoinositides of Mycobacterium 607. Experientia. 1968;24:851–852. doi: 10.1007/BF02144914. [DOI] [PubMed] [Google Scholar]
- 23.Khoo KH, Dell A, Morris HR, Brennan PJ, Chatterjee D. Structural Definition of Acylated Phosphatidylinositol Mannosides from Mycobacterium tuberculosis: Definition of a Common Anchor for Lipomannan and Lipoarabinomannan. Glycobiology. 1995;5:117–127. doi: 10.1093/glycob/5.1.117. [DOI] [PubMed] [Google Scholar]
- 24.Gilleron M, Bala L, Brando T, Vercellone A, Puzo G. Mycobacterium tuberculosis H37Rv Parietal and Cellular Lipoarabinomannans: Characterization of the Acyl- and Glyco-forms. J. Biol. Chem. 2000;275:677–684. doi: 10.1074/jbc.275.1.677. [DOI] [PubMed] [Google Scholar]
- 25.Gilleron M, Ronet C, Mempel M, Monsarrat B, Gachelin G, Puzo G. Acylation State of the Phosphatidylinositol Monnosides from Myco-bacterium bovis Bacillus Calmette Guérin and Ability to Induce Granuloma and Recruit Natural Killer T Cells. J. Biol. Chem. 2001;276:34896–34904. doi: 10.1074/jbc.M103908200. [DOI] [PubMed] [Google Scholar]
- 26.Gilleron M, Quesniaux VFJ, Puzo G. Acylation State of the Phosphatidylinositol Hexammanosides from Mycobacterium bovis Bacillus Calmette Guérin and Mycobaterium tuberculosis H37Rv and Its Implication in toll-like receptor response. J. Biol. Chem. 2003;278:29880–29889. doi: 10.1074/jbc.M303446200. [DOI] [PubMed] [Google Scholar]
- 27.Nigou J, Gilleron M, Brando T, Puzo G. Structural Analysis of Mycobacterial Lipoglycans. Appl. Biochem. Biotechnol. 2004;118:253–268. doi: 10.1385/abab:118:1-3:253. [DOI] [PubMed] [Google Scholar]
- 28.Hsu FF, Turk J, Owens R, Rhoades ER, Russell DG. Structural Characterization of Phosphatidylinositol Mannosides from Mycobacterium bovis BCG by Multiple-Stage Quadrupole Ion-Trap Mass Spec-trometry with Electrospray Ionization. II. Monoacyl- and Diacyl-PIMs. J. Am. Soc. Mass Spectrom. 2007;18:479–492. doi: 10.1016/j.jasms.2006.10.020. [DOI] [PMC free article] [PubMed] [Google Scholar]
- 29.Folch J, Lees M, Sloane-Stanley GH. A Simple Method for the Isolation and Purification of Total Lipids from Animal Tissues. J. Biol. Chem. 1957;226:497–509. [PubMed] [Google Scholar]
- 30.Morita YS, Patterson JH, Billman-Jasobe H, McConville MA. Biosynthesis of Mycobacterial Phosphatidylinositol Mannosides. Biochem. J. 2004;378:591–597. doi: 10.1042/BJ20031372. [DOI] [PMC free article] [PubMed] [Google Scholar]
- 31.Hsu FF, Turk J. Electrospray Ionization with Low-energy Collisionally Activated Dissociation Tandem Mass Spectrometry of Complex Lipids: Structural Characterization and Mechanisms of Fragmentation. In: Byrdwell WC, editor. Modern Methods for Lipid Analysis. AOCS Press; Champaign, IL: 2005. p. 61. [Google Scholar]
- 32.Hsu FF, Turk J. Characterization of Phosphatidylinositol, Phosphatidylinositol-4-phosphate, and Phosphatidylinositol-4,5-bisphosphate by Electrospray Ionization Tandem Mass Spectrometry: A Mechanistic Study. J. Am. Soc. Mass Spectrom. 2000;11:986–999. doi: 10.1016/S1044-0305(00)00172-0. [DOI] [PubMed] [Google Scholar]
- 33.Hsu FF, Turk J. Structural Determination of Glycosphingolipids as Lithiated Adducts by Electrospray Ionization Mass Spectrometry Using Low Energy Collisional-activated Dissociation on a Triple Stage Quadrupole Instrument. J. Am. Soc. Mass Spectrom. 2001;12:61–79. doi: 10.1016/S1044-0305(00)00194-X. [DOI] [PubMed] [Google Scholar]
- 34.Hsu FF, Turk J, Rhoades ER, Russell DG, Shi X, Groisman EA. Structural Characterization of Cardiolipin by Tandem Quadrupole and Multiple-Stage Quadrupole Ion-Trap Mass Spectrometry with Electro-spray Ionization. J. Am. Soc. Mass Spectrom. 2005;16:491–504. doi: 10.1016/j.jasms.2004.12.015. [DOI] [PubMed] [Google Scholar]


