

Abstract
Individual variability of the human cerebral cortex is a source of both fascination and frustration. The fascination arises because variability in cortical structure and function may account for many aspects of our unique personalities and cognitive capabilities. For neuroimagers, the frustration arises because variability presents serious obstacles when attempting to assign particular functional activation patterns to specific cortical areas. Devlin and Poldrack cogently summarize many of the key issues, and they make useful suggestions for linking function to anatomy using a standardized stereotaxic space. This commentary provides a broader perspective on the nature of individual variability that has implications for the choice of strategies used to compensate for variability. It also includes information about the actual differences between various registration strategies and introduces a new strategy for converting neuroimaging data to a standard stereotaxic space.
Devlin & Poldrack’s central message is that neuroimagers should relate their functional activation patterns to the underlying anatomical structures and circuits as precisely as possible - even though the complexity and variability of the human brain (especially the cerebral cortex) makes this a challenging endeavor. While strongly endorsing this message, we consider it important to place the discussion within a larger context of how and why individual variability in cortical structure and function arises during development. Devlin & Poldrack also recommend that the field adopt a standard stereotaxic space in order to achieve greater consistency in describing spatial localization. We endorse this recommendation, but add several technical and practical comments. We also illustrate how to make progress towards this objective using a new method for bringing data originally analyzed in different stereotaxic spaces into a consistent stereotaxic representation. A final set of comments discuss databases that provide efficient access to a growing body of neuroimaging data reported in stereotaxic coordinates.
Individual variability – what types and why?
It is useful to distinguish among four major types of individual variability of the cerebral cortex. Devlin & Poldrack mention two of them: (i) variability of cortical folding patterns per se (folding variability) and (ii) variability in the location of cortical areas relative to these folds (area-vs-folding variability). Importantly, these two types of variability are strikingly non-uniform across the cortical sheet. Folding patterns are relatively consistent in some regions (e.g., the central sulcus) and much more variable in other, regions, including much of prefrontal and parieto-temporal cortex (Ono et al., 1990; Van Essen, 2005). Similarly, the relationship between the boundaries of cortical areas and gyral/sulcal landmarks is more consistent in regions such as the central sulcus (White et al., 1997; Geyer et al., 1999) and the olfactory sulcus (Ongur et al., 2003) than in parietal cortex and dorsolateral prefrontal gyrus (Amunts et al., 1999). Also, there are major species differences, as the relationship between cortical areas and folds is much more consistent in the macaque than in humans (Lewis and Van Essen 2000a). The remaining two types of variability relate more directly to cortical macro-circuitry and may be more fundamental from a developmental, functional, and mechanistic perspective. (iii) Areal size variability. Human cerebral cortex contains a complex mosaic of perhaps 100 – 200 distinct cortical areas (Van Essen, 2004). Each of these areas shows marked individual variability in its size (surface area) – up to three-fold variability for well-defined areas such as V1 (Andrews et al., 1997; Amunts et al., 2000; Van Essen et al., 1984). (iv) Connectional variability. Studies in nonhuman primates indicate that each cortical area is interconnected with many other areas (often 10 or more) by pathways that vary greatly in strength (Felleman and Van Essen, 1991; Lewis and Van Essen, 2000b). The degree of individual variability in each of thousands of specific cortico-cortical pathways is difficult to quantify but is likely to be considerable.
Variability in macro-circuitry (areal size variability and connection variability combined) is important in two respects. One is that differences in cortical macro-circuitry may account for many individual differences in cognitive, perceptual, emotional, and motor capabilities – i.e., in our unique personalities and behavioral capabilities. The other arises in connection with the hypothesis that during development cortical folding is driven by mechanical tension along long-distance cortico-cortical connections (Van Essen, 1997). By this hypothesis, the overall wiring diagram leads to a specific pattern of cortical folding in each individual, and individual differences in cortical macro-circuitry can largely account for both folding variability and area-folding variability.
Tension-based cortical folding can readily account for both the consistencies and the inconsistencies of folding patterns and their relationship to cortical areas. Consistency of folding and consistent function-folding relationships should tend to occur in regions dominated by a few large areas and prominent cortico-cortical pathways. For example, the relatively consistent folding of the central sulcus may arise because this region is dominated by large primary somatosensory and motor areas; variability in the exact location and shape of the central sulcus may reflect individual differences in size and/or connectivity of these areas. In contrast, highly variable folding and inconsistent area-vs-folding relationships should tend to occur in ‘balkanized’ regions containing a mosaic of many small areas and/or greater variability in connection patterns. Hence, this simple (and still unproven) hypothesis has great explanatory power.
Stereotaxic spaces – how different are they?
Devlin & Poldrack recommend the adoption of ‘MNI space’ rather than ‘T&T space’, because the latter has several well-known limitations. As they note, registration to MNI space can be done using several different templates (MNI305, MNI152, or the Colin individual brain) and a variety of registration algorithms, including transformations that are linear (e.g., FLIRT and MRITOTAL affine transformations), nonlinear but low-dimensional (e.g., SPM99, SPM2, SPM5), and high-dimensional nonlinear (e.g., Mohlberg et al., 2003). T&T space is defined by the drawings in the Talairach & Tournoux (1988) atlas. As with MNI space, registration to T & T space can occur via multiple templates and multiple registration algorithms. For example, AFNI registration (Cox, 1996) can be done using the original T & T piecewise-linear algorithm to a set of landmark points, whereas the AIR algorithm (Woods et al., 1999) uses nonlinear registration to a population-average volume resized to match the T & T atlas dimensions. (An affine registration algorithm - @auto_tlrc – is now available in AFNI as well.) Other stereotaxic spaces are in current use, such as 711-2B space (Ojemann et al., 1997; Buckner et al., 2004), which is similar but not identical in size to the T & T atlas and which includes multiple templates (711-2B, 711-2C, 711-2L, 711-2Y) that represent different age ranges or age combinations.
How different are the various registration algorithms in actuality? To illustrate the magnitude and spatial pattern of differences between various spaces and registration algorithms, we have used the PALS-B12 (Population-Average, Surface- and Landmark-based) human cortical atlas, which includes average fiducial surfaces for the left and right hemispheres in each of 6 widely used stereotaxic spaces (Van Essen, 2005). The distance between corresponding points for two atlas surfaces, one in MNI space (FLIRT algorithm) and the other in T&T space (AFNI algorithm) is displayed on lateral and medial views of the AFNI average fiducial surface in Fig. 1A, B. The difference magnitudes are painted on the surface; additionally, the direction of the differences is shown by vectors for a sparse subset of points. The difference between corresponding nodes in the two atlas surfaces is 5.5 mm on average and approaches 1 cm at the dorsal and ventral limits of the hemisphere. Figure 1C, D shows the differences between FLIRT (linear) and SPM2 (nonlinear) versions of MNI space. The difference map is generally smaller (average 3.1 mm) but still exceeds 5 mm in dorso-medial cortex. Importantly, the PALS-B12 atlas surfaces can also be used not only to visualize differences, but also to convert stereotaxic coordinates from one space to another (see below).
Figure 1.
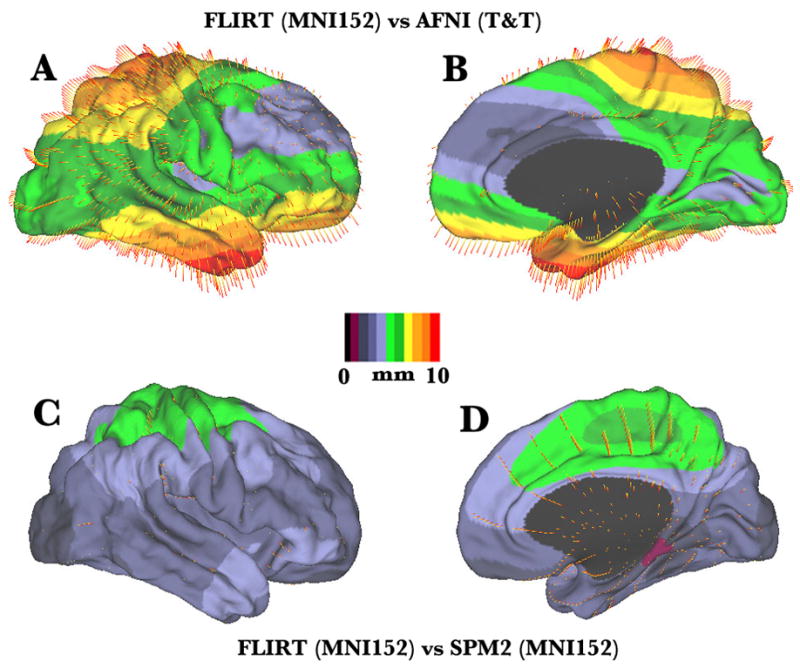
Quantitative maps of the differences between stereotaxic spaces and registration processes. A, B. Lateral and medial view of the distance between corresponding points on average fiducial surfaces in MNI space (FLIRT algorithm, MNI152 template) and T & T space (AFNI implementation of piecewise linear algorithm), displayed on the T & T average fiducial surface. Each average fiducial surface is based on the shapes of 12 normal individuals hemispheres (Van Essen, 2005). C, D. Lateral and medial views of an analogous difference map for the FLIRT and SPM2 average fiducial surfaces, both using the MNI152 template. A more comprehensive set of comparisons is available in the SumsDB database and can be viewed online using WebCaret (see http://sumsdb.wustl.edu/sums/directory.do?id=6604123&dir_name=COMPARE_STEREOTAXIC_SPACES
The differences among the various ways of registering to MNI space, while modest, are large enough that they should not be ignored. An important distinction is between linear (FLIRT, MRITOTAL) and nonlinear (SPM99, SPM2) algorithms. In principle, nonlinear registration should achieve lower overall variance than linear registration by virtue of having more degrees of freedom. Indeed, we have confirmed that the average 3D variability for the PALS-B12 atlas is slightly lower when calculated for the SPM2 fiducial surfaces compared to the FLIRT fiducial surfaces. On the other hand, nonlinear registration represents a two-edged sword when making comparisons across data sets that have been registered by different algorithms.
As Devlin & Poldrack note, the probabilistic architectonic volumes generated by the Zilles laboratory (e.g., Amunts et al., 1999) are a valuable resource for estimating which estimate which cortical areas are associated with fMRI activations and other experimental data obtained in various neuroimaging studies. Importantly, both linear and high-dimensional nonlinear (HDNL) versions of these probabilistic architectonic maps have been generated, in both cases using the Colin individual brain in MNI space as the template (Amunts et al., 2004; Eickhoff et al., 2005). Not surprisingly, the HDNL maps show tighter clustering of the probabilistic distribution, but they also differ from the linear mapsin terms of their the center of mass coordinates for each architectonic area. This raises the question of how to minimize bias when comparing population-average fMRI activation patterns to either version of the probabilistic architectonic maps. When making comparisons to the HDNL architectonic maps, systematic biases would in principle be minimized by registering individual subjects in fMRI studies using the same HDNL algorithm (Mohlberg et al., 2003) and the same Colin individual target. However, this is currently not feasible using existing fMRI analysis packages, and in any event it would introduce a different set of biases and complications associated with registration to an individual subject rather than to a population-average. An alternative is to compare a nonlinear transformation of fMRI data (e.g., using SPM2 and the MNI152 population-average target) to the HDNL-registered architectonic maps. However, this would be satisfactory only if the two nonlinear methods result in a similar spatial pattern of deformations. This is unlikely to be the case in general, given the differences in templates (individual Colin brain vs. population-average template) and in the dimensionality of the registration algorithms. In general, unintended biases may be introduced when comparing data sets registered by different algorithms to different templates, and it is difficult to estimate the magnitude and regional pattern of such biases without direct empirical evaluation. Consequently, we suggest that linear registration of both architectonic and fMRI data provide the best ‘apples-to-apples’ comparisons currently available even though this approach does not minimize variance within either the fMRI or the architectonic data.
Surface-based registration
Devlin and Poldrack comment briefly on the relative merits of surface-based vs. volume-based methods for registering data mapped to the cerebral cortex. Because surface-based registration of individual subjects to an atlas respects the topology of the cortical sheet, it should in principle be able to outperform volume-based registration in compensating for individual variability. Several recent studies provide empirical data in support of this hypothesis (Fischl et al., 1999; Desai et al., 2005; Van Essen, 2005; Argall et al. 2006), though additional critical comparisons between approaches are much to be desired. Hence, surface-based approaches will likely become an increasingly important strategy for reducing variability, representing the spatial complexity of activation patterns, and achieving more precise functional localization in neuroimaging studies of the future. Such gains will also be applicable to probabilistic architectonic maps discussed in the preceding paragraph once it becomes is feasible to generate surface reconstructions from scans of postmortem brains. As with volume-based registration discussed above, the choice of template (target) and registration algorithm can have a substantial effect on the degree to which surface-based registration compensates for normal variability. Hence, whatever registration method is used in any given study, Devlin & Poldrack appropriately urge that the precise target space, template, and registration algorithm should be specified when reporting neuroimaging results.
Accessing coordinate-based neuroimaging data
Given the richness and complexity of human neuroimaging data represented in thousands of published studies, it is increasingly important to make objective, quantitative comparisons of results obtained in different studies. For example, consider how useful it would be if any investigator could quickly and reliably determine which brain regions are reported to be activated or deactivated by any given experimental task (e.g., working memory) and could immediately link to the online publications that underly these findings. Equally useful would be queries that immediately reveal the spectrum of tasks that led to activation or deactivation of any given brain region (e.g., the olfactory sulcus), again with direct links to the relevant publications. Databases represent the natural substrate for providing this information. Functional activations and deactivations encoded by their stereotaxic coordinates represent a type of low-hanging fruit that is especially well suited for such analyses. A modest but growing fraction of data from the neuroimaging literature is currently accessible in databases that include stereotaxic coordinates as a substrate for spatial localization. The BrainMap database (http://www.brainmap.org/) provides access to almost 1000 studies (~34,000 coordinate locations, using T&T space as the standard). An alternative source is the SumsDB database (http://sumsdb.wustl.edu/sums/), which provides immediate online visualization of data (using WebCaret software) and offers additional capabilities for database searches and making comparisons with probabilistic architectonic maps and with complex fMRI activation patterns. Figure 2A,B show stereotaxic coordinates for over 8500 activation foci (from 312 published studies) originally reported in 8 stereotaxic spaces but projected via the appropriate average fiducial surfaces onto the PALS atlas surface (left and right flat maps and FLIRT average fiducial surfaces). Notably, the overall distribution of activation centers is far from uniform. This may reflect a combination of technical factors plus tendencies to emphasize some types of task over others in the set of studies selected.
Figure 2A,B.
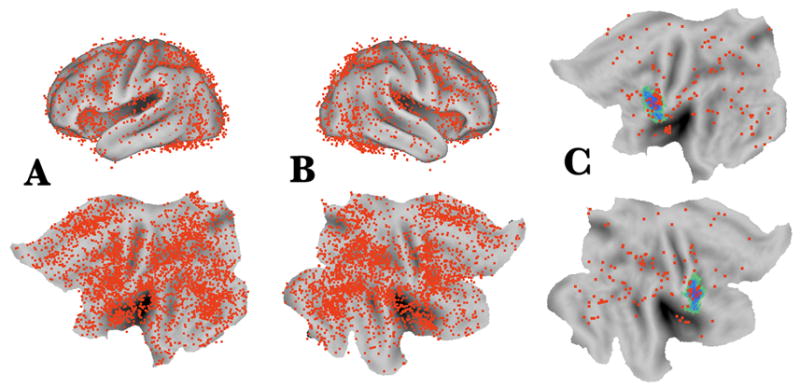
Data from 312 studies (8,559 foci) mapped to the PALS-B12 atlas. Using a one-step mapping option in Caret, each focus was projected to the appropriate PALS-B12 atlas surface. Since each focus preserves its original distance from the atlas surface, their new coordinates reflect an accurate transformation from many starting spaces into a single output space. Only foci within 10 mm from the atlas cerebral surface are displayed in this figure; this excludes a number of published activations centered in the cerebellum. C. Foci from a set of tasks related to imitation and action observation overlaid on a probabilistic map of area 44 (Amunts et al., 1999) registered by the linear method. Many of the data were obtained from the Functional Imaging Net Database (FIND; Hamilton and Van Horn, 2006) and BREDE (Nielsen, 2003) databases. Data are accessible at http://sumsdb.wustl.edu/sums/directory.do?id=6529195&dir_name=STEREOTAXIC_FOCI
These data are accessible online (see Fig. 2 legend) and can be: (i) searched using coordinates and/or text-based criteria, (ii) viewed online via WebCaret, and (iii) downloaded for additional analyses, including comparisons with many other types of atlas data. For example, Fig. 2C shows a subset of foci from nine studies involving a variety of tasks related to imitation and action observation overlaid on a probabilistic map of area 44 (green/blue patch). Although the coloring of foci Fig. 2 does not distinguish among the different task subtypes, this information is available in the actual dataset. In addition, direct links to the online publications provide immediate access to extensive additional information about each study.
Returning to the central theme of this commentary, neuroimagers should remain mindful of the daunting complexity of attaining a deep understanding of brain function. Simply describing hot spots of task-related activations is only a beginning rather than an endpoint in this process. Analyses that are accurately linked to the underlying anatomical circuitry in each individual will have improved prospects for contributing to a deeper understanding.
Acknowledgments
We thank Erin Reid and Susan Danker for technical support, Antonia Hamilton for providing the Functional Imaging Net database datasets. Supported by NIH Grant R01-MH-60974, funded by the National Institute of Mental Health, the National Institute for Biomedical Imaging and Bioengineering, and the National Science Foundation
Footnotes
Publisher's Disclaimer: This is a PDF file of an unedited manuscript that has been accepted for publication. As a service to our customers we are providing this early version of the manuscript. The manuscript will undergo copyediting, typesetting, and review of the resulting proof before it is published in its final citable form. Please note that during the production process errors may be discovered which could affect the content, and all legal disclaimers that apply to the journal pertain.
References
- Amunts K, Schleicher A, Burgel U, Mohlberg H, Uylings HB, Zilles K. Broca’s region revisited: Cytoarchitecture and intersubject variability. J Comp Neurol. 1999;412:319–341. doi: 10.1002/(sici)1096-9861(19990920)412:2<319::aid-cne10>3.0.co;2-7. [DOI] [PubMed] [Google Scholar]
- Amunts K, Malikovic A, Mohlberg H, Schormann T, Zilles K. Brodmann’s areas 17 and 18 brought into stereotaxic space -- Where and how variable? NeuroImage. 2000;11:66–84. doi: 10.1006/nimg.1999.0516. [DOI] [PubMed] [Google Scholar]
- Amunts K, Weiss PH, Mohlberg H, Pieperhoff P, Eickhoff S, Gurd JM, Marshall JC, Shah NJ, Fing GR, Zilles K. Analysis of neural mechanisms underlying verbal fluency in cytoarchitectonically defined stereotaxic space – The roles of Brodmann areas 44 and 45. NeuroImage. 2004;22:42–56. doi: 10.1016/j.neuroimage.2003.12.031. [DOI] [PubMed] [Google Scholar]
- Andrews TJ, Halpern SD, Purves D. Correlated size variations in human visual cortex, lateral geniculate nucleus, and optic tract. J Neurosci. 1997;17:2859–68. doi: 10.1523/JNEUROSCI.17-08-02859.1997. [DOI] [PMC free article] [PubMed] [Google Scholar]
- Argall BD, Saad ZS, Beauchamp MS. Simplified intersubject averaging on the cortical surface using SUMA. Hum Brain Mapp. 2006;27:14–27. doi: 10.1002/hbm.20158. [DOI] [PMC free article] [PubMed] [Google Scholar]
- Buckner RL, Head D, Parker J, Fotenos AF, Marcus D, Morris JC, Snyder AZ. A unified approach for morphometric and functional data analysis in young, old, and demented adults using automated atlas-based head size normalization: reliability and validation against manual measurement of total intracranial volume. Neuroimage. 2004;23:724–38. doi: 10.1016/j.neuroimage.2004.06.018. [DOI] [PubMed] [Google Scholar]
- Cox RW. AFNI: software for analysis and visualization of functional magnetic resonance neuroimages. Comput Biomed Res. 1996;29:162–73. doi: 10.1006/cbmr.1996.0014. [DOI] [PubMed] [Google Scholar]
- Desai R, Liebenthal E, Possing ET, Waldron E, Binder JR. Volumetric vs. surface-based alignment for localization of auditory cortex activation. Neuroimage. 2005;26:1019–29. doi: 10.1016/j.neuroimage.2005.03.024. [DOI] [PubMed] [Google Scholar]
- Eickhoff SB, Amunts K, Mohlberg H, Zilles K. The Human Parietal Operculum. II. Stereotaxic Maps and Correlation with Functional Imaging Results. Cereb Cortex. 2005;16:268–279. doi: 10.1093/cercor/bhi106. [DOI] [PubMed] [Google Scholar]
- Felleman DJ, Van Essen DC. Distributed hierarchical processing in primate cerebral cortex. Cerebral Cortex. 1991;1:1–47. doi: 10.1093/cercor/1.1.1-a. [DOI] [PubMed] [Google Scholar]
- Fischl B, Sereno MI, Tootell RB, Dale AM. High-resolution intersubject averaging and a coordinate system for the cortical surface. Hum Brain Mapp. 1999;8:272–84. doi: 10.1002/(SICI)1097-0193(1999)8:4<272::AID-HBM10>3.0.CO;2-4. [DOI] [PMC free article] [PubMed] [Google Scholar]
- Geyer S, Schleicher A, Zilles K. Areas 3a, 3b, and 1 of human primary somatosensory cortex. Neuroimage. 1999;10:63–83. doi: 10.1006/nimg.1999.0440. [DOI] [PubMed] [Google Scholar]
- Hamilton A, Van Horn J. FIND: A simple tool for searching fMRI papers. Organization for Human Brain Mapping. 2006 (Abstract #590) [Google Scholar]
- Lewis JW, Van Essen DC. Mapping of architectonic subdivisions in the macaque monkey, with emphasis on parieto-occipital cortex. J Comp Neurol. 2000a;428:79–111. doi: 10.1002/1096-9861(20001204)428:1<79::aid-cne7>3.0.co;2-q. [DOI] [PubMed] [Google Scholar]
- Lewis JW, Van Essen DC. Cortico-cortical connections of visual, sensorimotor, and multimodal processing areas in the parietal lobe of the Macaque monkey. J Comp Neurol. 2000b;428:112–137. doi: 10.1002/1096-9861(20001204)428:1<112::aid-cne8>3.0.co;2-9. [DOI] [PubMed] [Google Scholar]
- Mohlberg H, Lerch J, Amunts K, Evans AC, Zilles K. Probabilistic cytoarchitectonic maps transformed into MNI space. Presented at the 9th International Conference on Functional Mapping of the Human Brain; June 19–22; New York. 2003. Available on CD-Rom in Neuroimage 19(2) [Google Scholar]
- Nielsen FA. The Brede database: a small database for functional neuroimaging. NeuroImage; Presented at the 9th International Conference on Functional Mapping of the Human Brain; June 19–22, 2003; New York, NY. 2003 . [Google Scholar]
- Ojemann JG, Akbudak E, Snyder AZ, Mckinstry RC, Raichle ME, Conturo TE. Anatomic localization and quantitative analysis of gradient refocused echo-lanaar fMRI suceptibility artifacts. Neuroimage. 1997;6:156–167. doi: 10.1006/nimg.1997.0289. [DOI] [PubMed] [Google Scholar]
- Öngur D, Ferry AT, Price JL. Architectonic subdivision of the human orbital and medial prefrontal cortex. J Comp Neurol. 2003;460:425–49. doi: 10.1002/cne.10609. [DOI] [PubMed] [Google Scholar]
- Ono M, Kubick S, Abernathey CD. Atlas of the Cerebral Sulci. Thieme Medical; New York: 1990. [Google Scholar]
- Talairach J, Tournoux P. Coplanar Stereotaxic Atlas of the Human Brain. Thieme Medical; New York: 1988. [Google Scholar]
- Van Essen DC. A tension-based theory of morphogenesis and compact wiring in the central nervous system. Nature. 1997;385:313–318. doi: 10.1038/385313a0. [DOI] [PubMed] [Google Scholar]
- Van Essen DC. Organization of visual areas in Macaque and human cerebral cortex. In: Chalupa L, Werner JS, editors. The Visual Neurosciences. MIT Press; 2004. pp. 507–521. [Google Scholar]
- Van Essen DC. A population-average, landmark- and surface-based (PALS) atlas of human cerebral cortex. NeuroImage. 2005;28:635–662. doi: 10.1016/j.neuroimage.2005.06.058. [DOI] [PubMed] [Google Scholar]
- Van Essen DC, Newsome WT, Maunsell JHR. The visual field representation in striate cortex of the macaque monkey: asymmetries, anisotropies and individual variability. Vision Res. 1984;24:429–448. doi: 10.1016/0042-6989(84)90041-5. [DOI] [PubMed] [Google Scholar]
- Van Essen DC, Dierker D, Snyder A, Raichle ME, Reiss A, Korenberg J. Symmetry of cortical folding abnormalities in Williams syndrome revealed by surface-based analyses. J Neuroscience. 2006;26:5470–5483. doi: 10.1523/JNEUROSCI.4154-05.2006. [DOI] [PMC free article] [PubMed] [Google Scholar]
- Van Essen DC, Harwell J, Hanlon D, Dickson J. Surface-Based Atlases and a Database of Cortical Structure and Function. In: Koslow SH, Subramaniam S, editors. Databasing the Brain: From Data to Knowledge (Neuroinformatics) John Wiley & Sons; NJ: 2005. pp. 369–388. [Google Scholar]
- White LE, Andrews TJ, Hulette AR, Groelle M, Paydarfar J, Purves D. Structure of the human sensorimotor system. I. Morphology and cytoarchitecture of the central sulcus. Cerebral Cortex. 1997;7:18–30. doi: 10.1093/cercor/7.1.18. [DOI] [PubMed] [Google Scholar]
- Woods RP, Grafton ST, Watson JDG, Sicotte NL, Mazziottta JC. Automated image registration: II. Intersubject validation of linear and nonlinear models. J Comp Asst Tomog. 1998;22:153–165. doi: 10.1097/00004728-199801000-00028. [DOI] [PubMed] [Google Scholar]