

Abstract
Large-scale genetic association studies are now widely conducted using SNPs selected from the International HapMap Project or provided on commercial “whole genome” chips. As only a subset of human genetic variation has been identified, it is unknown what proportion of the total genetic variation can be captured in this way, although recent genome-wide estimates of SNP capture rates have been encouraging. We estimated the expected gene-centric information capture for whole-genome chips using sequence data from 306 inflammatory/cardiovascular genes and found SNP capture rates notably lower than previous genome-wide estimates. Further investigation indicates that a major explanation for these lower capture rates is the aggregation of particular sequence features that influence both linkage disequilibrium and the amenability of SNPs for genotyping within the broad class of inflammatory/ cardiovascular genes. This suggests that the power of genetic association studies in some complex traits will depend not only upon established factors, such as allele frequency and penetrance, but may also be influenced by the distribution of sequence features in the class of genes expected to underlie the disease of interest.
The HapMap project (International HapMap Consortium 2005; http://www.hapmap.org) has truly revolutionized the selection of SNPs for testing in candidate gene studies; the website and associated tools such as Haploview (Barrett et al. 2005) and tagger (de Bakker et al. 2005) allow researchers to select efficient sets of tag SNPs, which capture the majority of variation within HapMap while reducing redundancy. The resource has been used to derive sets of genome-wide tag SNPs, selected to capture common SNPs (with minor allele frequencies >5%) in the HapMap CEU (Utah residents with ancestry from Northern and Western Europe) samples, which are available in the Illumina HumanHap300 and HumanHap550 SNP chips (containing 317,000 and 555,000 SNPs, respectively). Affymetrix has also produced two genome-wide SNP chips (100,000 and 500,000 GeneChips) covering 111,000 and 500,000 SNPs, but these are chosen “at random” (without reference to linkage disequilibrium [LD] and on the basis of genotyping quality using Affymetrix technology). More recently, Affymetrix has released the SNP Array 6.0 containing >906,000 SNPs. Although SNPs are the primary target of such resources, recent work has shown that insertion–deletion variants (indels) are often in strong LD with neighboring SNPs, implying that they may also be tagged (Hinds et al. 2006; McCarroll et al. 2006), adding further value to SNP studies.
Previous studies have concluded that the entire set of HapMap SNPs can capture, with r2 > 0.8, 94% of common SNP variation genome wide in European populations and 81% in African populations (International HapMap Consortium 2005). The HapMap SNP data have also been used, with appropriate correction for their incomplete coverage, to estimate expected information capture for whole-genome chips (Barrett and Cardon 2006), while another study used sequence data from the ENCODE project that covers 10 500-kb regions (Pe’er et al. 2006b). Both produced similar estimates, and found that commercial whole-genome SNP chips should capture the majority of common SNP variation with r2 ≥ 0.8 in European and Asian populations (e.g., at least 64% for the Affymetrix GeneChip 500k), but a smaller proportion in African populations (41%).
It is anticipated that many of the disease-associated variants that will be found in genome-wide studies are likely to be located in or near genes, meaning that it is important to consider coverage in gene-centric regions specifically. We set out to estimate the proportion of common gene-centric SNPs that can be captured using HapMap-derived tag SNP sets and commercial whole-genome SNP chips using public sources of sequence data (SeattleSNPs [http://pga.gs.washington.edu] and PARC [http://droog.mbt.washington.edu/parc]), which cover 306 genes (6.4 Mb) in total.
Results
The 306 SeattleSNPs/PARC genes included in this study contained a total of 31,965 SNPs; their breakdown into rare and common variants and according population is shown in Table 1. Sequenced length per gene ranged from 3.3 kb to 103 kb (median, 17.5 kb).
Table 1.
Polymorphisms identified in the SeattleSNPs and PARC resources

Common variants had minor allele frequency of greater than 5% in at least one resource.
We identified a total of 9713 SNPs in HapMap version 21a located within the sequenced regions. Of these, 8904 (92%) were polymorphic in SeattleSNPs/PARC. Among the common HapMap SNPs (MAF > 5%), 4725 of 5011 (94%) and 5425 of 5790 (93%) were polymorphic in SeattleSNPs/PARC in European and African descent populations, respectively. These figures should be weighed against the expected number of common HapMap SNPs that would appear monomorphic in 46 sequenced chromosomes, given the HapMap allele frequency distribution. We calculated this proportion to be about 1%, suggesting that perhaps 5% of HapMap SNPs may have been missed in the resequencing efforts. However, HapMap has recently released an updated data set (version 22), and a number of SNPs that were in version 21a have been excluded. Interestingly, 69 (15%) of the common HapMap SNPs we failed to identify in SeattleSNPs/PARC were among the list of excluded SNPs compared with only 22 (0.3%) of SNPs we did, suggesting that some of the SNPs we failed to align may have been incorrectly positioned in HapMap version 21a. Further comparison of genotyped SNPs common to both resources for the subset of 78 genes sequenced in a subset of HapMap individuals demonstrated a high genotype call concordance rate (98.3% in a total of 74,892 genotype calls over 3401 SNPs). Thus, our alignment of the SeattleSNPs/PARC resources to HapMap and the quality of the SeattleSNPs/PARC data was validated.
Information measures
We tested six tag SNP sets—all HapMap SNPs, a set of tag SNPs derived from HapMap, the commercial Affymetrix GeneChip 100k, Affymetrix GeneChip 500k, Illumina HumanHap300, and Illumina HumanHap550 SNP chips. Coverage was evaluated according to “capture rate”—the proportion of common SNPs in the sequence data (minor allele frequency >5%) either within the tag SNP set or in strong LD (r2 ≥ 0.8) with a tag SNP. We prefer this simple pairwise measure to capture by multiple markers because of the lack of assumptions required about methods of downstream analysis, although we recognize that capture rates could be increased by the use of multimarker tagging (de Bakker et al. 2005).
Capture rates are a useful summary measure, but are based on a dichotomization of a continuous statistic—the maximum r2 between any sequenced polymorphism and a set of tag SNPs. Associations with disease-related polymorphisms will still be detectable at more moderate r2 (0.5–0.8) given sufficiently large sample sizes, but the opposite tail of the distribution contains polymorphisms with which association will not be detectable, no matter how large a sample is available. To examine these we introduce the “noncapture rate”—the proportion of sequenced SNPs that have a maximum r2 < 0.2 with any tag SNP or haplotype of tag SNPs. Jorgenson and Witte (2006) have also proposed the mean maximum r2 as a more stable measure of information capture. In this study, we present all three measures in parallel, as they describe different aspects of the maximum r2 distribution, and refer to them jointly as information measures.
We calculated information measures for each of our six tag SNP sets, and these are presented in Table 2. SeattleSNPs and PARC included African, African American, and European American samples (see Methods for details). For brevity, we describe the European American samples as “European descent” and both the African American and African samples as “African descent.” The tag SNP set composed of all HapMap SNPs captured the majority of the gene-centric sequence SNPs (in European descent samples, capture rates CRE = 77%, mean maximum r2, mE = 85%; in African descent samples, CRA = 58%, mA = 72%). Relatively low noncapture rates indicated that only a small minority of polymorphisms will not be able to be captured by any HapMap-derived set of SNPs (noncapture rates in European descent samples, nCRE = 6%, in African descent samples, nCRA = 13%).
Table 2.
Summary of information measures for six tagsets in SeattleSNPs/PARC samples

(m) Mean maximum r2; (CR) capture rate; (nCR) noncapture rate. N-SNPs is the number of polymorphisms found in the sequencing data on which the estimate is based (after exclusion of SNPs in flanking LD blocks—see Methods for details). N-tags is the number of SNPs in the tag set. (HM-all) All HapMap SNPs; (HM-tags) tag SNPs derived from HapMap; (A100) Affymetrix GeneChip 100k; (A500) Affymetrix Gene Chip 500k; (HH300) Illumina HumanHap300; (HH550) Illumina HumanHap550.
Using a subset of HapMap-derived tag SNPs proved to be an efficient strategy, resulting in moderate reductions in information capture (CRE = 66%, mE = 78%; CRA = 43%, mA = 61%) and increases in noncapture (nCRE = 8%; nCRA = 18%) for SNPs in return for substantial reductions of over 55% in genotyping requirements.
The commercially available whole-genome chips contained substantially fewer SNPs in the sequenced regions than the number of HapMap-derived tags and, as a result, did not perform as well in comparison. The Illumina HumanHap550 was the strongest performer (CRE = 53%, mE = 67%; CRA = 23%, mA = 39%), followed by the Affymetrix GeneChip 500k (CRE = 41%, mE = 55%; CRA = 21%, mA = 35%) and the Illumina HumanHap300 (CRE = 41%, mE = 56%; CRA = 15%, mA = 28%). These relatively low capture rates are offset, in Europeans at least, by noncapture rates of ≤27% (and 17% for Illumina HumanHap550), suggesting that the majority of genetic variants should be detectable with sufficiently large sample sizes. In African-descent samples, however, noncapture rates are considerable (at least 40%).
Comparison with genome-wide estimates and correction for bias due to short sequenced regions
These capture rates are all notably below previously reported estimates. For example, our results indicate that, for the Affymetrix GeneChip 500k, CRE = 41%, while previous genome-wide estimates were at least 64% (Barrett and Cardon 2006; Pe’er et al. 2006b). An important consideration is that we may have underestimated capture rates. First, due to any SNPs missed in resequencing efforts, and second, as a direct result of our study design based on the SeattleSNPs/PARC resources. These consist of relatively short sequenced regions, which means long-range LD between tag SNPs and target SNPs is missed (Pe’er et al. 2006a). We have mitigated against this by estimating the block structure for each sequenced region and estimating capture rates only for those SNPs not in the flanking LD blocks (see Methods). However, capture rates do tend to be higher in longer genes (data not shown), suggesting underestimation may be a problem.
We attempted to correct for this bias in two ways. First, we estimated the extent of the bias by resampling from the ENCODE data set. This showed that information measures calculated using short sequenced regions were underestimated by a factor that varied according to tagset, but not population (Table 3). If we assume no systematic differences between the regions within which the SeattleSNP/PARC genes lie and the regions sequenced by ENCODE, we can multiply the information measures from the SeattleSNPs/PARC data by the inverse of these underestimation factors. These corrected information measures remain below previous published estimates (Table 4).
Table 3.
Underestimation of information capture in ENCODE data due to short sequence lengths

(m) Mean maximum r2; (CR) capture rate; (nCR) noncapture rate; (A100) Affymetrix GeneChip 100k; (A500) Affymetrix Gene Chip 500k; (HH300) Illumina HumanHap300; (HH550) Illumina HumanHap550.
Table 4.
Information measures in SeattleSNPs/PARC data after correction for bias due to short sequence lengths derived from ENCODE data

(m) Mean maximum r2; (CR) capture rate; (nCR) noncapture rate; (A100) Affymetrix GeneChip 100k; (A500) Affymetrix Gene Chip 500k; (HH300) Illumina HumanHap300; (HH550) Illumina HumanHap550.
We also attempted to overcome the bias by incorporating HapMap data to extend the length of SeattleSNPs/PARC-sequenced regions in an extended window analysis. A total of 78 of the 306 SeattleSNPs/PARC genes were sequenced in a subset of HapMap individuals. For this subset, we combined sequenced genotypes with HapMap genotypes in successively larger windows, allowing all HapMap SNPs to be potential tags, and thus incorporating long-range LD. Figure 1 shows that information capture increases as window size increases. The effect on HapMap derived tagsets is modest (e.g., CRE = 76% for all HapMap SNPs with no window compared with CRE = 79% with a 200-kb window). However, the underestimation is greater for genome-wide chips, as might be expected given their lower density of SNPs compared with HapMap, and therefore, their greater reliance on long-range LD.
Figure 1.

Information measures for 78 genes using combined SeattleSNPs/PARC and HapMap data for extension windows of 0–200 kb around the sequenced region. Mean maximum r2, capture rates, and noncapture rates are shown by squares, circles, and triangles, respectively; European and African descent samples are distinguished by solid and open symbols, respectively.
These two methods both lead to increased estimates of information capture, but still substantially below published estimates. For example, for the Affymetrix GeneChip 500k, the corrected CRE = 56%, and the windowed CRE = 45% compared with 64% (Barrett and Cardon 2006; Pe’er et al. 2006b). This suggests that bias due to using short sequenced regions accounts for part, but not all of the difference between our estimates and previously published estimates. We therefore began to search for alternative explanations for the remaining difference.
Explaining the residual difference in information capture estimates
An obvious difference between this and earlier studies is the gene-centric nature of the SeattleSNPs/PARC sequence data. We examined whether information measures varied with proximity to known genes within the ENCODE data, but found no evidence to support a hypothesis that gene-centric SNPs are more difficult to capture (Supplemental Fig. 1). For example, capture rates in European descent samples for the Affymetrix GeneChip 500k were 68% for gene-centric SNPs and 61% for intergene SNPs.
Also, ENCODE has sequenced more samples (60 compared with 23 or 24 for SeattleSNPs/PARC). We resampled 23 (CEU) or 24 (YRI) samples from the ENCODE data set and recalculated information measures. After 1000 replications, the mean information measures across the resampled data set suggested little systematic difference compared with those from the entire data set.
Finally, we considered whether differences in the allele frequency spectra between SeattleSNPs/PARC and HapMap could explain the differences in estimated capture rates, as HapMap is biased toward common SNPs. However, we estimated capture rates only for SNPs with MAF > 5%, and, although the allele frequency spectra show the expected excess of rare SNPs in the SeattleSNPs/PARC data, the frequency spectra for common SNPs are not dissimilar between HapMap and SeattleSNPs/PARC (Supplemental Fig. 3). In addition, reanalysis of only SNPs with MAF > 10% still showed considerably lower capture rates in SeattleSNPs for the Affymetrix chips than a similar analysis using ENCODE (data not shown).
We also compared the distribution of interspersed repeats in SeattleSNPs/PARC and ENCODE (Fig. 2). These are sequence features within which SNP genotyping can be difficult and fall into four classes: long interspersed elements (LINEs), short interspersed elements (SINEs), long terminal repeat (LTR) retrotransposons, and DNA transposons. Their distribution is similar to genome-wide averages in the ENCODE regions and similar in the SeattleSNPs/PARC regions to “gene-centric” ENCODE regions (within 10 kb of a known gene), except for a lower frequency of LINEs in SeattleSNPs/PARC (9.3% vs. 15%) and a slightly higher frequency of SINEs (15.2% vs. 13.9%).
Figure 2.

Frequency distribution of local genomic characteristics in evaluation resources (%). The top and bottom panels show the proportion of sequenced region and the proportion of SNPs that fall into each category of sequence features. (gc) Gene-centric (within 10 kb of any known gene); (SS/P) SeattleSNPs/PARC; (ENC-seq) ENCODE SNPs submitted to dbSNP; (ENC-HM) SNPs genotyped by the ENCODE-HapMap project (http://www.hapmap.org/downloads/encode1.html.en). (LINE) Long interspersed element; (SIN) short interspersed element; (LTR) long terminal repeat retrotransposons; (DNA element) DNA transposons. Genome-wide averages are those published by Lander et al. (2001).
An interesting pattern emerges when we compare the above distributions with the proportion of SNPs identified in each sequence feature (Fig. 2). Within SeattleSNPs/PARC, the proportion of SNPs in each feature is similar to the proportion of sequenced region in each feature, with perhaps a small increase in the number of SNPs found in SINEs compared with their sequenced length (18% vs. 15%). This is in keeping with a recent report that SNPs are found more frequently in SINEs than neighboring sequences (Ng and Xue 2006). Since only ∼80% of ENCODE SNPs identified by sequencing efforts are genotyped in HapMap (http://www.hapmap.org/downloads/encode1.html.en), we considered separately all ENCODE SNPs submitted to dbSNP (ENCODE-seq) and those ENCODE SNPs genotyped by HapMap (ENCODE-HapMap). The proportion of SNPs and sequenced regions within each feature are also similar comparing ENCODE-seq SNPs with ENCODE regions. However, for ENCODE-HapMap, SNPs in SINEs appear under-represented (6%) compared with the proportion of ENCODE-sequenced regions in SINEs (12%). While there may be an increase in false positive SNPs in SeattleSNPs/PARC, as it is notoriously difficult to sequence through repeat regions, this low frequency of SNPs in SINEs only in ENCODE-HapMap suggests an undersampling of SNPs in SINEs by ENCODE-HapMap. This is most likely due to difficulties creating unique genotyping primers for such SNPs.
This difference in the composition of the resources is important because information capture for SNPs in repeat features tends to be lower compared with an “average” SNP (e.g., Supplemental Fig. 4 shows capture rates for SNPs in each sequence feature, but a similar pattern is also seen for maximum mean r2), but this is most marked for SNPs in SINEs. A data set that under-represents these difficult to capture SNPs, then, could lead to inflated estimates of information capture.
Discussion
Our gene-centric analysis reveals lower information capture for HapMap and whole-genome SNP chips than previously published genome-wide estimates. We believe this difference results from a combination of different study designs and the contrasting resources that have been used to estimate capture rates. Our results tend to underestimate capture due to long-range LD with distant chip SNPs outside the sequenced regions. However, extended-window analysis of 78 genes and resampling of ENCODE demonstrates that this underestimation explains only part of the lower information capture observed here. The other major explanation appears to be the higher proportion of SNPs in SINEs found in and around the SeattleSNPs/PARC genes, combined with lower capture rates in these features.
There are at least two mechanisms by which capture rates may be lower in sequence features. First, because it is more difficult to create unique primers, SNPs are less likely to be captured directly by virtue of their inclusion in the tag set and, indeed, SNPs in all sequence features are less likely to be included on any chip, but the effect is most dramatic for SNPs in SINEs (Supplemental Fig. 5). Second, sequence features may also affect the chance of a SNP being captured through high LD with one of its neighbors. The extent of LD in a region depends, among other things, on the local recombination rate, and this is correlated with proximity to particular sequence features. LINEs and SINEs, in particular, have been associated with decreases and increases in local recombination rates, respectively (Yu et al. 2001). A direct relationship between sequence features and LD has also been observed, with LINEs and SINEs being associated with increased and decreased LD, respectively (Smith et al. 2005).
We note that the relatively lower frequency of SNPs in SINEs in the ENCODE-HapMap data, given that such SNPs are harder to capture, could have led to overoptimistic genome-wide estimates of capture rates in a previous ENCODE-based empirical evaluation (Pe’er et al. 2006b), but this is likely to have had a relatively small effect on the estimated genome-wide capture rates.
These findings raise interesting questions about why the SeattleSNPs/PARC genes studied here display such different frequencies of interspersed repeats to that observed from genome-wide averages. The frequency of these elements has been shown to be correlated with LD, and LD, in turn, has been shown to be correlated with a broad functional class of gene, with inflammatory genes displaying the lowest average LD of 35 classes considered (Smith et al. 2005). It has been noted that genes such as inflammatory and immune-response genes that displayed low LD were amongst those for which great allelic diversity is likely to be advantageous to the species (Smith et al. 2005). The majority of genes sequenced by SeattleSNPs/PARC are in inflammation pathways and the pattern of SINE/LINE frequency in these genes shown in Figure 2 represents a plausible explanation for the lower LD. It is tempting to speculate that the atypical frequency of these elements in inflammatory genes, then, is the mechanism by which this advantageous lower LD is maintained.
Thus, this snapshot of sequence data from SeattleSNPs/PARC is not representative of the average genome-wide distribution of interspersed repeats, apparently due to the nature of sequences within inflammatory genes. Had we considered another class of genes with a different set of sequence features (e.g., those involved in DNA metabolism that display higher than average LD; Smith et al. 2005), it is feasible that our results may have been very different. This illustrates that our ability to map disease-causing variants should be defined not only by their allelic distribution and penetrance, but also by their “capture potential,” reflecting the collection of sequence features typical of the classes of genes likely to be involved in the disease of interest. The volume of available large-scale sequencing data continues to increase (for example, from projects such as the Environmental Genome Project; http://www.niehs.nih.gov/envgenom) and whether capture rates vary by gene class will be testable in the near future.
An important point is that this analysis assumes all SNPs on a given chip genotype successfully, which is in contrast to the experience in real datasets, where a proportion of SNPs fail. Thus, the results here (and in other studies) represent an upper bound for information capture in an ideal world.
In summary, our results suggest that, for any particular disease that may result from variation in a particular functional class of genes, SNP chip performance may differ from genome-wide estimates of average performance. Although information capture is generally expected to improve with the new one million SNP chips recently released and in the pipeline, it is likely that additional technological approaches will be required to genotype variants in repeat sequence features, and hence, capture all common variation. These findings may remain particularly important for disease-gene detection in studies of disorders with an inflammatory etiology.
Methods
Data sets
We retrieved data from the SeattleSNPs and PARC databases for all 306 genes labeled “complete,” and which had been sequenced in human samples by March 20, 2006. Initially, sequencing in both of these projects was conducted in samples from American individuals of European (n = 23) and African (n = 24) descent, distinct from those used by HapMap. In October 2004, these were replaced by a subset of the HapMap CEU samples (n = 23) and YRI (Yoruba in Ibadan, Nigeria) samples (n = 24), so that 228 genes were sequenced in independent samples, and the remaining 78 in a subset of HapMap samples. All 306 genes were included in this study. A summary of the number of polymorphisms studied is given in Table 1. We extracted all SNPs from HapMap release 20 within the sequenced regions and aligned the two resources.
Alignment of SeattleSNPs/PARC with build 35 of the human genome
All SeattleSNPs/PARC SNPs were aligned to build 125 of dbSNP (Sherry et al. 2001) by taking 50 bp upstream and downstream of each SNP and using MegaBLAST (Zhang et al. 2000). A SNP was considered mapped to a dbSNP entry when the hit was aligned at the position of the SNP in both sequences and the percent identity was ≥98% over a region of ≥80 bp. To validate mappings, SeattleSNPs/PARC positional order was compared with the positional order of mapped dbSNP entries and mismappings were excluded. We manually checked the mapping of SNPs in five genes chosen at random by comparison with dbSNP to confirm that our alignment algorithms worked as intended.
We placed SNPs from SeattleSNPs and PARC, which were not yet in dbSNP, onto build 35 of the human genome by using MegaBLAST with the same settings as those used by the NCBI for mapping dbSNP entries onto the genome. The flanking sequence was initially cleaned with RepeatMasker (http://www.repeatmasker.org) and then the MegaBLAST was performed with a word size of 28. The position of the SNP in the SeattleSNPs and PARC sequences had to be returned in the alignment for a mapping to be considered valid.
Proportion of HapMap SNPs that would appear monomorphic in SeattleSNPs/PARC
The probability that a HapMap SNP i with minor allele frequency qi would appear monomorphic in a sample of n samples is 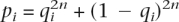 . From this we can estimate the expected proportion of N HapMap SNPs that would appear monomorphic in n independent samples as
  .
.
Exclusion of genes
Two of the sequenced genes map to both chromosome X and Y, and 10 genes contained no SNPs in HapMap. All 12 are listed in Supplemental Table 1 and were excluded from further study. It is not clear why these gaps exist in HapMap, but notes on the website suggest that they arose through difficulties resolving differences between builds 34 and 35 of the human genome and may be resolved in a future ”gold standard” release.
We retrieved the ENCODE data from HapMap release 20 and found the position of all known genes within these regions by manually extracting their coordinates from the HapMap view of each region. There was no overlap between the ENCODE regions and the SeattleSNPs/PARC regions.
The coordinates of sequence features on builds 34 and 35 of the human genome were retrieved from the rmsk table in the Table Browser at the UCSC Human Genome Browser Gateway (http://genome.ucsc.edu/cgi-bin/hgGateway). Genome-wide average rates of sequence features used in Figure 2 were taken from Table 11 in Lander et al. (2001).
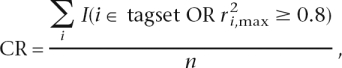
Estimation of capture measures
Measures of capture potential were based on 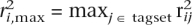 , the maximum pairwise r2 between a SNP we want to capture, i, given all SNPs, j, in a specific tagset. Three capture measures were defined as follows: the capture rate
 |
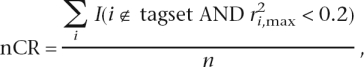
the noncapture rate
 |
and the mean maximum r2
 |
where I( ) is an indicator function and n the total number of SNPs evaluated.
We expected SNPs toward the ends of sequenced regions, not directly typed in the tag set under consideration, might be in high LD, not with any tag SNP within the sequenced region, but with one lying outside that region, causing capture rates to be underestimated. For each sequenced region, we estimated the LD-block structure and considered polymorphisms in the flanking blocks separately. (We allow that a “block” may consist of a single SNP). Capture rates in these flanking blocks were ∼5% lower compared with polymorphisms in inner LD blocks, and we estimated capture rates only for those SNPs in inner LD blocks to avoid drawing potentially unfair conclusions. For the equations above, that means we allow j to roam over all SNPs in a tagset (regardless of whether they are also in a flanking block), but restrict i to common SNPs not in flanking LD blocks.
LD blocks were inferred using all three methods programmed in Haploview. Estimated capture rates were very similar across all three, and we chose to use the method “SPINE” in the final results, as it was the most conservative (selecting the largest LD blocks and resulting in marginally higher estimated capture rates). We used tagger (de Bakker et al. 2005) to assess capture rates and chose tag SNPs from all HapMap SNPs using the pairwise algorithm in the software Haploview (Barrett et al. 2005) to tag all known HapMap SNPs in a given region with minor allele frequencies ≥5% with r2 ≥ 0.8. Tagger and Haploview use the same algorithms, but while Haploview is more convenient because it can be run on local computer, tagger, run on a remote server, provides greater functionality for evaluation of tag SNP sets.
Resampling from ENCODE to estimate degree of bias due to missed long-range LD
The ENCODE project (ENCODE Project Consortium 2004) has sequenced 10 500-kb regions in a subset of the HapMap individuals and these data are one of the resources used in previous evaluations. We chose random starting points and repeatedly (200 times) superimposed the pattern of sequenced regions for each gene onto the ENCODE data set and calculated information measures for the set of SNPs within these “pseudo-sequenced genes” in the same way as for the SeattleSNPs/PARC data and using the complete ENCODE data set as potential tags. For each tagset, population, and information measure, we used the mean ratio of the measure using the smaller tagset to the measure using all SNPs as tags to calculate underestimation factors.
Extended windows analysis
For the 78 genes sequenced in a subset of HapMap individuals, we combined SeattleSNPs/PARC and HapMap genotype data for successively larger windows surrounding the sequenced regions. Windows of size 0 include only SeattleSNPs/PARC SNPs, but all other windows also include all HapMap SNPs within the window size (including those within the central sequenced region). When both resources contained genotype data for the same individual and the same SNP, data was combined as follows: (1) if both genotypes concordant, keep; (2) if one genotype missing, keep the non-missing genotype; (3) if genotypes discordant, set to missing. Capture rates were defined as above, but using LD estimates from the combined data.
Acknowledgments
We thank Illumina for sharing the list of SNPs on their HumanHap550 chip, and John Todd, David Clayton, and anonymous reviewers for helpful comments. C.W. is a British Heart Foundation Intermediate Fellow (Grant no. FS/05/061/19501). R.D., M.C., and P.M. are supported by program grants from the Medical Research Council (G9521010D) and the British Heart Foundation (PG02/128). M.C. is a principal investigator on the Wellcome Trust Case Control Consortium (076113/B/04/Z).
Footnotes
[Supplemental material is available online at www.genome.org.]
Article published online before print. Article and publication date are at http://www.genome.org/cgi/doi/10.1101/gr.5996407
References
- Barrett J.C., Cardon L.R., Cardon L.R. Evaluating coverage of genome-wide association studies. Nat. Genet. 2006;38:659–662. doi: 10.1038/ng1801. [DOI] [PubMed] [Google Scholar]
- Barrett J.C., Fry B., Maller J., Daly M.J., Fry B., Maller J., Daly M.J., Maller J., Daly M.J., Daly M.J. Haploview: Analysis and visualization of LD and haplotype maps. Bioinformatics. 2005;21:263–265. doi: 10.1093/bioinformatics/bth457. [DOI] [PubMed] [Google Scholar]
- de Bakker P.I.W., Yelensky R., Pe’er I., Gabriel S.B., Daly M.J., Altshuler D., Yelensky R., Pe’er I., Gabriel S.B., Daly M.J., Altshuler D., Pe’er I., Gabriel S.B., Daly M.J., Altshuler D., Gabriel S.B., Daly M.J., Altshuler D., Daly M.J., Altshuler D., Altshuler D. Efficiency and power in genetic association studies. Nat. Genet. 2005;37:1217–1223. doi: 10.1038/ng1669. [DOI] [PubMed] [Google Scholar]
- ENCODE Project Consortium The ENCODE (ENCyclopedia Of DNA Elements) project. Science. 2004;306:636–640. doi: 10.1126/science.1105136. [DOI] [PubMed] [Google Scholar]
- Hinds D.A., Kloek A.P., Jen M., Chen X., Frazer K.A., Kloek A.P., Jen M., Chen X., Frazer K.A., Jen M., Chen X., Frazer K.A., Chen X., Frazer K.A., Frazer K.A. Common deletions and SNPs are in linkage disequilibrium in the human genome. Nat. Genet. 2006;38:82–85. doi: 10.1038/ng1695. [DOI] [PubMed] [Google Scholar]
- International HapMap Consortium A haplotype map of the human genome. Nature. 2005;437:1299–1320. doi: 10.1038/nature04226. [DOI] [PMC free article] [PubMed] [Google Scholar]
- Jorgenson E., Witte J.S., Witte J.S. Coverage and power in genomewide association studies. Am. J. Hum. Genet. 2006;78:884–888. doi: 10.1086/503751. [DOI] [PMC free article] [PubMed] [Google Scholar]
- Lander E.S., Linton L.M., Birren B., Nusbaum C., Zody M.C., Baldwin J., Devon K., Dewar K., Doyle M., FitzHugh W., Linton L.M., Birren B., Nusbaum C., Zody M.C., Baldwin J., Devon K., Dewar K., Doyle M., FitzHugh W., Birren B., Nusbaum C., Zody M.C., Baldwin J., Devon K., Dewar K., Doyle M., FitzHugh W., Nusbaum C., Zody M.C., Baldwin J., Devon K., Dewar K., Doyle M., FitzHugh W., Zody M.C., Baldwin J., Devon K., Dewar K., Doyle M., FitzHugh W., Baldwin J., Devon K., Dewar K., Doyle M., FitzHugh W., Devon K., Dewar K., Doyle M., FitzHugh W., Dewar K., Doyle M., FitzHugh W., Doyle M., FitzHugh W., FitzHugh W., et al. Initial sequencing and analysis of the human genome. Nature. 2001;409:860–921. doi: 10.1038/35057062. [DOI] [PubMed] [Google Scholar]
- McCarroll S.A., Hadnott T.N., Perry G.H., Sabeti P.C., Zody M.C., Barrett J.C., Dallaire S., Gabriel S.B., Lee C., Daly M.J., Hadnott T.N., Perry G.H., Sabeti P.C., Zody M.C., Barrett J.C., Dallaire S., Gabriel S.B., Lee C., Daly M.J., Perry G.H., Sabeti P.C., Zody M.C., Barrett J.C., Dallaire S., Gabriel S.B., Lee C., Daly M.J., Sabeti P.C., Zody M.C., Barrett J.C., Dallaire S., Gabriel S.B., Lee C., Daly M.J., Zody M.C., Barrett J.C., Dallaire S., Gabriel S.B., Lee C., Daly M.J., Barrett J.C., Dallaire S., Gabriel S.B., Lee C., Daly M.J., Dallaire S., Gabriel S.B., Lee C., Daly M.J., Gabriel S.B., Lee C., Daly M.J., Lee C., Daly M.J., Daly M.J., et al. Common deletion polymorphisms in the human genome. Nat. Genet. 2006;38:86–92. doi: 10.1038/ng1696. [DOI] [PubMed] [Google Scholar]
- Ng S.K., Xue H., Xue H. Alu-associated enhancement of single nucleotide polymorphisms in the human genome. Gene. 2006;368:110–116. doi: 10.1016/j.gene.2005.10.034. [DOI] [PubMed] [Google Scholar]
- Pe’er I., Chretien Y.R., de Bakker P.I.W., Barrett J.C., Daly M.J., Altshuler D.M., Chretien Y.R., de Bakker P.I.W., Barrett J.C., Daly M.J., Altshuler D.M., de Bakker P.I.W., Barrett J.C., Daly M.J., Altshuler D.M., Barrett J.C., Daly M.J., Altshuler D.M., Daly M.J., Altshuler D.M., Altshuler D.M. Biases and reconciliation in estimates of linkage disequilibrium in the human genome. Am. J. Hum. Genet. 2006a;78:588–603. doi: 10.1086/502803. [DOI] [PMC free article] [PubMed] [Google Scholar]
- Pe’er I., de Bakker P.I.W., Maller J., Yelensky R., Altshuler D., Daly M.J., de Bakker P.I.W., Maller J., Yelensky R., Altshuler D., Daly M.J., Maller J., Yelensky R., Altshuler D., Daly M.J., Yelensky R., Altshuler D., Daly M.J., Altshuler D., Daly M.J., Daly M.J. Evaluating and improving power in whole-genome association studies using fixed marker sets. Nat. Genet. 2006b;38:663–667. doi: 10.1038/ng1816. [DOI] [PubMed] [Google Scholar]
- Sherry S., Ward M., Kholodov M., Baker J., Phan L., Smigielski E., Sirotkin K., Ward M., Kholodov M., Baker J., Phan L., Smigielski E., Sirotkin K., Kholodov M., Baker J., Phan L., Smigielski E., Sirotkin K., Baker J., Phan L., Smigielski E., Sirotkin K., Phan L., Smigielski E., Sirotkin K., Smigielski E., Sirotkin K., Sirotkin K. dbSNP: The NCBI database of genetic variation. Nucleic Acids Res. 2001;29:308–311. doi: 10.1093/nar/29.1.308. [DOI] [PMC free article] [PubMed] [Google Scholar]
- Smith A.V., Thomas D.J., Munro H.M., Abecasis G.R., Thomas D.J., Munro H.M., Abecasis G.R., Munro H.M., Abecasis G.R., Abecasis G.R. Sequence features in regions of weak and strong linkage disequilibrium. Genome Res. 2005;15:1519–1534. doi: 10.1101/gr.4421405. [DOI] [PMC free article] [PubMed] [Google Scholar]
- Yu A., Zhao C., Fan Y., Jang W., Mungall A.J., Deloukas P., Olsen A., Doggett N.A., Ghebranious N., Broman K.W., Zhao C., Fan Y., Jang W., Mungall A.J., Deloukas P., Olsen A., Doggett N.A., Ghebranious N., Broman K.W., Fan Y., Jang W., Mungall A.J., Deloukas P., Olsen A., Doggett N.A., Ghebranious N., Broman K.W., Jang W., Mungall A.J., Deloukas P., Olsen A., Doggett N.A., Ghebranious N., Broman K.W., Mungall A.J., Deloukas P., Olsen A., Doggett N.A., Ghebranious N., Broman K.W., Deloukas P., Olsen A., Doggett N.A., Ghebranious N., Broman K.W., Olsen A., Doggett N.A., Ghebranious N., Broman K.W., Doggett N.A., Ghebranious N., Broman K.W., Ghebranious N., Broman K.W., Broman K.W., et al. Comparison of human genetic and sequence-based physical maps. Nature. 2001;409:951–953. doi: 10.1038/35057185. [DOI] [PubMed] [Google Scholar]
- Zhang Z., Schwartz S., Wagner L., Miller W., Schwartz S., Wagner L., Miller W., Wagner L., Miller W., Miller W. A greedy algorithm for aligning DNA sequences. J. Comput. Biol. 2000;7:203–214. doi: 10.1089/10665270050081478. [DOI] [PubMed] [Google Scholar]