Abstract
Major histocompatibility complex (MHC) molecules are rare in the healthy brain tissue, but are heavily expressed on microglial cells after inflammatory or neurodegenerative processes. We studied the conditions leading to the induction of MHC class II molecules in microglia by using explant cultures of neonatal rat hippocampus, a model of interacting neuronal networks. Interferon-γ (IFN-γ)-dependent MHC class II inducibility in microglia cells was very low, but strongly increased in the hippocampal slices after the blockade of neuronal activity by neurotoxins [tetrodotoxin (TTX), ω-conotoxin] or glutamate antagonists. None of these agents acted directly on isolated microglia cells. We found that neurotrophins modulate microglial MHC class II expression. MHC class II inducibility was enhanced by neutralization of neurotrophins produced locally within the cultured tissues and was inhibited by the addition of nerve growth factor (NGF), brain-derived neurotrophic factor (BDNF), or neurotrophin-3 (NT3). NGF and, to a lower extent, NT3 acted directly on isolated microglia via the p75 neurotrophin receptor and inhibited MHC class II inducibility as shown by blockade of the p75 neurotrophin receptor with antibodies. Our data suggest that neurotrophins secreted by electrically active neurons control the antigen-presenting potential of microglia cells, and indicate that this effect is mediated partly via the p75 neurotrophin receptor.
The healthy central nervous system (CNS) owes its immunoprivileged status partly to the absence of locally expressed major histocompatibility complex (MHC) molecules (1). MHC class II molecules, which are constitutively expressed in professional antigen-presenting cells and are inducible in many cell types by proinflammatory cytokines, are required to present antigenic peptides to CD4+ T lymphocytes. In the healthy CNS, the deficit of MHC molecules prevents the initiation and propagation of immune responses.
However, MHC class II molecules are induced on brain cells under diverse pathologic conditions, including inflammatory processes (1) and neuronal injury (2) but, surprisingly, also neurodegenerative processes such as Alzheimer’s disease (3, 4), Parkinson’s disease (5) and amyotrophic lateral sclerosis (6). In all these situations, among all CNS components, microglia cells produce the highest levels of MHC class II molecules (7), which makes them the main antigen-presenting cells in the lesioned CNS.
Expression of MHC class II in microglia cells has been studied in various experimental model situations. Thus, in cultures of dissociated microglia cells class II molecules are readily induced upon exposure to the proinflammatory cytokine interferon-γ (IFN-γ) (8). However, microglial cells are relatively resistant to induction of MHC class II molecules by IFN-γ in the intact CNS (7) and in cultured hippocampal slices neighboring electrically active neurons as we demonstrated before (9). This resistance is lost upon neuronal injury, (2, 10, 11), where, interestingly, MHC class II molecules are not only expressed around the perikarya of lesioned neurons, but also in the terminal fields of their neurites. For example, transection of the mossy fibers of the hippocampus in vivo induces MHC class II expression of microglia in the denervated region (10).
We studied neuronal control of MHC class II expression in microglia by using organotypic hippocampal slice cultures. These cultures form functionally active neuronal circuits with synaptic innervation of the hilar region by glutamate-releasing mossy fibers (12) and therefore represent key features of neuron–glial interactions in situ (13).
MATERIALS AND METHODS
Cultures.
Hippocampal slice cultures were prepared from 2- to 3-day-old Lewis rats as previously described (9). Microglial cell cultures were prepared from newborn Lewis rats by dissecting whole forebrains, removing meninges, and dissociating the tissue. Cells were cultured in minimal essential medium with d-valin (GIBCO/BRL) supplemented with 10% fetal bovine serum (PanSystems, Nürnberg, Germany) and 1% l-glutamine (GIBCO/BRL). After 2 weeks the cell culture flasks were shaken on a rotary device to enrich microglia, and the supernatant was transferred into new, noncoated culture dishes. After 1 hr, cell cultures were rinsed with medium to enrich for readily adherent cells. About 95% of the cells were microglia cells as determined by labeling with the OX 42 mAb. One day before stimulation with IFN-γ, the medium of the enriched microglial cells was changed to the same serum-free chemically defined medium as used for the slice cultures.
IFN-γ (50 units/ml, rat recombinant IFN-γ, Laboserv, Giessen, Germany), nerve growth factor (NGF) (mouse-NGF-7S, Sigma), brain-derived neurotrophic factor (BDNF) (gift from R. Kolbeck and Y.-A. Barde), neurotrophin-3 (NT3) (gift from R. Kolbeck and Y.-A. Barde), tetrodotoxin (TTX) (1 μM, Sigma), ω-conotoxin GIVA [5 μM, Research Biochemicals (RBI)], ω-conotoxin MVIIC (10 μM, RBI), glutamate (20 μM, Sigma), MK-801 (10 μM, RBI), DNQX (10 μM, 6,7-dinitroquinoxaline-2,3-dione, RBI), mouse mAb-neutralizing NGF (0.5 μg/ml, Boehringer Mannheim), mouse mAb-neutralizing BDNF (0.5 μg/ml, gift from R. Kolbeck and Y.-A. Barde), mouse mAb-neutralizing NT3 (1 μg/ml, gift from R. Kolbeck and Y.-A. Barde), rabbit polyclonal antibody blocking p75 neurotrophin receptor (1:100, R9651, gift from M. Chao), mouse control antibody (2 μg/ml, Dianova, Hamburg, Germany), and rabbit control antibody (20 μg/ml, Dianova) were added to the slice cultures and the isolated microglial cultures as indicated in the text.
Immunofluorescence Labeling of Slice Cultures.
The tissues were fixed twice in 4% paraformaldehyde/0.25% glutaraldehyde in PBS for 30 min. Before immunostaining the tissues were treated with 0.25% sodiumborohydride in PBS for 15 min. A double-staining for MHC class II and microglia was performed sequentially with the tissue free-floating for 48 hr. Primary antibody was mouse mAb directed against MHC class II (OX6, 5 μg/ml, Serotec, Camon, Wiesbaden, Germany). Secondary antibody was Cy5-conjugated polyclonal goat antibody directed against mouse Ig (5 μg/ml, Dianova). Slices were permeabilized with 0.5% Triton X-100 in PBS, and a counter-labeling for glial lineage markers was performed. Microglia were identified with isolectin B4 (10 μg/ml, biotin labeled; Sigma). Detection was performed with Cy2-conjugated streptavidin (20 μg/ml; Biotrend, Cologne, Germany). Baseline labeling for MHC class II and microglia was performed with equal concentration of isotype-matched Ig (mouse IgG1; Becton Dickinson) or blockade of isolectin by d-(+)-galactose (2.5 mg/ml; Merck), respectively. For labeling of synaptophysin, glutaraldehyde was replaced by 0.25% Triton X-100. Mouse mAb directed against synaptophysin (5 μg/ml, Sigma) or mouse mAb directed against 200 kDa neurofilament (5 μg/ml, gift from J. Boucraut) were used first and Cy3-conjugated polyclonal goat antibody directed against mouse Ig (10 μg/ml, Dianova) was used second. The incubation period was 48 hr at 4°C for all antibodies on a shaking device followed by a washing step in PBS for 24 hr at 4°C. Finally, the tissues were counterstained for nuclei using 4′,6-diamidino-2-phenylindole (DAPI, 0.5 μg/ml; Boehringer Mannheim), and only slices showing a preserved architecture of the neuronal layers were used for confocal laser microscopy.
For anterograde labeling of mossy fibers a small crystal of biocytin (Sigma) was placed onto the gyrus dentatus for 2 hr. The slices were cultured for 2 additional days, then fixed and permeabilized as indicated above. Detection was performed with Cy3-conjugated streptavidin (10 μg/ml; Dianova).
Confocal Laser-Scanning Microscopy and Image Analyses.
Images (250 μm × 250 μm) were acquired with a laser-scanning confocal microscope (Leica, TCS4) equipped with a ×40 objective. Images of different slice cultures of one complete experiment were acquired within 6 hr with a constant laser power intensity with variations below 5%. Detection of fluorescence dye Cy5 emission (labeling for MHC class II) and fluorescence dye Cy2 (labeling for microglia) in the noncorresponding detection channel was below baseline labeling. The hilar region was selected as scanning field between the beginning pyramidal layer of the CA3/CA4 region of the hippocampus proper and the suprapyramidal limb of the stratum granulosum of the gyrus dentatus. Top and bottom of the immunolabeled slice culture was determined with the confocal laser-scanning microscope, and the central volume of the hilar region was scanned, with six images (9×9 bit) taken every 1 μm along the z-axis. To quantify MHC class II expression of microglia, analysis software (imagespace, Molecular Dynamics) was applied to the images. The images were median-filtered (kernel size, 3×3), and thresholds were applied to all images labeled for MHC class II or microglia according to the baseline-labeling controls of the immunofluorescence-labeling protocol. Colocalization of double-labeled pixels was performed. The relative expression of MHC class II of microglia was determined by dividing the number of colocalized pixels (MHC class II and microglia-positive pixels) by the number of microglia-positive pixels.
Flow Cytometry.
Enriched microglia cultures were collected by trypsination (Trypsin-EDTA, GIBCO/BRL) and washed with PBS containing 2% bovine albumin (Sigma) and 0.02% sodium azide (Merck). Cells were incubated with mouse mAb directed against MHC class II (OX 6, 10 μg/ml; Serotec) or mouse mAb directed against microglia/macrophages (OX 42, 10 μg/ml, Serotec). As negative control, an equal concentration of irrelevant isotype-matched Ig was used (mouse IgG1; Becton Dickinson). Cells were washed twice and incubated with fluorochrome (dichlorotriazinyl) aminofluorescein-conjugated goat antibody directed against mouse Ig (10 μg/ml; Dianova). Cells were washed three times, and dead cells were counter-labeled with propidium iodide (5 μg/ml, Sigma). Fluorescence-activated cell sorter analysis (Becton Dickinson FACScan) was repeated of three independent experiments, and the mean and standard error of the mean were calculated.
Reverse Transcription–PCR (RT-PCR).
Total RNA was harvested from microglial cell cultures with RNAzolB (Wak Chemie, Bad Homburg, Germany) according to the manufacture’s instructions. RNA (1 μg) was reverse-transcribed with Moloney murine leukemia virus reverse transcriptase (100 units, GIBCO/BRL), DTT (GIBCO/BRL), hexamer random primer (1 μl, Boehringer Mannheim), and the four deoxyribonucleotid triphosphates (0.5 mM, Pharmacia) in a total volume of 20 μl. Rat dorsal root ganglia RNA was obtained from cultured rat dorsal root ganglia neurons (14) and was reverse-transcribed by using the same protocol as described above. The respective primer sequences for rat trkA (GenBank/EMBL accession no. M85214) were: 5′-ATCTGGGCAAAGCCGTGGAACA-3′ (positions 933–954), 5′-GACAGGGATGGGGTCCTCAGGG-3′ (positions 1249–1228); for rat trkB (M55291), 5′-ACGGCAACCTGCGGCACATCA-3′ (positions 1005–1025), 5′-CGGGTCACCCCCGACGCTG-3′ (positions 1336–1318) and 5′-CCGCCCACCGAGCTGACG-3′ (positions 2591–2608), 5′-GTGTGTGGTTCCCGCTGCCA-3′ (positions 3048–3029); for rat trkC (L14445), 5′-AGAGAACTGGCGGGGCCTGCA-3′ (positions 255–275), 5′-CAGCCGTGCCTCCCCCTGTTC-3′ (positions 546–526) and 5′-GGACAGCCACGCCAGGCCAA-3′ (positions 1924–1943), 5′-TGTTGTGGTTCCCTCTGCCA-3′ (positions 2396–2377); for rat p75 neurotrophin receptor (X05137), 5′-CGGCACCACCGACAACCTCATT-3′ (positions 851–872), 5′-GCTCG CCTGCCAGATGTCGC-3′ (positions 1203–1184). PCR amplification was done in a final volume of 50 μl containing 1 μl of the transcribed cDNA probe, the four deoxyribonucleotid triphosphates (final 0.2 mM, Pharmacia), 2.5 units AmpliTaq (Perkin–Elmer/Cetus), and 1× PCR buffer (Perkin–Elmer/Cetus) covered with two drops of mineral oil (Sigma). PCR was performed by 40 cycles (93°C for 60 sec; ramp with 0.1°C per sec from 93°C to 60°C; 60°C for 60 sec; 72°C for 60 sec) and followed by one final cycle at 72°C for 5 min. Ten microliters of the amplification reaction was run in parallel with the molecular weight marker (ΦX 174, HaeIII digested, Pharmacia) on a 1.7% agarose gel electrophoresis stained with ethidium bromide.
Statistics.
For confocal laser-scanning analyses, typically 54 images for each treated experimental group were acquired from 4 to 11 different slices of several independent experiments. Mean and standard error of the mean were calculated by using the averaged relative expression of MHC class II of microglia (by dividing the number of colocalized pixels by the number of microglia-positive pixels of individual slices). To confirm statistical significance, only mean values of independent experiments were analyzed by two-tailed, unpaired Student’s t test. Data of MHC class II of microglia in slice cultures treated with IFN-γ plus TTX or IFN-γ plus DNQX plus MK-801 were significantly (P < 0.05) different compared with slice cultures treated with IFN-γ alone. Data of MHC class II of microglia in slice cultures treated with IFN-γ plus TTX plus glutamate or IFN-γ plus TTX plus NGF or IFN-γ plus TTX plus BDNF were significantly (P < 0.05) different compared with slice cultures treated with IFN-γ plus TTX.
In the flow cytometry analyses of isolated microglia about 5,000 cells were analyzed in each experimental group. Mean and standard error of the mean were calculated from several independent experiments (repeated at least three times). Data of MHC class II on isolated microglial cells treated with IFN-γ plus NGF (50 ng/ml) were significantly (P < 0.01) different compared with IFN-γ treatment by two-tailed, unpaired Student’s t test.
RESULTS AND DISCUSSION
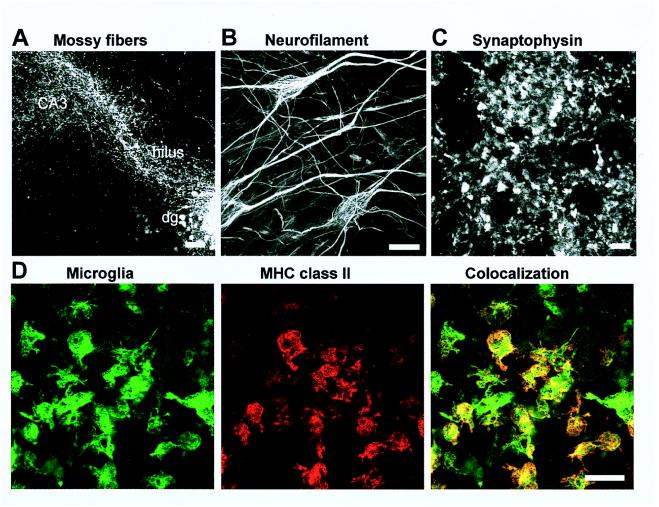
Hippocampal slices from newborn Lewis rats were cultured for 1 week in serum-free, chemically defined medium. These explants contained well preserved neurons as demonstrated by the neuronal cytoskeleton marker neurofilament (Fig. 1). Anterograde tracing of neurons confirmed that mossy fibers had elongated in vitro and innervated the hilar hippocampal region (Fig. 1). Furthermore, synapses were detected along the mossy fibers by using a mAb directed against synaptophysin (Fig. 1).
Figure 1.
Neuronal outgrowth and MHC class II expression of microglia in the cultured hippocampal slices analyzed by confocal laser-scanning microscopy. Neuronal outgrowth was determined by anterograde labeling of mossy fibers innervating the hilus and the CA3 region of the hippocampus (A), by immunolabeling for the cytoskeleton protein neurofilament (B), and by immunolabeling for the synapse protein synaptophysin (C). Slices were treated with IFN-γ (50 units/ml) and double-labeled for MHC class II and isolectin for microglia (D). MHC class II molecules were visualized mainly on microglia. [Bars = 100 μm (A), 20 μm (B), 5 μm (C), 50 μm (D).]
Our investigations of MHC class II molecules directed confocal laser microscopy on the well preserved inner part of the hilar hippocampal region. In the absence of specific stimulation, MHC class II molecules were not detected. In contrast, after 72-hr treatment with the proinflammatory cytokine IFN-γ (50 units/ml), MHC class II molecules had appeared. We identified the cell types expressing MHC class II by using double-labeling with glia cell lineage markers. Confirming our previous data (9), MHC class II molecules were seen mainly on microglia (Fig. 1) but were undetectable on astrocytes in the intact part of the hilar hippocampal region (data not shown).
To quantify the level of MHC class II expression on microglia we applied a computer-assisted image analysis system to the double-labeled confocal images. About 50 images with a size of 250 μm × 250 μm were analyzed in each experimental group. The images of MHC class II and microglia were colocalized, and the number of MHC class II-positive pixels on microglia was determined.
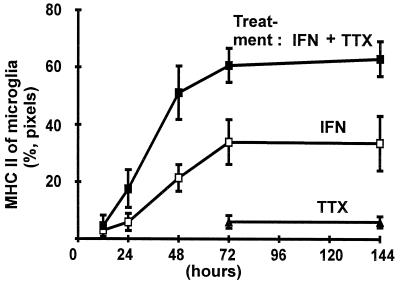
Previously we demonstrated that neurons participate in the regulation of MHC class II of microglia (9). To confirm this neuronal control we paralyzed neurons with the sodium channel blocker, TTX, which inhibits spontaneous action potentials. Chronic blockade of neuronal activity promoted MHC class II inducibility of microglia (Fig. 2). Treatment for 72 hr with TTX increased the percentage of MHC class II-positive pixels colocalized with microglial maker from 24% (mean, ±6% SEM) to 64% (±7%). Treatment of the slice cultures with TTX alone did not affect MHC class II levels in microglia (Fig. 2).
Figure 2.
MHC class II inducibility of microglia in the cultured slices as determined by image analysis. Relative expression of MHC class II on microglia (%, pixels) was analyzed by colocalization of pixels on the confocal images. Slices were treated as indicated in the graph for 12, 24, 48, 72, and 144 hr with IFN-γ (IFN, 50 units/ml), IFN-γ plus TTX (IFN, 50 units/ml + TTX, 1 μM), or TTX (TTX, 1 μM) alone. Data are presented as mean and SEM.
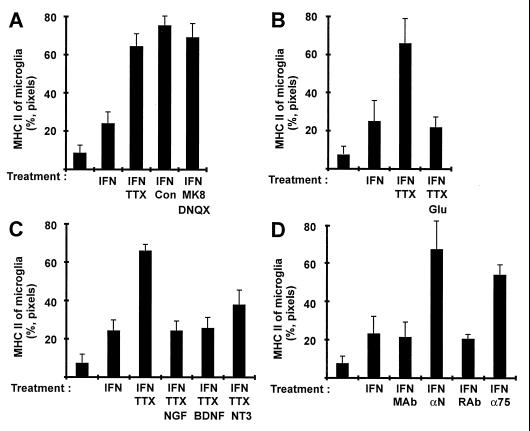
To learn whether expression of MHC class II in microglia cells is suppressed by neurotransmitter release, we blocked presynaptic Ca2+ channels in the slice cultures with ω-conotoxin GVIA plus ω-conotoxin MVIIC (15). Indeed, blockade of neurotransmitter release led to increased expression of MHC class II of microglia (Fig. 3A). Glutamate is the most important excitatory neurotransmitter released by mossy fibers in the hilar region of the hippocampus (16). Blockade of the ionotropic glutamate receptors (NMDA, kainate, and AMPA receptors) by DNQX and MK-801 also resulted in elevated MHC class II expression of microglia (Fig. 3A).
Figure 3.
Modulation of MHC class II inducibility of microglia in cultured slices by neuronal activity and neurotrophins. Relative expression of MHC class II on microglia (%, pixels) was analyzed on the confocal images by colocalization of pixels. Slices were treated for 72 hr with IFN-γ (IFN, 50 units/ml), and neuronal activity was modulated by TTX (TTX, 1 μM), ω-conotoxin GIVA plus ω-conotoxin MVIIC (Con, 5 μM and 10 μM, respectively), or glutamate antagonist MK801 (MK8, 10 μM) plus DNQX (10 μM) (A). Treatment of the slice cultures with glutamate (20 μM) for 72 hr reversed the TTX-induced up-regulation of MHC class II (B). In addition, NGF (50 ng/ml), BDNF (50 ng/ml), or NT3 (50 ng/ml) was applied for 72 hr and reversed MHC class II expression of microglia in slices treated with IFN-γ and TTX. (C). Slices were treated with IFN-γ (IFN, 50 units/ml), and action of endogenous neurotrophins was inhibited by a mixture of mouse-neutralizing antibodies directed against the neurotrophins NGF/BDNF/NT3 (αN) or by rabbit antibody blocking the p75 neurotrophin receptor (D). As a control slices were treated with equal amounts of total mouse antibody (MAb) or rabbit antibody (RAb), respectively. All data are presented as mean and SEM.
If spontaneous action potentials prevent MHC class II expression on microglia via the release of neurotransmitter glutamate, application of glutamate should reverse MHC class II up-regulation of microglia in paralyzed slice cultures. This indeed was the case. Adding 20 μM glutamate (a dose that showed no apparent neurotoxic effects in this culture system) to slice cultures treated with TTX reversed the action of neuronal paralysis, resulting in low expression of MHC class II on microglia (Fig. 3B).
However, glutamate did not act directly on microglia cells. Microglia cultures of 95% purity (determined by immunolabeling with the microglial marker OX 42) were analyzed for MHC class II inducibility by flow cytometry. Neither glutamate, TTX, ω-conotoxins, nor glutamate-receptor blockers changed the level of MHC class II inducibility of isolated microglia in any appreciable way (data not shown).
So far, our work established that synaptic activity is required to down-regulate MHC class II expression of microglia but this regulation is not directly mediated by the neurotransmitter glutamate. Among the activity-dependent neuronal mediators potentially involved in MHC regulation, members of the neurotrophin family, whose production and release is closely associated with synaptic activity (17), were particularly attractive candidates. Examining the effect of NGF, BDNF, and NT3, we found that treatment of slice cultures with NGF (50 ng/ml) and BDNF (50 ng/ml) both completely restored suppression of MHC class II in microglia, which had been lost after neuronal paralysis by TTX (Fig. 3C). The down-regulatory effect of NT3 (50 ng/ml) was less pronounced (Fig. 3C).
These findings were confirmed by experiments neutralizing neurotrophins produced within the brain explants. Treatment of the slice culture with a combination of antibodies neutralizing NGF, BDNF, and NT3 resulted in an increase of the percentage of MHC class II-positive pixels from 23% (±8%) to 67% (±14%) (Fig. 3D). Neurotrophins bind to two different classes of receptors: the tyrosine kinase receptors (trkA, trkB, or trkC) or the p75 neurotrophin receptor (first described as the low-affinity NGF receptor). Blockade of p75 neurotrophin receptors in the slice culture with polyclonal receptor-specific antibodies up-regulated microglial MHC class II molecules, though to a lesser degree (54 ± 5%) (Fig. 3D).
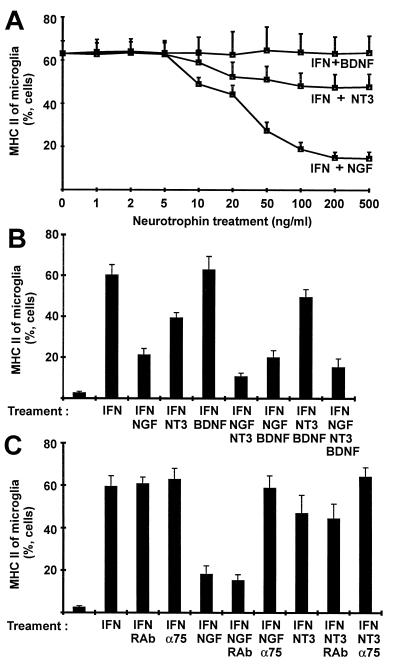
In contrast to glutamate, neurotrophins acted directly on microglia cells. NGF and, to some lower degree, NT3, but not BDNF, inhibited MHC class II induction in isolated microglia as determined by flow cytometry (Fig. 4A). NGF (50 ng/ml) reduced the proportion of MHC class II-positive microglial cells from 63% (mean ± 6% SEM) to 34% (±4%). The effect of NT3 (50 ng/ml) was markedly lower (reduction to 51 ± 10%), whereas BDNF did not affect MHC class II expression in isolated microglia (Fig. 4A). NGF (50 ng/ml) and NT3 (50 ng/ml) acted synergistically on isolated microglia cells and in combination decreased MHC class II expression from 60% (±9%) to 11% (±4%) (Fig. 4B).
Figure 4.
Analysis of MHC class II expression of isolated cultured microglia by flow cytometry. (A) Isolated microglial cells were treated for 72 hr with IFN-γ (IFN, 50 units/ml) and different concentrations of NGF, BDNF, and NT3 for 72 hr. (B) Isolated microglial cells were induced by IFN-γ (IFN, 50 units/ml), and different combinations of NGF (50 ng/ml), BDNF (50 ng/ml), and NT3 (50 ng/ml) were added to the cell cultures for 72 hr. (C) In addition, microglial cells were treated for 72 hr with IFN-γ (IFN, 50 units/ml), and action of NGF (50 ng/ml) and NT3 (50 ng/ml) on MHC class II of microglia was inhibited with rabbit antibody blocking the p75 neurotrophin receptor (α75). Isolated microglial cells were treated with rabbit antibody (RAb) as a control. Data are presented as relative number of cells (mean and SEM).
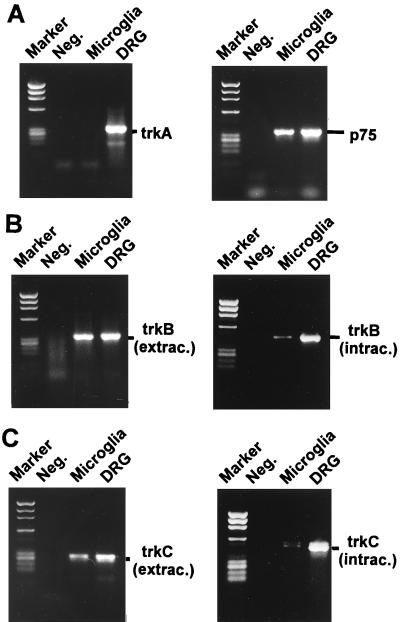
NGF acted on microglia cells by binding to the low-affinity, p75 neurotrophin receptor. A RT-PCR study of isolated microglia derived from brain cultures failed to show trkA receptor transcription, but detected trkB, trkC, and p75 neurotrophin receptor gene transcripts (Fig. 5). In a positive control (RNA of dorsal root ganglia) all four gene transcripts, including the trkA receptor, were amplified by RT-PCR (Fig. 5). Interestingly, RT-PCR analysis of isolated microglia demonstrated gene transcripts of the intracellular domains of the trkB and trkC receptors at a very low level, indicating preferential expression of truncated trkB and trkC receptors in microglia.
Figure 5.
Analysis of the neurotrophin receptors of isolated microglia (Microglia) and dorsal root ganglia culture (DRG) by RT-PCR. (A) PCR fragments of the trkA receptor were detected in dorsal root ganglia culture, but not in isolated microglia culture. The p75 neurotrophin receptor was detected in both dorsal root ganglia culture and isolated microglial culture. (B and C) PCR fragments of the trkB and trkC receptors were amplified in isolated microglia culture from the extracellular (extrac.) and intracellular (intrac.) domains. The intracellular tyrosine kinase domains of the receptors were detectable at a very low level. Lanes labeled “Marker” and “Neg.” show the molecular weight marker ΦX174/HaeIII-digested and negative PCR control, respectively.
The NGF action on microglial p75 receptor was confirmed by using the p75 neurotrophin receptor-blocking antiserum, which completely neutralized the inhibitory effect of both NGF and of NT3 on MHC class II induction in isolated microglia (Fig. 4C).
This study was carried out to identify neuronal signals that regulate MHC class II of microglia. The data obtained confirmed that electrically active neurons suppress spontaneous MHC class II molecules on microglia. Induction of MHC class II of microglia by IFN-γ was suppressed by functionally intact neurons but restored by blockade of sodium-dependent neuronal activity. Furthermore, the present data demonstrate that the neurotransmitter glutamate, which is released during synaptic activity in the hippocampus, is involved in this inhibitory regulation, but does not directly act on microglia cells. Instead, we identified neurotrophins as activity-dependent regulators of microglial MHC class II expression.
Neurotrophins are produced in the intact CNS predominantly by neurons, which release them depending on synaptic activity (17). It is known that blockade of neuronal activity with TTX inhibits production or release of BDNF and NGF from neurons, whereas glutamate stimulates BDNF and NGF production or release (18–21). In contrast, regulation of NT3 production by synaptic activity appears to be indirect (17). Removing the synaptic input by mechanical denervation decreased transcription of BDNF and NT3 in the hippocampus (22).
Among the three neurotrophins investigated, BDNF showed an unexpected functional pattern. Although this neurotrophin inhibited MHC class II of microglia in the organotypic slice cultures, it was inefficient in cultures of isolated microglia. It is possible that in explants, BDNF exerts an indirect regulatory function on a nonmicroglial cell, which would then release directly regulatory NGF or NT-3. In fact, it has been demonstrated recently that neurotrophin secretion is inducible by neurotrophins and BDNF has the capability to release NGF via activation of trk receptors (23).
Principally, MHC class II inducibility in hippocampal slices could be enhanced by neutralizing locally released neurotrophins (NGF, BDNF, and NT3) as well as by blocking the p75 neurotrophin receptor. That depletion of neurotrophins was more effective than p75 neurotrophin receptor blockade may indicate that modulation of MHC class II of microglia by neurotrophins is not mediated exclusively via the p75 neurotrophin receptor. It remains to be shown whether neurotrophins released after synaptic activity inhibit MHC class II expression of neighboring microglia by additional independent or redundant mechanisms.
Our work identifies NGF and, to some extent, NT3 as mediators directly modulating microglial function via the p75 neurotrophin receptor. Consequently, neurotrophin signaling via the p75 receptor (a member of the tumor necrosis factor receptor family) does not seem to be limited to the control of neuronal survival and death (24), but seems also to affect functional interactions between neural and immune cells.
Acknowledgments
We thank Lydia Penner for expert technical assistance, Drs. Gerhard Hager, Martin Reddington, and Robert Streif for helpful advice at the confocal laser microscope, Dr. Isabelle Medana for helpful discussions, Dr. Moses Chao for rabbit antibody directed against p75 neurotrophin receptor (R9651), Drs. Yves-Alain Barde and Roland Kolbeck for BDNF, NT3, mouse antibody directed against BDNF, and mouse antibody directed against NT3, Dr. José Boucraut for mouse antibody directed against neurofilament, Dr. Michael Frotscher for technical advice, and Dr. Yves-Alain Barde for critically reading the manuscript. Research from our laboratory was supported by the Deutsche Forschungsgemeinschaft (SFB 391) and by the European Community (CHRX-CT94-0670).
Footnotes
This paper was submitted directly (Track II) to the Proceedings Office.
Abbreviations: BDNF, brain-derived neurotrophic factor; CNS, central nervous system; DNQX, 6,7-dinitroquinoxaline-2,3-dione; IFN-γ, interferon-γ; MHC, major histocompatibility complex; NGF, nerve growth factor; NT3, neurotrophin-3; TTX, tetrodotoxin; RT-PCR, reverse transcription–PCR.
References
- 1.Wekerle H, Linington C, Lassmann H, Meyermann R. Trends Neurosci. 1986;9:271–277. [Google Scholar]
- 2.Streit W J, Graeber M B, Kreutzberg G W. J Neuroimmunol. 1989;21:117–123. doi: 10.1016/0165-5728(89)90167-7. [DOI] [PMC free article] [PubMed] [Google Scholar]
- 3.Itagaki S, McGeer P L, Akiyama H. Neurosci Lett. 1988;91:259–264. doi: 10.1016/0304-3940(88)90690-8. [DOI] [PubMed] [Google Scholar]
- 4.Perlmutter L S, Scott S A, Chui H C. J Neurosci Res. 1992;33:549–558. doi: 10.1002/jnr.490330407. [DOI] [PubMed] [Google Scholar]
- 5.McGeer P L, Itagaki S, McGeer E G. Acta Neuropathol. 1988;76:550–557. doi: 10.1007/BF00689592. [DOI] [PubMed] [Google Scholar]
- 6.Kawamata T, Akiyama H, Yamada T, McGeer P L. Am J Pathol. 1992;140:691–707. [PMC free article] [PubMed] [Google Scholar]
- 7.Vass K, Lassmann H. Am J Pathol. 1990;137:789–800. [PMC free article] [PubMed] [Google Scholar]
- 8.Frei K, Siepl C, Groscurth P, Bodmer S, Schwerdel C, Fontana A. Eur J Immunol. 1987;17:1271–1275. doi: 10.1002/eji.1830170909. [DOI] [PubMed] [Google Scholar]
- 9.Neumann H, Boucraut J, Hahnel C, Misgeld T, Wekerle H. Eur J Neurosci. 1996;8:2582–2590. doi: 10.1111/j.1460-9568.1996.tb01552.x. [DOI] [PubMed] [Google Scholar]
- 10.Finsen B R, Tönder N, Xavier G F, Sörensen J C, Zimmer J. J Chem Neuroanat. 1993;6:276–275. doi: 10.1016/0891-0618(93)90048-9. [DOI] [PubMed] [Google Scholar]
- 11.Kreutzberg G W. Trends Neurosci. 1996;19:312–318. doi: 10.1016/0166-2236(96)10049-7. [DOI] [PubMed] [Google Scholar]
- 12.Gähwiler B H. Trends Neurosci. 1988;11:484–489. doi: 10.1016/0166-2236(88)90007-0. [DOI] [PubMed] [Google Scholar]
- 13.Del Rio J A, Heimrich B, Soriano E, Schwegler H, Frotscher M. Neuroscience. 1991;43:335–347. doi: 10.1016/0306-4522(91)90298-3. [DOI] [PubMed] [Google Scholar]
- 14.Rohrer H, Henke-Fahle S, El-Sharkawy T, Lux H D, Thoenen H. EMBO J. 1985;4:1709–1714. doi: 10.1002/j.1460-2075.1985.tb03840.x. [DOI] [PMC free article] [PubMed] [Google Scholar]
- 15.Scholz K P, Miller R J. J Neurosci. 1995;15:4612–4617. doi: 10.1523/JNEUROSCI.15-06-04612.1995. [DOI] [PMC free article] [PubMed] [Google Scholar]
- 16.Jonas P, Major G, Sakmann B. J Physiol. 1993;472:615–663. doi: 10.1113/jphysiol.1993.sp019965. [DOI] [PMC free article] [PubMed] [Google Scholar]
- 17.Thoenen H. Science. 1995;270:593–598. doi: 10.1126/science.270.5236.593. [DOI] [PubMed] [Google Scholar]
- 18.Zafra F, Lindholm D, Castrén E, Hartikka J, Thoenen H. J Neurosci. 1992;12:4793–4799. doi: 10.1523/JNEUROSCI.12-12-04793.1992. [DOI] [PMC free article] [PubMed] [Google Scholar]
- 19.Castrén E, Zafra F, Thoenen H, Lindholm D. Proc Natl Acad Sci USA. 1992;89:9444–9448. doi: 10.1073/pnas.89.20.9444. [DOI] [PMC free article] [PubMed] [Google Scholar]
- 20.Blöchl A, Thoenen H. Eur J Neurosci. 1995;7:1220–1228. doi: 10.1111/j.1460-9568.1995.tb01112.x. [DOI] [PubMed] [Google Scholar]
- 21.Blöchl A, Thoenen H. Mol Cell Neurosci. 1996;7:173–190. doi: 10.1006/mcne.1996.0014. [DOI] [PubMed] [Google Scholar]
- 22.Fagan A M, Suhr S T, Lucidi-Phillipi C A, Peterson D A, Holtzman D M, Gage F H. J Neurosci. 1997;17:2499–2511. doi: 10.1523/JNEUROSCI.17-07-02499.1997. [DOI] [PMC free article] [PubMed] [Google Scholar]
- 23.Canossa M, Griesbeck O, Berninger B, Campana G, Kolbeck R, Thoenen H. Proc Natl Acad Sci USA. 1997;94:13279–13286. doi: 10.1073/pnas.94.24.13279. [DOI] [PMC free article] [PubMed] [Google Scholar]
- 24.Dechant G, Barde Y A. Curr Opin Neurobiol. 1997;7:413–418. doi: 10.1016/s0959-4388(97)80071-2. [DOI] [PubMed] [Google Scholar]


