

Summary
Hypercholesterolemia is a major causative factor for atherosclerotic cardiovascular disease. The molecular mechanisms by which cholesterol initiates and facilitates the process of atherosclerosis are not well understood. Here, we demonstrate that cholesterol treatment suppresses or attenuates TGF-β responsiveness in all cell types studied as determined by measuring TGF-β-induced Smad2 phosphorylation and nuclear translocation, TGF-β-induced PAI-1 expression, TGF-β-induced luciferase reporter gene expression and TGF-β-induced growth inhibition. Cholesterol, alone or complexed in lipoproteins (LDL, VLDL), suppresses TGF-β responsiveness by increasing lipid raft and/or caveolae accumulation of TGF-β receptors and facilitating rapid degradation of TGF-β and thus suppressing TGF-β-induced signaling. Conversely, cholesterol-lowering agents (fluvastatin and lovastatin) and cholesterol-depleting agents (β-cyclodextrin and nystatin) enhance TGF-β responsiveness by increasing non-lipid raft microdomain accumulation of TGF-β receptors and facilitating TGF-β-induced signaling. Furthermore, the effects of cholesterol on the cultured cells are also found in the aortic endothelium of ApoE-null mice fed a high-cholesterol diet. These results suggest that high cholesterol contributes to atherogenesis, at least in part, by suppressing TGF-β responsiveness in vascular cells.
Keywords: Cholesterol, TGF-β, TGF-β receptors
Introduction
Transforming growth factor-β (TGF-β) is a family of 25-kDa dimeric growth factors or cytokines and has three members (TGF-β1−3) in mammalian species (Massague, 1990; Roberts, 1998). TGF-β is a bifunctional growth regulator: it inhibits cell growth of most cell types, but stimulates growth of mesenchymal cells. The growth inhibitory activity of TGF-β has been implicated in its immune-suppressing and tumor suppressor activities. TGF-β is a potent stimulator of extracellular matrix synthesis and is involved in the processes of wound healing and tissue fibrosis (Massague, 1990; Roberts, 1998). TGF-β is also an anti-inflammatory factor which inhibits migration and differentiation of inflammatory cells (Shull et al., 1992; Kulkarni et al., 1993; Li, M. et al., 2006). Because of its anti-inflammatory, immunomodulatory and fibrogenic activities, TGF-β is hypothesized to be a protective cytokine in blood for atherosclerosis (Metcalfe and Grainger, 1995). This hypothesis has been supported by several lines of evidence: (1) TGF-β antagonizes many events involved in atherosclerosis (Owens et al., 1988; Gamble et al., 1993; Mallat et al., 2001); (2) TGF-β is an anti-inflammatory cytokine (Shull et al., 1992; Kulkarni et al., 1993; Li, M. et al., 2006), and inflammation is pivotal in the initiation and promotion of the late stages of atherosclerosis (Libby, 2002); and (3) patients with high plasma levels of TGF-β tend not to develop atherosclerotic cardiovascular disease (Grainger et al., 1995). A causal link between atherosclerosis and low TGF-β responsiveness in vascular cells and/or low TGF-β levels in plasma has been demonstrated in several relevant in vivo models (McCaffrey et al., 1997; Grainger et al., 2000; Mallat et al., 2001; Reckless et al., 2001; Robertson et al., 2003; Li, D. et al., 2006). This implies that physiological factors that are capable of suppressing TGF-β responsiveness in vascular cells are potentially atherogenic.
Cholesterol is an essential structural component of lipid rafts and caveolae which are cholesterol- and sphingolipid-enriched microdomains in plasma membranes (Galbiati et al., 2001; Simons and Ehehalt, 2002). Lipid rafts and caveolae are also enriched in signaling proteins, including Src-family kinases, heterotrimeric G protein subunits, and growth factor receptor tyrosine kinases (Galbiati et al., 2001). Lipid rafts and caveolae have been shown to support signaling by functioning as platforms for recruitment and organization of signal transduction molecules and to suppress signaling by sequestering signaling proteins (Simons and Toomre, 2001; Gomez-Mouton et al., 2004). The signaling induced by insulin (Bickel, 2002), NGF (Encinas et al., 2001) and PDGF-BB (Liu et al., 1996) is reduced following cholesterol depletion; conversely, the signaling induced by EGF is enhanced following disruption of lipid rafts and/or caveolae (lipid rafts/caveolae) (Ringerike et al., 2002). More recently, lipid raft/caveolae-mediated endocytosis has been shown to facilitate TGF-β degradation and suppress TGF-β responsiveness (Di Guglielmo et al., 2003; Mitchell et al., 2004; Le Roy and Wrana, 2005; Huang and Huang, 2005; Chen et al., 2006). Among the growth factors and hormones whose receptors are known to be associated with lipid rafts/caveolae, only TGF-β is present at high levels in normal blood vessel walls (Grainger, 2004).
Since cholesterol is atherogenic (Steinberg, 2005) and since lipid rafts/caveolae play a role in the modulation of TGF-β responsiveness (Di Guglielmo et al., 2003; Chen et al., 2006) and the development of atherosclerosis (Lee et al., 2004), we hypothesize that high cholesterol initiates and/or facilitates atherogenesis by suppressing TGF-β responsiveness (Smad2 and/or Smad3 dependent) in vessel-wall cells via promoting formation of or stabilizing lipid rafts/caveolae and facilitating TGF-β degradation. To test this hypothesis, we determined the effects of cholesterol and/or lipoproteins and cholesterol-lowering agents or cholesterol-depleting agents on TGF-β responsiveness and on lipid raft/caveolae localization and degradation of TGF-β receptors in several cell types. We also examined the indicators for TGF-β responsiveness, including the ratio of TGF-β binding to the type II and type I TGF-β receptors (TβR-II and TβR-I; also known as TGFβR2 and TGFβR1 – Mouse Genome Informatics) and the level of phosphorylated Smad2 (P-Smad2), in the aortic endothelium of ApoE-null mice fed a high-cholesterol diet (atherosclerotic mice). In this study, we demonstrate that cholesterol, both free and complex forms (e.g. low density lipoprotein; LDL), suppresses TGF-β responsiveness in all cell types studied whereas cholesterol-lowering agents (lovastatin and fluvastatin) and cholesterol-depleting agents [β-cyclodextrin (β-CD) and nystatin] enhance TGF-β responsiveness in these cells. We show that cholesterol increases and statins, β-CD and nystatin decrease lipid raft/caveolae localization and TGF-β-induced degradation of the TGF-β receptors. Furthermore, we show that suppressed TGF-β responsiveness occurs in the aortic endothelium of ApoE-null mice fed a high-cholesterol diet, similar to that previously observed in vascular cells derived from atherosclerotic patients with hypercholesterolemia (McCaffrey et al., 1997).
Results
TGF-β-induced signaling is modulated by cholesterol and statins
Since cholesterol is an important structural component of lipid rafts and caveolae (Pike, 2003; Lee et al., 2004), the treatment of cells with cholesterol may suppress TGF-β-induced signaling, and thus TGF-β responsiveness by promoting formation of or stabilization of lipid rafts and caveolae. To test the effect of cholesterol on TGF-β-induced signaling, we determined the effect of cholesterol treatment on TGF-β-induced Smad2 phosphorylation and nuclear translocation, both of which are key signaling events, leading to TGF-β responsiveness (Heldin et al., 1997; Massague, 1998; Moustakas et al., 2001). Mink lung epithelial (Mv1Lu) cells, which are a standard model system for investigating TGF-β responsiveness, and bovine aorta endothelial cells (BAECs) were treated with increasing concentrations of cholesterol at 37°C for 1 hour and then incubated with 50 pM TGF-β1 at 37°C for 30 minutes. P-Smad2 and Smad2 in the cell lysates were determined by 7.5% SDS-PAGE followed by western blot analysis using anti-P-Smad2 and anti-Smad2 antibodies and the enhanced chemiluminescence (ECL) system, and quantified by densitometry. As shown in Fig. 1A,B, cholesterol effectively suppressed Smad2 phosphorylation stimulated by TGF-β1 in a concentration-dependent manner in both Mv1Lu cells and BAECs. Cholesterol treatment appreciably suppressed Smad2 phosphorylation at concentrations of 6−100 μg/ml. At 25 μg/ml, cholesterol suppressed Smad2 phosphorylation by ∼55% and ∼90% in Mv1Lu cells and BAECs, respectively. Cholesterol also suppressed Smad2 phosphorylation in a concentration-dependent manner in NRK cells. At 25 μg/ml, cholesterol suppressed Smad2 phosphorylation by ∼40% in these cells (data not shown). Since cholesterol is mainly present as lipoprotein complexes (e.g. LDL and VLDL) in plasma, we determined the effects of low density lipoprotein (LDL) and very low density lipoprotein (VLDL) on Smad2 phosphorylation in Mv1Lu cells. As shown in Fig. 1C, LDL (50 μg protein/ml) treatment suppressed Smad2 phosphorylation by ∼60% in Mv1Lu cells and VLDL (5 μg/ml) slightly suppressed Smad2 phosphorylation in these cells. At 50 μg protein/ml, VLDL suppressed Smad2 phosphorylation by ∼55±5% (n=4) in Mv1Lu cells. The concentration (50 μg/ml) of LDL used in the experiment was chosen because it caused inhibition of Smad2 phosphorylation by ∼60%, which was similar to that induced by 25 μg/ml cholesterol (Fig. 1A). To determine the effect of cholesterol on Smad2 nuclear translocation, Mv1Lu cells were treated with 50 μg/ml cholesterol at 37°C for 1 hour and then further incubated with and without 50 pM TGF-β1 at 37°C for 30 minutes. These cells were subjected to immunofluorescent staining using anti-P-Smad2 antibody and nuclear 4′,6-diamidine-2-phenylindole (DAPI) staining. As shown in Fig. 1D, cholesterol suppressed Smad2 nuclear translocation (Fig. 1D,c versus b). Counting cells with Smad2 nuclear localization from four separate experiments indicated that TGF-β1 induced Smad2 nuclear translocation in all of the treated cells, whereas cholesterol suppressed Smad2 nuclear translocation in 60±5% of these cells. Taken together, these results suggest that cholesterol treatment suppresses TGF-β1-induced signaling.
Fig. 1.

Effects of cholesterol and LDL on Smad2 phosphorylation (A-C) and nuclear translocations (D) in Mv1Lu cells and BAECs stimulated with TGF-β1. Cells were treated with increasing concentrations of cholesterol, as indicated (A,B), 50 μg protein/ml LDL (C), 5 μg protein/ml VLDL (C) or 50 μg/ml cholesterol (D) at 37°C for 1 hour and then further incubated with 50 pM TGF-β1 for 30 minutes. P-Smad2 and total Smad2 in the cell lysates were analyzed by immunoblotting. The relative level of P-Smad2 (P-Smad2/Smad2) was estimated. A representative of a total of three analyses is shown (top). The quantitative analysis of the immunoblots is shown below. The relative level of P-Smad2 in cells treated with TGF-β1 only was taken as 100% of TGF-β1-stimulated Smad2 phosphorylation. The data are mean ± s.d. *,**Significantly lower than that in cells treated with TGF-β1 only: P<0.001 and P<0.05, respectively. (D) Smad2 nuclear translocation was analyzed by indirect immunofluorescent staining. Rhodamine fluorescence represents P-Smad2 staining (a-c) whereas the nuclei were stained by DAPI staining (d-f).
TGF-β-induced gene expression is modulated by cholesterol and statins
One important biological activity of TGF-β is the transcriptional activation of genes coding for extracellular matrix (ECM) proteins and their regulatory proteins such as plasminogen activator inhibitor-1 (PAI-1) (Massague, 1990; Heldin et al., 1997; Roberts, 1998; Moustakas et al., 2001). This transcriptional activation is mediated by the Smad2/3 signaling pathway. To define the effect of cholesterol on TGF-β responsiveness, we determined the effect of cholesterol on PAI-1 expression in cells stimulated with TGF-β1 by northern blot analysis using a PhosphoImager. PAI-1 expression is commonly used to determine TGF-β responsiveness (Smad2/3 dependent) in many cell types (Lund et al., 1987; Massague, 1990; Roberts, 1998). Mv1Lu cells and BAECs were treated with increasing concentrations of cholesterol at 37°C for 1 hour and then further incubated with 50 pM TGF-β1 at 37°C for 2 hours. Northern blot analysis of PAI-1 and glyceraldehyde-3-phosphate dehydrogenase (G3PDH) transcripts in the cell lysates was performed; G3PDH expression was used as an internal control. As shown in Fig. 2A,B, treatment of Mv1Lu cells and BAECs with cholesterol attenuated PAI-1 expression in a concentration-dependent manner: at 2 μg/ml (∼5 μM), cholesterol attenuated PAI-1 expression by ∼50% in both cell types, and at 50 μg/ml (∼125 μM) by ∼70−80% in these cells. To further define the effect of cholesterol on TGF-β responsiveness, we determined the effect of cholesterol (50 μg/ml) on PAI-1 expression in cells treated with several concentrations of TGF-β1. As shown in Fig. 2C,D, treatment with 50 μg/ml cholesterol effectively suppressed PAI-1 expression in Mv1Lu cells (Fig. 2C) and BAECs (Fig. 2D) stimulated with several concentrations of TGF-β1, ranging from 2 to 100 pM. Cholesterol suppressed TGF-β1-stimulated PAI-1 expression by ∼65−70% and ∼50−80% in Mv1Lu cells and BAECs, respectively. In NRK cells, cholesterol (50 μg/ml) suppressed TGF-β1-stimulated PAI-1 expression by ∼60% (data not shown).
Fig. 2.

Effects of cholesterol, LDL, statins, β-CD and nystatin on TGF-β1-induced PAI-1 expression in Mv1Lu cells (A,C,E,F,G,H) and BAECs (B,D). Cells were treated with increasing concentrations of cholesterol as indicated (A,B), 50 μg/ml cholesterol (C,D,E), 50 μg/ml LDL (E), β-CD (0.5%; H) or nystatin (25 μg/ml; H) at 37°C for 1 hour or with 1 μM fluvastatin or lovastatin (F,G) or with different concentrations of fluvastatin (G) at 37°C for 16 hours and then further incubated with increasing concentrations (as indicated) of TGF-β1 (C,D) or 50 pM TGF-β1 (A,B,E,G,H) for 2 hours. Northern blot analyses of PAI-1 and G3PDH were performed and a representative of a total of three analyses per experiment is shown (a). The relative amounts of the transcripts (PAI-1 and G3PDH) were quantified with a PhosphoImager. The ratio of the relative amounts of PAI-1 and G3PDH transcripts in cells treated without TGF-β1 and cholesterol, LDL or statins on the blot was taken as 1 fold or 100% of PAI-1 expression. The quantitative data from three independent analyses was shown (b). The data are mean ± s.d. *Significantly lower than that of control P<0.001.
The above results suggest that cholesterol suppresses TGF-β1-stimulated PAI-1 expression in these various cell types. To define the physiological relevance of the cholesterol effect, we examined the effect of LDL (a major cholesterol vehicle in blood), or fluvastatin or lovastatin (potent HMG-CoA reductase inhibitors commonly employed as cholesterol-lowering agents) (Alberts, 1988; Yuan et al., 1991) on PAI-1 expression in Mv1Lu cells stimulated by TGF-β1. Mv1Lu cells were pretreated with LDL (50 μg protein/ml) or cholesterol (50 μg/ml) at 37°C for 1 hour, or with fluvastatin or lovastatin (1 μM) at 37°C for 16 hours and then incubated with 50 pM TGF-β1 at 37°C for 2 hours. The PAI-1 expression in these TGF-β1-stimulated cells was determined by northern blot analysis using a PhosphoImager. At 1 μM, fluvastatin or lovastatin inhibited cholesterol synthesis by >90% as described previously (Negre-Aminou et al., 1997). As shown in Fig. 2E, LDL and cholesterol suppressed TGF-β1-induced PAI-1 expression by ∼50−60% in these cells (Fig. 2Ea,b). The LDL and cholesterol effects were abolished in the presence of 25 μg/ml nystatin (a cholesterol-sequestering compound; data not shown). Conversely, both fluvastatin and lovastatin enhanced PAI-1 expression stimulated with 50 pM TGF-β1 in Mv1Lu cells (Fig. 2Fa). Fluvastatin appeared to be more potent than lovastatin on a molar basis. Fluvastatin (1 μM) enhanced PAI-1 expression stimulated with 10 pM TGF-β1 by threefold whereas lovastatin (1 μM) had no effect (Fig. 2Fb). However, lovastatin was capable of enhancing PAI-1 expression stimulated with 50 pM TGF-β1 by approx. threefold in these cells (Fig. 2Fb). Fluvastatin enhanced PAI-1 expression stimulated by 50 pM TGF-β1 in a concentration-dependent manner (Fig. 2Ga) with an EC50 of ∼0.5 μM (Fig. 2Gb).
To further define the role of endogenous cholesterol in the modulation of TGF-β responsiveness, we determined the effects of cholesterol-depleting agents β-CD and nystatin (Wang et al., 1998; Subtil et al., 1999) on TGF-β-induced PAI-1 expression in Mv1Lu cells. As shown in Fig. 2Ha,b, nystatin (25 μg/ml) and β-CD (0.5%) enhanced TGF-β-induced PAI-1 expression by 1.8 fold and fourfold, respectively. The effect of cholesterol or lovastatin on TGF-β responsiveness was further characterized using Mv1Lu cells stably expressing a luciferase reporter driven by the PAI-1 gene promoter. As shown in Fig. 3, treatment of cells with 50 μg/ml cholesterol suppressed luciferase activity stimulated with 50 pM TGF-β1 by ∼40% (Fig. 3Aa), whereas 1 μM lovastatin enhanced the activity by ∼1.7 fold (Fig. 3Ab). The stimulatory effect of lovastatin was abolished by treatment of Mv1Lu cells with cholesterol (20 μg/ml) for 1 hour prior to TGF-β1 stimulation (Fig. 3Ab). Cholesterol (20 μg/ml) alone did not affect TGF-β1-stimulated luciferase activity under the experimental conditions used (Fig. 3Aa). These results suggest that the lovastatin effect is mainly mediated by its ability to inhibit cholesterol synthesis.
Fig. 3.

Effects of cholesterol and lovastatin on the TGF-β1-stimulated luciferase activity (A) and TGF-β1-induced growth inhibition (B) in Mv1Lu cells. (A) Cells stably expressing a luciferase reporter gene were treated with increasing concentrations (as indicated) of cholesterol at 37°C for 1 hour (a) or with 1 μM lovastatin at 37°C for 16 hours ± cholesterol (20 μg/ml) at 37°C for 1 hour (b) and then further incubated with 50 pM TGF-β1 for 6 hours. The luciferase activity of the cell lysates (20 μg protein) was determined and expressed as arbitrary units (A.U.). The luciferase activity in cells treated with TGF-β1 only was taken as 100% (a). The data was obtained from three or four independent analyses. *Significantly lower or higher than that in cells treated with TGF-β1 only: P<0.001. (B) Cells were incubated with 0.0625 and 0.125 pM TGF-β1 in the presence of increasing concentrations of cholesterol, as indicated. Cell growth was then determined by measurement of [3H-methyl]thymidine incorporation into cellular DNA. The [3H-methyl]thymidine incorporation in cells treated with vehicle only was taken as 100%. TGF-β1 at 0.0625 and 0.125 pM inhibited DNA synthesis by ∼30% and ∼40%, respectively. The degree (%) of cholesterol-mediated reversal of TGF-β1 growth inhibition was estimated by the equation: % reversal=[1–(T1–T2/T3–T4)]×100, where T1 is the thymidine incorporation in cells treated with cholesterol alone; T2, the thymidine incorporation in cells treated with cholesterol plus TGF-β1; T3, the thymidine incorporation in cells treated with vehicle only and T4, the thymidine incorporation in cells treated with TGF-β1 alone. The experiments were carried out in triplicate.
TGF-β-induced growth inhibition is reversed by cholesterol
Another prominent biological activity of TGF-β is growth inhibition of many different cell types (Massague, 1990; Heldin et al., 1997; Hocevor and Howe, 1998; Roberts, 1998; Moustakas et al., 2001; Huang and Huang, 2005). If cholesterol suppresses TGF-β responsiveness, it should antagonize TGF-β1 growth inhibitory activity which is also mediated by the Smad2/3 signaling pathway. To test this, Mv1Lu cells were treated with several concentrations (as indicated) of cholesterol at 37°C for 1 hour and then further incubated with 0.0625 or 0.125 pM TGF-β1 at 37°C for 18 hours. DNA synthesis was then determined by measurement of [methyl-3H]thymidine incorporation into cellular DNA (Fig. 3B). It is important to note that the optimal concentrations of TGF-β1 for growth inhibition are much lower than those for transcription activation. The former are in the range of 0.1 to 2 pM whereas the latter are in the range of 10 to 100 pM. TGF-β1 at 0.0625 and 0.125 pM inhibited DNA synthesis in Mv1Lu cells by ∼30% and ∼40%, respectively. Treatment with increasing concentrations of cholesterol correspondingly reversed DNA synthesis inhibition induced by TGF-β1 (Fig. 3B). Cholesterol (8 μg/ml) effectively reversed the inhibition of DNA synthesis induced by 0.0625 and 0.125 pM TGF-β1. Together with the results shown above, this result suggests that cholesterol is an effective TGF-β1 antagonist.
Cholesterol increases accumulation of TGF-β receptors in lipid rafts and caveolae, resulting in enhanced TGF-β-induced degradation
We previously showed that TGF-β responsiveness is determined by the localization of TβR-I and TβR-II in lipid raft and caveolae and non-lipid raft microdomains of the plasma membranes (Huang and Huang, 2005; Chen et al., 2006). To test the effect of cholesterol on the plasma microdomain localization of the TGF-β receptors, we analyzed the lipid raft, caveolae and non-lipid raft localization of TβR-I and TβR-II in the plasma membrane of untreated cells or cells treated with cholesterol (50 μg/ml), using sucrose density gradient ultracentrifugation analysis (Ito et al., 2004; Chen et al., 2006) and immunofluorescence microscopy. As shown in Fig. 4, TβR-I was mainly present in non-lipid raft fractions (fractions 7 and 8) whereas TβR-II was present in both the non-lipid raft and lipid raft-caveolae fractions (4 and 5), which contained transferrin receptor 1 (TfR-1) and caveolin-1, respectively. TfR-1 and caveolin-1 localization did not change with any of the treatment protocols. After treatment with cholesterol, TβR-I and TβR-II were found to be enriched in the lipid raft-caveolae fractions (4 and 5) of the plasma membrane in Mv1Lu cells compared to the same fractions before cholesterol treatment (Fig. 4, cholesterol versus control). Addition of TGF-β1 to the medium induced degradation of TβR-II associated with lipid rafts/caveolae (fractions 4 and 5), which contained ∼50% of the total TβR-II protein of plasma membranes in Mv1Lu cells (Fig. 4, TGF-β1 verses control). Pretreatment with cholesterol further enhanced TGF-β1-induced degradation of TβR-II in lipid rafts and caveolae (Fig. 4; fractions 4 and 5, cholesterol + TGF-β1 verses TGF-β1). After treatment with cholesterol, TβR-I was found to colocalize with caveolin-1 at the cell surface as determine by immunofluorescence confocal microscopy (Fig. 5j). Treatment with both cholesterol and TGF-β1 resulted in the colocalization of TβR-I and caveolin-1 in endocytic vesicles (Fig. 5l). In NRK cells, cholesterol treatment also increased lipid raft/caveolae accumulation of both TβR-I and TβR-II and facilitated TGF-β1-induced degradation of these receptors as determined by western blot analysis of the sucrose density gradient fractions using antibodies to TβR-I (ALK-5) and TβR-II and (data not shown). These results suggest that cholesterol treatment enhances TGF-β-induced and lipid raft/caveolae-mediated internalization and degradation of TGF-β receptors.
Fig. 4.

Sucrose density gradient analysis of TβR-II in the plasma membrane of Mv1Lu cells treated with or without cholesterol and stimulated with and without TGF-β1. Cells were treated with or without 50 μg/ml cholesterol at 37°C for 1 hour and further incubated with and without 50 pM TGF-β1 for 2 hours. The cell lysates from these treated cells were subjected to sucrose density gradient ultracentrifugation. The sucrose gradient fractions were then analyzed by western blot analysis using anti-TβR-I, anti-TβR-II, anti-TfR-1 and anti-caveolin-1 antibodies. The arrow indicates the locations of TβR-I, TβR-II, caveolin-1 and TfR-1. Fractions 4 and 5 contained lipid rafts/caveolae whereas fractions 7 and 8 are non-lipid raft fractions. Treatment with cholesterol alone did not affect the total amounts of TGF-β receptor proteins and cell proteins. Open arrowheads indicate the increased amount of TβR-I or TβR-II in the fraction as compared with that of untreated control. *The decreased amount of TβR-II in the fraction as compared with that of untreated control. #The decreased amount of TβR-II in the fraction as compared with that of treatment with cholesterol or TGF-β1 alone.
Fig. 5.

Immunofluorescent localization of TβR-I and caveolin-1 in Mv1Lu cells treated with and without cholesterol and TGF-β1. Cells were treated with or without 50 μg/ml cholesterol at 37°C for 1 hour and incubated with and without 100 pM TGF-β1 at 37°C for 30 minutes. The cells were then fixed with cold methanol and incubated with a goat antibody to TβR-I (e-h) and rabbit antibody to caveolin-1 (a-d) followed by incubation with Rhodamine-conjugated donkey anti-goat antibody or FITC-conjugated mouse anti-rabbit antibody. The fluorescence in cells was examined using a fluorescent confocal microscope. Bar, 20 μm. The arrows indicate colocalization of TβR-I and caveolin-1 at the cell surface (j).
Cholesterol and LDL appeared to enhance TGF-β1-induced degradation of TβR-II in a concentration-dependent manner (Fig. 6Aa and Fig. 6Ba, respectively). Cholesterol (10 μg/ml) and LDL (15 μg protein/ml) enhanced TGF-β1-induced degradation of TβR-II by ∼70% (Fig. 6Ab and Fig. 6Bb, respectively). Treatment with cholesterol or LDL alone did not induce TβR-II degradation (Fig. 6Ab,Bb). The cholesterol-enhanced TGF-β1-induced degradation of TβR-II was abolished by incubation of cells with 1% β-CD prior to TGF-β1 stimulation (Fig. 6Ab). Cholesterol-depleting agents (e.g. nystatin) have been shown to inhibit lipid-raft-mediated degradation of receptor-bound TGF-β (Le Roy and Wrana, 2005; Chen et al., 2006). These results suggest that cholesterol or LDL treatment increases lipid raft/caveolae accumulation and TGF-β1-induced degradation of TβR-II and that the cholesterol effect is reversible.
Fig. 6.

Concentration dependence of cholesterol (A) or LDL (B) in enhancing TGF-β1-induced degradation of TβR-II in Mv1Lu cells. Cells were treated with several concentrations of cholesterol (A) or LDL (B), as indicated, at 37°C for 1 hour, then incubated with and without 1% β-CD at 37°C for 1 hour and further incubated with 50 pM TGF-β for 2 hours. The cell lysates were then subjected to western blot analysis using anti-TβR-II and anti-α-actin antibodies (a) and quantification by densitometry (b). The ratio of the relative amounts of TβR-II and α-actin in cells treated without TGF-β1 was taken as the 100% level of TβR-II. The data are representative of a total of three independent analyses; values are mean ± s.d. *Significantly lower than control cells: P<0.001.
Statins increase accumulation of TGF-β receptors in non-lipid raft microdomains, resulting in attenuated TGF-β-induced degradation
To define the role of endogenous cholesterol in determining the localization of TβR-II in plasma membrane microdomains, Mv1Lu cells were treated with lovastatin (1 μM), fluvastatin (1 μM) or nystatin (25 μg/ml) and cholesterol (50 μg/ml) at 37°C for 16 hours or 1 hour, respectively. The plasma membrane microdomain localization of TβR-II was determined by sucrose density gradient ultracentrifugation followed by western blot analysis. As shown in Fig. 7A, treatment with lovastatin, fluvastatin or nystatin increased accumulation of TβR-II in non-lipid raft microdomains (fraction 7 or 8). The fluvastatin-induced increased accumulation of TβR-II in non-lipid raft microdomains appeared to attenuate degradation of TβR-II induced by TGF-β1 (Fig. 6B, bottom). It is important to note that treatment of Mv1Lu cells with fluvastatin at 37°C for 16 hours increases the total amount of TβR-II protein by approx. twofold when compared with those of cholesterol-treated and control cells (Fig. 7A,B, top). This could be due to decreased degradation and/or increased biosynthesis of TβR-II in cells treated with fluvastatin. Taken together with the results shown in Fig. 2F,G, these results suggest that treatment of cells with the statins increases accumulation of TβR-II in non-lipid raft microdomains and presumably increases endosomal signaling (Di Guglielmo et al., 2003; Chen et al., 2006), resulting in enhanced TGF-β responsiveness.
Fig. 7.

Effects of the treatments with lovastatin, fluvastatin and nystatin on the plasma-membrane microdomain localization (A) and TGF-β1-induced degradation of TβR-II (B) in Mv1Lu cells. Cells were treated with or without lovastatin (1 μM), fluvastatin (1 μM) or nystatin (25 μg/ml) at 37°C for 16 hours or 1 hour, respectively. The treated cells were directly analyzed by sucrose density gradient ultracentrifugation analysis (A) or further incubated with 50 pM TGF-β at 37°C for several time periods as indicated (B). Western blot analyses of the sucrose density gradient fractions (A) and of TGF-β1-treated cell lysates (B) were performed using anti-TβR-II, anti-caveolin-1, anti-TfR-1 and anti-α-actin antibodies. The open arrowheads indicate the increased amount of TβR-II in the fraction as compared with that of the untreated control. The data are representative of a total of three independent analyses; values are mean ± s.d. *Significantly higher than that in cells treated without fluvastatin: P<0.05.
A low ratio of TGF-β binding to TβR-II and TβR-I and a low level of P-Smad2 occur in aortic endothelium of ApoE-null mice fed a high-cholesterol diet and in BAECs
We previously demonstrated that the ratio of TGF-β1 binding to TβR-II and TβR-I (as determined by 125I-TGF-β1 affinity labeling) can be used as an indicator of TGF-β responsiveness (Huang and Huang, 2005; Chen et al., 2006). The magnitude of the cellular responsiveness induced by TGF-β positively correlates with the ratio of TGF-β binding to TβR-II and TβR-I in the same cell type (Chen et al., 2006). To define the physiological relevance of the in vitro effect of cholesterol, we performed 125I-TGF-β1 affinity labeling and determined TGF-β responsiveness in the aortic endothelium of wild-type mice and ApoE-null mice fed a high-cholesterol (2%) or normal diet. ApoE-null mice fed a high-cholesterol diet exhibited typical atherosclerotic lesions (such as fatty streaks and plaques) in the aorta. For 125I-TGF-β1 affinity labeling, the aortas were cut lengthwise to expose the intimal endothelium to 125I-TGF-β1 in binding buffer. After 2.5 hours at 0°C, aortas were washed with phosphate-buffered saline (PBS) several times and cross-linked with disuccinimidyl suberate (DSS); the 125I-TGF-β1 affinity-labeled aortic endothelium was scrapped off from the luminal surface of the aorta and extracted with 1% Triton X-100. The extracts, which contained factor VIII (an endothelial cell marker), were then analyzed by 7.5% SDS-PAGE and autoradiography. As shown in Fig. 8A, the aortic endothelium from wild-type mice exhibited a higher ratio (>1) of 125I-TGF-β1 binding to TβR-II and TβR-I (Fig. 8Aa, top, lane 1 and Fig. 8Aa, bottom). However, the aortic endothelium from atherosclerotic mice (ApoE-null mice fed a high-cholesterol diet) exhibited a low ratio (<1) of 125I-TGF-β1 binding to TβR-II and TβR-I (Fig. 8Aa, top, lane 2 and Fig. 8Aa, bottom). A low ratio of 125I-TGF-β1 binding to TβR-II and TβR-I was also found in cultured BAECs treated with cholesterol (50 μg/ml) as compared with that found in untreated cells (Fig. 8Ab, top, lane 2 versus lane 1 and bottom). It is important to note that cholesterol treatment resulted in increased 125I-TGF-β1 binding to TβR-I and decreased 125I-TGF-β1 binding to TβR-II in BAECs (Fig. 8Ab).
Fig. 8.
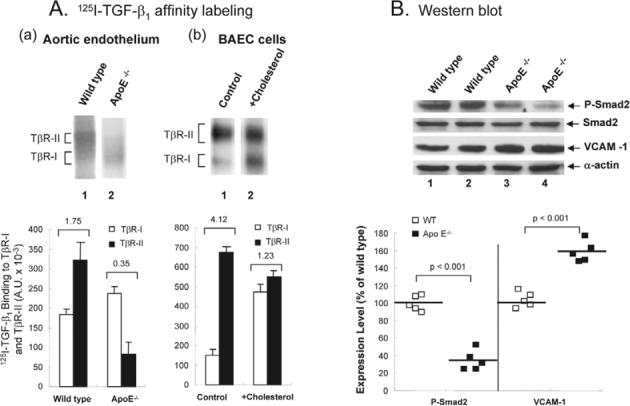
A lower ratio of 125I-TGF-β1 binding to TβR-II and TβR-I (A) and suppressed TGF-β responsiveness (B) in the aortic endothelium of ApoE-null mice fed a high-cholesterol diet and in cultured BAECs treated with cholesterol. (A) 125I-TGF-β affinity labeling. (a) The aortic endothelium from wild-type and ApoE-null (ApoE−/−) mice fed a high-cholesterol diet (lanes 1 and 2, respectively) and BAECs treated with and without 50 μg/ml cholesterol at 37°C for 1 hour, were affinity-labeled with 125I-TGF-β1, extracted with 1% Triton X-100, analyzed by 7.5% SDS-PAGE and autoradiography (top), and quantified using a PhosphoImager (bottom). A representative of a total of five animals each analyzed or of three independent BAEC analyses is shown. The number on the top of the bar charts is the estimated ratio of 125I-TGF-β1 binding to TβR-II and TβR-I. (B) Western blot analysis. The aortic endothelium from wild-type (top, lanes 1 and 2) and ApoE-null mice (ApoE−/−) (top, lanes 3 and 4) mice fed a high-cholesterol diet were extracted with 1% Triton X-100. Equal protein amounts (∼100 μg) of the Triton X-100 extracts were then subjected to western blot analysis using antibodies to Smad2, P-Smad2, VCAM-1 and α-actin (top). Two representatives (lanes 1 and 2, and 3 and 4) of a total of five animals each analyzed are shown (top). The relative levels of P-Smad2 (P-Smad2/Smad2) and VCAM-1 (VCAM-1/α-actin) were estimated (bottom). Statistical comparisons between groups were made by use of the Mann-Whitney test (bottom). Data represent median (interquartile). *P<0.001 versus wild-type mice.
To examine TGF-β responsiveness, the levels of P-Smad2 and VCAM-1 in the Triton X-100 extracts of the aortic endothelium from wild-type and atherosclerotic mice were examined by western blot analysis following 7.5% SDS-PAGE. The level of P-Smad2 has been used as an indicator for TGF-β responsiveness (Smad2/3 dependent) in aortas and other tissues (Phipps et al., 2004; Liao and Laufs, 2005). The upregulation of VCAM-1 has been employed as a marker for early atherosclerotic lesions (Nakashima et al., 1998). As shown in Fig. 8B, ApoE-null mice fed a high cholesterol diet exhibited higher expression (∼1.6 fold) of VCAM-1 than that found in wild-type mice (top, lanes 3 and 4 versus lanes 1 and 2, and bottom). The levels of P-Smad2 were lower in atherosclerotic mice than those in wild-type mice fed a high-cholesterol diet (top, lanes 3 and 4 versus lanes 1 and 2). The levels of P-Smad2 in atherosclerotic mice were estimated to be ∼40% of those found in wild-type mice (Fig. 8B, bottom). The endothelium of the coronary artery from wild-type mice appeared to be plaque free (Fig. 9A), whereas an advanced plaque was observed in ApoE-null mice fed a high cholesterol diet (Fig. 9B). P-Smad2 was not detected by immunofluorescence microscopy in the endothelium of the coronary artery from Apo-E-null mice fed a high cholesterol diet (Fig. 9D). By contrast, P-Smad2 was found to be present in the endothelium of the coronary artery from wild-type mice (Fig. 9C). These results suggest that the aortic endothelium of atherosclerotic mice has the characteristics of a low ratio of TGF-β1 binding to TβR-II and TβR-I and suppressed TGF-β responsiveness, like those observed in cultured BAECs treated with cholesterol. Interestingly, vascular smooth muscle cells derived from atherosclerotic plaques have also been shown to exhibit a low ratio (<1) of TGF-β1 binding to TβRII and TβR-I and suppressed TGF-β responsiveness (McCaffrey et al., 1997). The ratio of TGF-β1 binding to TβR-II and TβR-I in vascular smooth muscle cells from normal humans is >1 (McCaffrey et al., 1997). Vascular cells in atherosclerotic mice and humans appear to have a low ratio of TGF-β1 binding to TβR-II and TβR-I and suppressed TGF-β responsiveness. This suggests that hypercholesterolemia may contribute to atherosclerosis via suppression of TGF-β responsiveness.
Fig. 9.
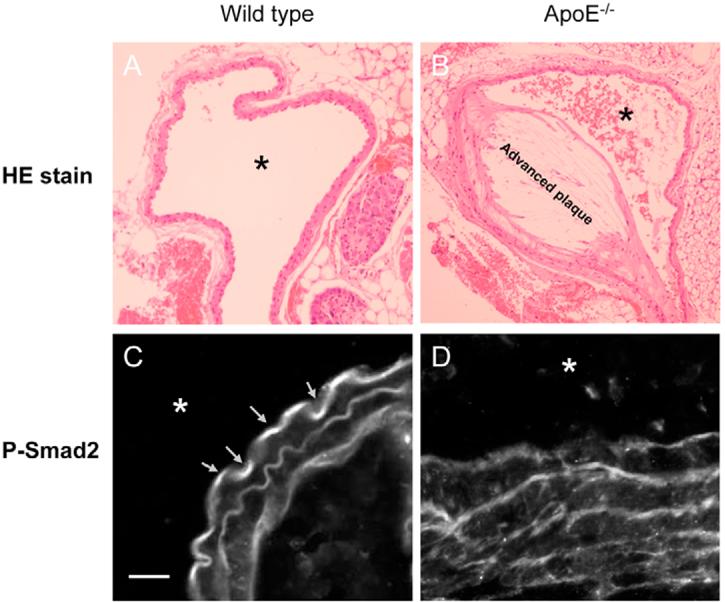
Immunofluorescent localization of P-Smad2 in the coronary artery from wild-type and ApoE-null mice fed a high cholesterol diet. (A,B) Representative photographs of the coronary artery from wild-type (A) mice exhibited a plaque-free section; that from ApoE-null mice fed a high cholesterol diet (B) showed an advanced plaque. (C,D) Immunofluorescent confocal microscopic analysis of the tissue cross sections revealed that P-Smad2 is present in wild-type mice (C) whereas no P-Smad2 was detected in the endothelium of the coronary artery from ApoE-null mice fed a high cholesterol diet (D). *The location of the artery lumen. The magnification is 200× (A and B); bar, 20 μm (C,D). The arrows in C indicate the localization of P-Smad2 in the artery endothelium.
Discussion
Several lines of evidence presented herein indicate that cholesterol is an effective TGF-β1 antagonist capable of suppressing TGF-β responsiveness (Smad2/3 dependent) in various cell types: (1) cholesterol treatment suppresses TGF-β1-induced signaling, such as Smad2 phosphorylation and nuclear translocation; (2) cholesterol treatment antagonizes TGF-β1-induced PAI-1 expression in Mv1Lu, BAE and NRK cells; (3) cholesterol treatment suppresses the luciferase activity in TGF-β1-stimulated Mv1Lu cells expressing a luciferase reporter gene driven by the PAI-1 promoter; (4) cholesterol treatment reverses TGF-β-induced growth inhibition in Mv1Lu cells; and (5) the effect of cholesterol on TGF-β responsiveness is rapid, reversible and specific. The effect reaches maximum after incubation of cells with cholesterol at 37°C for 30 minutes (unpublished results). The cholesterol effect can be reversed by incubation of cells with 1% β-CD prior to TGF-β1 stimulation. The cholesterol effect is also specific. Cholesterol effectively suppresses TGF-β responsiveness whereas related oxysterol derivatives (including 25-hydroxycholesterol, 7-dehydrocholesterol, cholest-5-one-7-one, 7-ketocholesterol, 7β,8β-epoxycholesterol and 7β-hydroxycholesterol) do not show such activity (unpublished results). However, cholesterol is different from conventional TGF-β antagonists. Cholesterol does not bind to TGF-β or compete with TGF-β for binding to TGF-β receptors under the experimental conditions (unpublished results).
Di Guglielmo et al. (Di Guglielmo et al., 2003) and Chen et al. (Chen et al., 2006) demonstrated that TGF-β responsiveness is determined by TGF-β partitioning between lipid raft/caveolae-mediated and clathrin-mediated endocytosis. Lipid-raft/caveolae-mediated endocytosis facilitates TGF-β degradation and thus suppresses TGF-β responsiveness. Clathrin-mediated endocytosis results in Smad2/3-dependent endosomal signaling, promoting TGF-β responsiveness. Based on the dominance model for the signal that controls TGF-β partitioning between the two distinct endocytosis pathways (Huang et al., 2005; Chen et al., 2006), we hypothesize that two major TβR-I-TβR-II complexes, Complex I and Complex II, are present in the non-lipid raft and lipid raft/caveolae microdomains of the plasma membrane, respectively (Fig. 10). TβR-I and TβR-II have affinity for each other and form complexes in the absence of ligand (Chen et al., 1997). Complex I contains more TβR-II than TβR-I whereas Complex II contains more TβR-I than TβR-II (Chen et al., 2006). The ratio of TβR-II and TβR-I in the complexes can be determined by 125I-TGF-β1 affinity labeling (Chen et al., 2006). In the presence of TGF-β, Complex I undergoes clathrin-mediated endocytosis, resulting in promotion of Smad2/3-dependent signaling and cellular responsiveness. Complex II undergoes lipid raft/caveolae-mediated endocytosis, resulting in enhanced TGF-β-induced degradation and less cellular responsiveness. Complex II may also be capable of mediating Smad2/3-independent signaling, which leads to different cellular responsiveness in fibroblasts (Pannu et al., 2007). In this study, we demonstrate that cholesterol treatment increases accumulation of TβR-I and TβR-II (as Complex II) to lipid rafts/caveolae, resulting in enhanced TGF-β degradation and attenuated TGF-β responsiveness (Fig. 10). Depletion of cholesterol from the plasma membrane by cholesterol-lowering agents (statins) or cholesterol-depleting agents (β-CD and nystatin) leads to decreased formation of or destabilization of lipid rafts/caveolae, thereby increasing localization of TβR-I and TβR-II (as Complex I) in non-lipid raft microdomains and promotion of TGF-β-induced endosomal signaling and responsiveness (Fig. 10). The cholesterol effect on the lipid raft/caveolae localization of TβR-I and TβR-II appears to be specific as compared with other TGF-β receptor types. Treatments with cholesterol and TGF-β1, alone or together, do not influence the plasma membrane microdomain localization of TβR-III and TβR-V (unpublished results), which was recently identified as low density lipoprotein receptor-related protein-1 (Huang et al., 2003). Both TβR-III and TβR-V are mainly localized in non-lipid raft microdomains of the plasma membrane.
Fig. 10.

A model for the cholesterol effect on TGF-β partitioning between lipid rafts/caveolae- and clathrin-mediated endocytosis. In cells, there are two major TβR-I–TβR-II complexes (Complex I and Complex II) present on the cell face. Complex I and Complex II are mainly localized in the non-lipid raft and lipid raft/caveolae microdomains of the plasma membrane, respectively. The numbers of TβR-I and TβR-II molecules (blue rectangles) in Complex I and Complex II shown in the model are arbitrary and intended to indicate that Complex I and Complex II contain TβR-II>TβR-I and TβR-I>TβR-II, respectively. The ratio of TβR-II to TβR-I can be determined by 125I-TGF-β1 affinity labeling (Chen et al., 2006). Cholesterol increases the formation and/or stabilization of lipid rafts/caveolae by integration into the plasma membrane, thereby increasing the localization of TβR-I and TβR-II in lipid rafts/caveolae (as Complex II), facilitating rapid degradation of TGF-β and attenuating TGF-β responsiveness (Smad dependent). Complex II may also be capable of mediating Smad2/3-indepentent signaling which leads to different cellular responsiveness such as fibrogenesis in fibroblasts (Pannu et al., 2007). Depletion of cholesterol in the plasma membrane, by treating cells with cholesterol-lowering agents (e.g. statins) or cholesterol-depleting agents (e.g. β-CD), facilitates the localization of TβR-I and TβR-II in non-lipid raft microdomains. In the presence of ligand, Complex I undergoes clathrin-mediated endocytosis, promoting Smad2/3-dependent endosomal signaling and TGF-β responsiveness. In hypercholesterolemic mice, cell-surface TGF-β receptor complexes in the aortic endothelium contain more Complex II than Complex I. In normal mice, cell-surface TGF-β receptor complexes contain more Complex I than Complex II in the aortic endothelium.
In this communication, we also demonstrate that, similar to treatment with free cholesterol, treatment with LDL and VLDL causes suppression of TGF-β responsiveness (Smad2/3 dependent). This effect of LDL or VLDL can be abolished in the presence of cholesterol-binding compounds (e.g. β-CD and nystatin), suggesting that it is mediated specifically by cholesterol, rather than by some other lipoprotein constituents. However, treatment with lovastatin and fluvastatin increases accumulation of TGF-β receptors to non-lipid raft microdomains and attenuates TGF-β-induced degradation of the TGF-β receptors, resulting in enhanced TGF-β responsiveness. The abilities of LDL, VLDL and statins (lovastatin and fluvastatin) to suppress and enhance TGF-β responsiveness, respectively, in cultured cells may be correlated with their capacities to cause and prevent atherosclerosis in human patients, respectively.
The finding that cholesterol is a TGF-β antagonist for Smad-dependent cellular responsiveness not only provides one molecular mechanism by which hypercholesterolemia contributes to atherosclerosis, but also suggests explanations for many questions regarding diseases associated with hypercholesterolemia and pleiotropic effects of statins (Buchwald, 1992; Liao and Laufs, 2005; Jacobs et al., 2006). For example, why do patients with hypercholesterolemia tend to develop cancer? Since cholesterol is a TGF-β antagonist, hypercholesterolemia may suppress TGF-β growth inhibitory activity in targeted epithelial cells, contributing to carcinogenesis. Why does statin therapy prevent or reduce the incidence of cancer occurrence? Cholesterol reduction afforded by statin therapy (Liao and Laufs, 2005) may enhance the activity of TGF-β, a known tumor suppressor (Wang et al., 1995; Piek and Roberts, 2001; Derynck et al., 2001). Statins have been reported to exhibit pleiotropic effects not thought to be mediated by their cholesterol-lowering actions (Liao and Laufs, 2005). It is possible that some of these activities are mediated by their abilities to decrease cholesterol content in the plasma membrane, affecting the structure and function of lipid rafts/caveolae, which are known to modulate signaling mediated by G protein-coupled receptors, receptor tyrosine kinases, TGF-β receptors (TβR-I and TβR-II) and possibly others (Galbiati et al., 2001; Simons and Toomre, 2000; Di Guglielmo et al., 2003; Gomez-Mouton et al., 2004; Le Roy and Wrana, 2005; Huang and Huang, 2005; Chen et al., 2006). The finding that cholesterol contributes to atherosclerosis by suppressing TGF-β responsiveness in vascular cells may lead to the development of novel therapies for treating or preventing atherosclerosis. We suspect that patients with normal levels of cholesterol who receive high-dose statin therapy but still develop atherosclerosis (Brown and Goldstein, 2006) may have suppressed TGF-β responsiveness in vascular cells (due to an unidentified mechanism) and/or low-level TGF-β activity in blood, both of which contribute to the development of atherosclerotic cardiovascular disease. Thus, therapeutic agents that enhance endogenous TGF-β activity in blood and/or TGF-β responsiveness in vessel-wall cells could provide a novel strategy to treat or prevent atherosclerosis.
Materials and Methods
Materials
Na125I (17 Ci/mg) and [methyl-3H]thymidine (67 Ci/mmol) were purchased from ICN Radiochemicals (Irvine, CA, USA). High molecular mass protein standards (myosin, 205 kDa; β-galactosidase, 116 kDa; phosphorylase, 97 kDa; bovine serum albumin, 66 kDa), cholesterol (>99% pure), DAPI, chloramine-T, bovine serum albumin (BSA), human low density lipoprotein (LDL; which was composed of ∼20−25% protein and 75−80% lipid including 9% free cholesterol, 42% cholesterol ester, 20−24% phospholipids and 5% triglycerides), human very low density lipoprotein (VLDL), human high density lipoprotein (HDL), fluvastatin, lovastatin, cholesterol, disuccinimidyl suberate (DSS), nystatin and β-cyclodextrin (β-CD) were obtained from Sigma (St Louis, MO). Cholesterol did not undergo detectable oxidation under the experimental conditions. Like cholesterol, LDL and VLDL (but not HDL) suppressed TGF-β responsiveness. However, cholesterol was mainly used in the experiments in order to exclude the possibility that other lipid and protein components in the lipoproteins might influence the assays employed. P-Smad2 antibody was obtained from Cell Signaling Technology, Inc. (Danvers, MA). TGF-β1 was purchased from Austral Biologicals (San Ramon, CA). Rabbit polyclonal antibodies to caveolin-1, Smad2, α-actin, TβR-I (ALK-5) and TβR-II were obtained from Santa Cruz Biotechnology, Inc. (Santa Cruz, CA). Rabbit polyclonal antibodies to TfR-1 and VCAM-1 were obtained from Zymed Laboratories (San Francisco, CA) and Chemicon International, Inc. (Temecula, CA), respectively. The luciferase assay system was obtained from Promega (Madison, WI).
Cell culture
Mv1Lu cells, MLECs-clone 32 cells (which are Mv1Lu cells stably expressing the luciferase reporter gene driven by the PAI-1 promoter) (Abe et al., 1994), BAECs and NRK cells were maintained in DMEM or DMEM-F12 containing 10% fetal calf serum with or without bFGF.
Western blot analysis of cultured cells
Cells grown to near confluence on 12-well dishes were treated with cholesterol, vehicle (ethanol), or LDL in serum-free DMEM (0.5 ml/well) at 37°C for 1 hour. The final concentration of ethanol in the medium was 0.2%. Serum-free DMEM was used to avoid the potential influence of serum components in the assay systems. The effect on TGF-β responsiveness reached maximum after treatment of cells with cholesterol or LDL at 37°C for 30 minutes but the treatment (at 37°C for 1 hour) of cells with cholesterol or lipoproteins was used throughout the experiments. The treated cells were further incubated with 50 or 100 pM TGF-β1 at 37°C for 30 minutes (for determining Smad2 phosphorylation) or for 2 hours (for determining TβR-II). Treated cells were lysed and cell lysates with equal amounts of protein were analyzed by 7.5% SDS-PAGE and western blotting using anti-Smad2, anti-P-Smad2, anti-α-actin, anti-caveolin-1 anti-TβR-I or anti-TβR-II antibodies, as described previously (Huang et al., 2003). The antigens on the blots were visualized by using horseradish peroxidase-conjugated anti-rabbit IgG antibody and the ECL system as described (Huang et al., 2003). The relative intensities of antigen bands on X-ray films were quantified by densitometry.
Northern blot analysis
Cells grown to confluence on 12-well dishes in DMEM containing 10% fetal calf serum were treated with several concentrations of cholesterol in ethanol in serum-free DMEM (0.5 ml/well) at 37°C for 1 hour. The final concentration of ethanol in the medium was 0.2%. The cholesterol-treated cells were then incubated with 100 pM TGF-β1 at 37°C for 2 hours. The transcripts of PAI-1 and G3PDH (as control) in the cell lysates were examined by northern blot analysis and quantified with a PhosphoImager which yields a linearity from 9,000 to 100,000 arbitrary units of the transcript intensity.
[Methyl-3H]thymidine incorporation
The growth of cholesterol-treated cells was determined by measurement of [methyl-3H]thymidine incorporation into cellular DNA as described previously (Huang et al., 2003). Briefly, cells grown to near confluence on 48-well dishes were treated with several concentrations of cholesterol at 37°C for 1 hour in serum-free DMEM. The final concentration of ethanol (the solvent vehicle for cholesterol) in the medium was 0.2%. Treated cells were then incubated with 0.0625 pM or 0.125 pM of TGF-β1 in DMEM containing 0.1% fetal calf serum at 37°C for 18 hours. The [methyl-3H]thymidine incorporation into cellular DNA was then determined by incubation of cells with [methyl-3H]thymidine at 37°C for 2 hours in DMEM containing 0.1% fetal calf serum. The optimal concentrations of TGF-β1 to inhibit cell growth are in the range of 0.1 to 2 pM. Under the experimental conditions, cholesterol did not affect cell viability.
Luciferase activity assay and indirect immunofluorescent staining
Mv1Lu cells stably expressing the luciferase reporter gene driven by the PAI-1 promoter (MLECs – Clone 32) (Abe et al., 1994) grown to near confluence on 12-well dishes were treated with different concentrations of cholesterol, with and without 50 μg/ml cholesterol or with 1 μM lovastatin at 37°C for 1 hour or 16 hours, respectively. Treated cells were further incubated with 50 pM TGF-β1 at 37°C for 6 hours and lysed in 100 μl of lyses buffer (Promega). The cell lysates (∼20 μg protein) were then assayed using the luciferase kit from Promega. For indirect immunofluorescent staining, cells grown on cover glasses were treated with cholesterol (50 μg/ml) or with solvent vehicle at 37°C for 1 hour, stimulated with 50 pM TGF-β1 at 37°C for 30 minutes, fixed in cold 100% methanol and then incubated with antibody to P-Smad2 overnight. The antigen was visualized by incubation with Rhodamine-conjugated goat antibody to rabbit IgG followed by immunofluorescence microscopy. Cell nuclei were stained by DAPI staining. Cells with P-Smad2 nuclear localization were counted. The experiment was performed in triplicate.
Immunofluorescent confocal microscopy
Mv1Lu cells grown on coverslips overnight (50% confluency) were pretreated with 50 μg/ml cholesterol at 37°C for 1 hour and than incubated with 100 pM TGF-β1 for 30 minutes. After TGF-β1 stimulation, cells were fixed in methanol at −20°C for 15 minutes, washed with PBS and then blocked by 0.2% gelatin in PBS for 1 hour. Cells were incubated overnight at 4°C in a humidified chamber with a goat antibody against TβR-I (G-16; Santa Cruz Biotechnology) and rabbit antibody against caveolin-1 (BD Transduction Laboratories) at 1:100 dilution. After extensive washing, cells were incubated with Rhodamine-conjugated donkey anti-goat antibody and FITC-conjugated mouse anti-rabbit antibody at a 1:50 dilution for 1 hour. Images were acquired using a Leica TCS SP confocal microscope (Leica Microsystems Ltd., Heidelberg, Germany). The measurements of colocalization rate were analyzed using a Leica Application Suite.
Separation of lipid raft and non-lipid raft microdomains of plasma membranes by sucrose density gradient ultracentrifugation
Mv1Lu or NRK cells were grown to near confluence in 100 mm dishes (5−10×106 cells per dish). Cells were incubated with cholesterol (50 μg/ml) at 37°C for 1 hour and then incubated with TGF-β1 (100 pM) for 1 hour. After two washes with ice-cold phosphate-buffered saline, cells were scraped into 0.85 ml of 500 mM sodium carbonate, pH 11.0. Homogenization was carried out with 10 strokes of a tight-fitting Dounce homogenizer followed by three 20-second bursts of an ultrasonic disintegrator (Soniprep 150; Fisher Scientific) to disrupt cell membranes, as described previously (Ito et al., 2004; Chen et al., 2006). The homogenates were adjusted to 45% sucrose by addition of 0.85 ml of 90% sucrose in 25 mM 2-(N-morpholino) ethanesulfonic acid, pH 6.5, 0.15 M NaCl (MBS), and placed at the bottom of an ultracentrifuge tube. A discontinuous sucrose gradient was generated by overlaying 1.7 ml of 35% sucrose and 1.7 ml of 5% sucrose in MBS on the top of the 45% sucrose solution and it was then centrifuged at 200,000 g for 16−20 hours in an SW55 TI rotor (Beckman Instruments, Palo Alto, CA, USA). A light-scattering band was observed at the 5 and 35% sucrose interface. Ten 0.5-ml fractions were collected from the top of the tube, and a portion of each fraction was analyzed by SDS-PAGE followed by western blot analysis using antibodies to TβR-I (ALK-5), TβR-II, TfR-1 and caveolin-1. The relative amounts of TβR-I, TβR-II, TfR-1 and caveolin-1 on the blot were quantified by densitometry. The protein recovery and caveolin-1 and TfR-1 localization (fractions 4 and 5, and 7 and 8, respectively) did not significantly change with any of the treatment protocols.
125I-TGF-β1 affinity labeling and the determination of P-Smad2 and VCAM-1 levels in aortic endothelium from ApoE-null and wild-type mice
Female ApoE-null and wild-type mice (C57BL/6 background; 6- to 8-weeks old) were fed a high cholesterol (2%) or normal diet for 4−5 weeks. ApoE-null mice fed a high-cholesterol diet exhibited typical atherosclerotic lesions (such as fatty streaks and plaques) in the aorta as described previously (Palinski et al., 1994). By contrast, ApoE-null mice fed a normal diet, and wild-type mice fed either a high-cholesterol diet or a normal diet, did not have significant atherosclerotic lesions in the aortas in the experimental period. The aortas (∼2 cm) removed from the animals were cut lengthwise to expose intimal endothelium to binding buffer (1 ml) containing 100 pM 125I-TGF-β1 (Huang et al., 2003). After 2.5 hours on ice, 125I-TGF-β1 affinity labeling was performed using DSS, as described previously (Huang et al., 2003; Chen et al., 2006). The aortas were then washed with binding buffer. The aortic endothelia were then scraped off using a razor and extracted with 1% Triton X-100 in the binding buffer. The Triton X-100 extracts with equal amounts of protein were analyzed by 7.5% SDS-PAGE and autoradiography. The Triton X-100 extracts were found to contain factor VIII, an endothelial cell marker (based on western blot analysis). To determine the relative amounts of P-Smad2, Smad2, VCAM-1 and α-actin, the aortic endothelia from ApoE-null and wild-type mice were extracted with 1% Triton X-100 in the binding buffer. The Triton X-100 extracts, with equal amounts of protein, were subjected to 7.5% SDS-PAGE followed by western blot analysis using antibodies to P-Smad2, Smad2 and VCAM-1/α-actin. The relative amounts of P-Smad2, Smad2, VCAM-1 and α-actin were quantified by densitometry as described above.
Immunofluorescent localization of P-Smad2 in coronary arteries
Tissues cross sections (5 μm thick) were stained with Hematoxylin and Eosin (H&E). The tissue sections were subjected to immunostaining with rabbit anti-P-Smad2 antibody after deparaffinization and antigen retrieval by heating in a microwave. The tissue slides were first blocked with 5% BSA and immunostained with anti-P-Smad2 antibody (1:100 dilution) overnight and detected with FITC-conjugated goat anti-rabbit antibody (1:300 dilution) at room temperature for 1 hour. The tissue slides were viewed using a fluorescent confocal microscopy and photographed.
Statistical analysis
The values (except in Fig. 8B) are presented as mean ± s.d. Two-tailed unpaired Student's t-test was used to determine the significance of differences between groups. P<0.05 was considered significant. Comparisons between the two groups in Fig. 7B was conducted with the Mann-Whitney test.
Acknowledgments
We thank Daniel B. Rafkin for providing Mv1Lu cells expressing the PAI-1 promoter-driven luciferase, Tomasz Heyduk for immunofluorescent confocal microscopy, and William S. Sly, Abdul Waheed and Frank E. Johnson for critical review of the manuscript, and John McAlpin for typing the manuscript. This work was supported by U.S.P.H.S. (National Institutes of Health) grants CA38808 (J.S.H.), AR052578 (S.S.H.) and EY07361 (S.J.F.), by an unrestricted departmental grant from Research to Prevent Blindness (S.J.F.), and by the Norman J. Stupp Charitable Trust (S.J.F.).
References
- Abe M, Harpel JG, Metz CN, Nunes I, Loskutoff DJ, Rifkin DB. An essay for transforming growth factor-β using cells transfected with a plasminogen activator inhibitor-1 promoter-luciferase construct. Anal. Biochem. 1994;216:276–284. doi: 10.1006/abio.1994.1042. [DOI] [PubMed] [Google Scholar]
- Alberts AW. Discovery, biochemistry and biology of lovastatin. Am. J. Cardiol. 1988;62:11. doi: 10.1016/0002-9149(88)90002-1. [DOI] [PubMed] [Google Scholar]
- Bickel PE. Lipid rafts and insulin signaling. Am. J. Physiol. Endocrinol. Metab. 2002;282:E1–E10. doi: 10.1152/ajpendo.2002.282.1.E1. [DOI] [PubMed] [Google Scholar]
- Brown MS, Goldstein JL. Lowering LDL – not only how low, but how long? Science. 2006;311:1721–1723. doi: 10.1126/science.1125884. [DOI] [PubMed] [Google Scholar]
- Buchwald H. Cholesterol inhibition, cancer, and chemotherapy. Lancet. 1992;339:1154–1156. doi: 10.1016/0140-6736(92)90744-n. [DOI] [PubMed] [Google Scholar]
- Chen C-L, Huang SS, Huang JS. Cellular heparin sulfate negatively modulates transforming growth factor-β responsiveness in epithelial cells. J. Biol. Chem. 2006;281:11506–11514. doi: 10.1074/jbc.M512821200. [DOI] [PubMed] [Google Scholar]
- Chen YG, Liu F, Massague J. Mechanism of TGF-β receptor inhibition by FKBP12. EMBO J. 1997;16:3866–3876. doi: 10.1093/emboj/16.13.3866. [DOI] [PMC free article] [PubMed] [Google Scholar]
- Derynck R, Akhurst RJ, Balmain A. TGF-β signaling in tumor suppression and cancer progression. Nat. Genet. 2001;29:117–129. doi: 10.1038/ng1001-117. [DOI] [PubMed] [Google Scholar]
- Di Guglielmo GM, Le Roy C, Goodfellow AF, Wrana JL. Distinct endocytic pathways regulate TGF-β receptor signaling and turnover. Nat. Cell Biol. 2003;5:410–421. doi: 10.1038/ncb975. [DOI] [PubMed] [Google Scholar]
- Encinas M, Tansey MG, Tsui-Pierchala BA, Comella JX, Milbrandt J, Johnson EM., Jr C-Sec is required for glial cell line-derived neurotrophic factor (GDNF) family ligand-mediated neuronal survival via a phosphatidylinositol-3 kinase (PI-3K)-dependent pathway. J. Neurosci. 2001;21:1464–1472. doi: 10.1523/JNEUROSCI.21-05-01464.2001. [DOI] [PMC free article] [PubMed] [Google Scholar]
- Galbiati F, Razani B, Lisanti MP. Emerging themes in lipid rafts and caveolae. Cell. 2001;106:403–411. doi: 10.1016/s0092-8674(01)00472-x. [DOI] [PubMed] [Google Scholar]
- Gamble JR, Khew-Goodall Y, Vadas MA. Transforming growth factor-β inhibits E-selectin expression on human endothelial cells. J. Immunol. 1993;150:4494–4503. [PubMed] [Google Scholar]
- Gomez-Mouton C, Lacalle RA, Mira E, Jimenez-Baranda S, Barber DF, Carrera AC, Martinez-A C, Manes S. Dynamic redistribution of raft domains as an organizing platform for signaling during cell chemotaxis. J. Cell Biol. 2004;164:759–768. doi: 10.1083/jcb.200309101. [DOI] [PMC free article] [PubMed] [Google Scholar]
- Grainger DJ. Transforming growth factor β and atherosclerosis: so far, so good for the protective cytokine hypothesis. Arterioscler. Thromb. Vasc. Biol. 2004;24:399–404. doi: 10.1161/01.ATV.0000114567.76772.33. [DOI] [PubMed] [Google Scholar]
- Grainger DJ, Kemp PR, Metcalfe JC, Liu AC, Lawn RM, Williams NR, Grace AA, Schofield PM, Chauhan A. The serum concentraition of active transforming growth factor-β is severely depressed in advanced atherosclerosis. Nat. Med. 1995;1:74–79. doi: 10.1038/nm0195-74. [DOI] [PubMed] [Google Scholar]
- Grainger DJ, Mosedale DE, Metcalfe JC, Bottinger EP. Dietary fat and reduced levels of TGF-β1 act synergistically to promote activation of the vascular endothelium and formation of lipid lesions. J. Cell Sci. 2000;113:2355–2361. doi: 10.1242/jcs.113.13.2355. [DOI] [PubMed] [Google Scholar]
- Heldin CH, Miyazono K, ten Dijke P. TGF-β signaling from cell membrane to nucleus through SMAD proteins. Nature. 1997;390:465–471. doi: 10.1038/37284. [DOI] [PubMed] [Google Scholar]
- Hocevor B, Howe PH. Mechanisms of TGF-β-induced cell cycle arrest. Miner. Electrolyte Metab. 1998;24:131–135. doi: 10.1159/000057360. [DOI] [PubMed] [Google Scholar]
- Huang SS, Huang JS. TGF-β control of cell proliferation. J. Cell. Biochem. 2005;96:447–462. doi: 10.1002/jcb.20558. [DOI] [PubMed] [Google Scholar]
- Huang SS, Ling TY, Tseng WF, Huang YH, Tang FM, Leal SM, Huang JS. Cellular growth inhibition by IGFBP-3 and TGF-β1 requires LRP-1. FASEB J. 2003;17:2068–2081. doi: 10.1096/fj.03-0256com. [DOI] [PubMed] [Google Scholar]
- Ito T, Williams JD, Fraser DJ, Phillips AO. Hyaluronan regulates transforming growth factor-β1 receptor compartmentalization. J. Biol. Chem. 2004;279:25326–25332. doi: 10.1074/jbc.M403135200. [DOI] [PubMed] [Google Scholar]
- Jacobs EJ, Rodriguez C, Brady KA, Connell CJ, Thun MJ, Calle EE. Cholesterol-lowering drugs and colorectal cancer incidence in a large United States cohort. J. Natl. Cancer Inst. 2006;98:69–72. doi: 10.1093/jnci/djj006. [DOI] [PubMed] [Google Scholar]
- Kulkarni AB, Huh CG, Becker D, Geiser A, Lyght M, Flanders KC, Roberts AB, Sporn MB, Ward JM, Karlsson S. Transforming growth factor-β1 null mutation in mice causes excessive inflammatory disease. Proc. Natl. Acad. Sci. USA. 1993;90:770–774. doi: 10.1073/pnas.90.2.770. [DOI] [PMC free article] [PubMed] [Google Scholar]
- Le Roy C, Wrana JL. Clathrin- and non-clathrin-mediated endocytic regulation of cell signaling. Nat. Rev. Mol. Cell Biol. 2005;6:112–126. doi: 10.1038/nrm1571. [DOI] [PubMed] [Google Scholar]
- Lee H, Park DS, Tandon NN, Scherer PE, Lisanti MP. Caveolin-1 null (−/−) mice show dramatic reductions in life span. Arterioscler. Thromb. Vasc. Biol. 2004;24:98–105. doi: 10.1161/01.ATV.0000101182.89118.E5. [DOI] [PubMed] [Google Scholar]
- Li D, Liu Y, Chen J, Velchala N, Amani F, Nemarkommula A, Chen K, Rayaz H, Zhang D, Liu H, et al. Suppression of atherogenesis by delivery of TGF-β1 ACT using adeno-associated virus type 2 in LDLR knockout mice. Biochem. Biophys. Res. Commun. 2006;344:701–707. doi: 10.1016/j.bbrc.2006.04.010. [DOI] [PubMed] [Google Scholar]
- Li MO, Wan YY, Sanjabi S, Robertson AK, Flavell RA. Transforming growth factor-beta regulation of immune responses. Annu. Rev. Immunol. 2006;24:99–146. doi: 10.1146/annurev.immunol.24.021605.090737. [DOI] [PubMed] [Google Scholar]
- Liao JK, Laufs U. Pleiotropic effects of statins. Annu. Rev. Pharmacol. Toxicol. 2005;45:89–118. doi: 10.1146/annurev.pharmtox.45.120403.095748. [DOI] [PMC free article] [PubMed] [Google Scholar]
- Libby P. Inflammation in atherosclerosis. Nature. 2002;420:868–874. doi: 10.1038/nature01323. [DOI] [PubMed] [Google Scholar]
- Liu P, Ying Y, Ko YG, Anderson RG. Localization of platelet-derived growth factor-stimulated phosphorylation cascade to caveolae. J. Biol. Chem. 1996;271:10299–10303. doi: 10.1074/jbc.271.17.10299. [DOI] [PubMed] [Google Scholar]
- Lund LR, Riccio A, Andreasen PA, Nielsen LS, Kristensen P, Laiho M, Saksela O, Blasi F, Dano K. Transforming growth factor-β is a strong and fast acting positive regulator of the level of type-1 plasminogen activator inhibitor mRNA in WI-38 human lung fibroblasts. EMBO J. 1987;6:1281–1286. doi: 10.1002/j.1460-2075.1987.tb02365.x. [DOI] [PMC free article] [PubMed] [Google Scholar]
- Mallat Z, Gojova A, Marchiol-Fournigault C, Esposito B, Kamate C, Merval R, Fradelizi D, Tedgui A. Inhibition of transforming growth factor-β signaling accelerates atherosclerosis and induces an unstable plaque phenotype in mice. Circ. Res. 2001;89:930–934. doi: 10.1161/hh2201.099415. [DOI] [PubMed] [Google Scholar]
- Massague J. The transforming growth factor-β family. Annu. Rev. Cell Biol. 1990;6:597–641. doi: 10.1146/annurev.cb.06.110190.003121. [DOI] [PubMed] [Google Scholar]
- Massague J. TGF-β signal transduction. Annu. Rev. Biochem. 1998;67:753–791. doi: 10.1146/annurev.biochem.67.1.753. [DOI] [PubMed] [Google Scholar]
- McCaffrey TA, Du B, Consigli S, Szabo P, Bray PJ, Hartner L, Weksler BB, Sanborn TA, Bergman G, Bush HL., Jr Genomic instability in the type II TGF-β1 receptor gene in the atherosclerotic and restenotic vascular cells. J. Clin. Invest. 1997;100:2182–2188. doi: 10.1172/JCI119754. [DOI] [PMC free article] [PubMed] [Google Scholar]
- Metcalfe JC, Grainger DJ. Transforming growth factor-β and the protection from cardiovascular injury hypothesis. Biochem. Soc. Trans. 1995;23:403–406. doi: 10.1042/bst0230403. [DOI] [PubMed] [Google Scholar]
- Mitchell H, Choudhury A, Pagano RE, Leof EB. Ligand-dependent and -independent transforming growth factor-β receptor recycling regulated by clathrin-mediated endocytosis and Rab11. Mol. Biol. Cell. 2004;15:4166–4178. doi: 10.1091/mbc.E04-03-0245. [DOI] [PMC free article] [PubMed] [Google Scholar]
- Moustakas A, Pardali K, Gaal A, Heldin CH. Smad regulation in TGF-β signal transduction. J. Cell Sci. 2001;114:4359–4369. doi: 10.1242/jcs.114.24.4359. [DOI] [PubMed] [Google Scholar]
- Nakashima Y, Raines EW, Plump AS, Breslow JL, Ross R. Upregulation of VCAM-1 and ICAM-1 at atherosclerosis-prone sites on the endothelium in the ApoE-deficient mouse. Atherioscler. Thromb. Vasc. Biol. 1998;18:842–851. doi: 10.1161/01.atv.18.5.842. [DOI] [PubMed] [Google Scholar]
- Negre-Aminou P, van Vliet AK, van Erck M, van Thiel GC, van Leeuwen RE, Cohen LH. Inhibition of proliferation of human smooth muscle cells by various HMG-CoA reductase inhibitors; comparison with other human cell types. Biochem. Biophys. Acta. 1997;1345:259–268. doi: 10.1016/s0005-2760(96)00184-1. [DOI] [PubMed] [Google Scholar]
- Owens GK, Geisterfer AA, Yang YW, Komoriya A. Transforming growth factor-β-induced growth inhibition and cellular hypertrophy in cultured vascular smooth muscle cells. J. Cell Biol. 1988;107:771–780. doi: 10.1083/jcb.107.2.771. [DOI] [PMC free article] [PubMed] [Google Scholar]
- Palinski W, Ord VA, Plump AS, Breslow JL, Steinberg D, Witztum JL. ApoE-deficient mice are a model of lipoprotein oxidation in atherogenesis. Demonstration of oxidation-specific epitopes in lesions and high titers of autoantibodies to malondialdehyde-lysine in serum. Arterioscler. Thromb. 1994;14:605–616. doi: 10.1161/01.atv.14.4.605. [DOI] [PubMed] [Google Scholar]
- Pannu J, Nakerakanti S, Smith E, ten Dijke P, Trojanowska M. TGF-β receptor type I-dependent fibrogenic gene program is mediated via activation of Smad1 and Erk1/2 pathways. J. Biol. Chem. 2007;282:10405–10413. doi: 10.1074/jbc.M611742200. [DOI] [PubMed] [Google Scholar]
- Phipps S, Benyahia F, Ou TT, Barkans J, Robinson DS, Kay AB. Acute allergen-induced airway remodeling in atopic asthma. Am. J. Respir. Cell Mol. Biol. 2004;31:626–632. doi: 10.1165/rcmb.2004-0193OC. [DOI] [PubMed] [Google Scholar]
- Piek E, Roberts AB. Suppressor and oncogenic roles of transforming growth factor-β and its signaling pathways in tumorigenesis. Adv. Cancer Res. 2001;83:1–54. doi: 10.1016/s0065-230x(01)83001-3. [DOI] [PubMed] [Google Scholar]
- Pike LJ. Lipid rafts: bringing order to chaos. J. Lipid Res. 2003;44:655–667. doi: 10.1194/jlr.R200021-JLR200. [DOI] [PubMed] [Google Scholar]
- Reckless J, Rubin EM, Verstuyft JB, Metcalfe JC, Grainger DJ. A common phenotype associated with atherogenesis in diverse mouse models of vascular lipid lesions. J. Vasc. Res. 2001;38:256–265. doi: 10.1159/000051054. [DOI] [PubMed] [Google Scholar]
- Ringerike T, Blystad FD, Levy FO, Madshus IH, Stang E. Cholesterol is important in control of EGF receptor kinase activity but EGF receptors are not concentrated in caveolae. J. Cell Sci. 2002;115:1331–1340. doi: 10.1242/jcs.115.6.1331. [DOI] [PubMed] [Google Scholar]
- Roberts AB. Molecular and cell biology of TGF-β. Miner. Electrolyte Metab. 1998;24:111–119. doi: 10.1159/000057358. [DOI] [PubMed] [Google Scholar]
- Robertson AK, Rudling M, Zhou X, Gorelik L, Flavell RA, Hansson GK. Disruption of TGF-β signaling in T cells accelerates atherosclerosis. J. Clin. Invest. 2003;112:1342–1350. doi: 10.1172/JCI18607. [DOI] [PMC free article] [PubMed] [Google Scholar]
- Shull MM, Ormsby I, Kier AB, Pawlowski S, Diebold RJ, Yin M, Allen R, Sidman C, Proetzel G, Calvin D. Targeted disruption of the mouse transforming growth factor-β2 gene results in multifocal inflammatory disease. Nature. 1992;359:693–699. doi: 10.1038/359693a0. [DOI] [PMC free article] [PubMed] [Google Scholar]
- Simons K, Ehehalt R. Cholesterol, lipid rafts, and disease. J. Clin. Invest. 2002;10:597–603. doi: 10.1172/JCI16390. [DOI] [PMC free article] [PubMed] [Google Scholar]
- Simons K, Toomre D. Lipid rafts and signal transduction. Nat. Rev. Mol. Cell Biol. 2000;1:31–39. doi: 10.1038/35036052. [DOI] [PubMed] [Google Scholar]
- Steinberg D. Thematic review series: the pathogenesis of atherosclerosis: an interpretive history of the cholesterol controversy, part III: mechanistically defining the role of hyperlipidemia. J. Lipid Res. 2005;46:2037–2051. doi: 10.1194/jlr.R500010-JLR200. [DOI] [PubMed] [Google Scholar]
- Subtil A, Gaidarov I, Kobylarz K, Lampson MA, Keen JH, McGraw TE. Acute cholesterol depletion inhibits clathrin-coated pit budding. Proc. Natl. Acad. Sci. USA. 1999;96:6775–6780. doi: 10.1073/pnas.96.12.6775. [DOI] [PMC free article] [PubMed] [Google Scholar]
- Wang J, Myeroff L, Parsons R, Sun L, Lutterbaugh J, Fan RS, Zborowska E, Kinzler KW, Vogelstein B. Inactivation of the type II TGF-β receptor in coln cancer cells with microsatellite instability. Science. 1995;268:1336–1338. doi: 10.1126/science.7761852. [DOI] [PubMed] [Google Scholar]
- Wang MM, Sugar IP, Chong PL. Role of the sterol superlattice in the portioning of the antifungal drug nystatin into lipid membranes. Biochemistry. 1998;37:11797–11805. doi: 10.1021/bi980290k. [DOI] [PubMed] [Google Scholar]
- Yuan JN, Tsai MY, Hegland J, Hunninghake DB. Effects of fluvastatin (XU 62−320), and HMG-CoA reductase inhibitor, on the distribution and composition of low density lipoprotein subspecies in humans. Atherosclerosis. 1991;87:147–157. doi: 10.1016/0021-9150(91)90017-w. [DOI] [PubMed] [Google Scholar]