

Summary
Marfan syndrome (MFS) is an autosomal dominant connective-tissue disorder. It involves predominantly three systems (skeletal, ocular, and cardiovascular systems) and is characterized by highly variable expressivity. The diagnosis relies solely on clinical criteria requiring anomalies in at least two systems. By excluding the disease locus fibrillin 1 (FBN1) in a large French family with typical cardiovascular and skeletal anomalies, we raised the issue of genetic heterogeneity in MFS and the implication of a second locus (MFS2). Linkage analyses, performed in this family with dispersed anonymous DNA markers, have localized MFS2 to a region of less than 9 cM between D3S1293 and D3S1283 which map at 3p24.2-p25. In this region the highest lod score was obtained for marker D3S2336 at 4.89 (θ=0.05). LINKMAP analyses indicated that the most probable position for MFS2 was at D3S2335 (multipoint lod score in log base 10 = 5.65).
Keywords: FBN1, MFS2, Marfan syndrome, Connective tissue disorders, Chromosome Mapping, linkage analysis
Keywords: Adult; Base Sequence; Chromosome Mapping; Chromosomes, Human, Pair 3; Female; Haplotypes; genetics; Humans; Lod Score; Male; Marfan Syndrome; classification; genetics; Microfilament Proteins; classification; genetics; Minisatellite Repeats; Molecular Sequence Data; Pedigree
Introduction
Marfan Syndrome (MFS) was the founding member of the “heritable disorders of connective tissue”1. The cardinal features of this autosomal dominant syndrome (estimated incidence of 1/10,000) are prominently observed in three systems: skeletal, ocular and cardiovascular2. These pleiotropic manifestations are associated with great intra- and interfamilial variability that account for complete (or classic) and incomplete (or variant) forms of the syndrome in which only two of the systems are affected. The diagnosis of MFS is entirely clinical and still difficult in some cases despite the guidelines that were set forth in the Berlin nosology3. Quickly after Kainulainen et al. mapped the classic form of MFS to 15q15-q21.3 4,5, it was shown that this chromosomal area harbored the FBN1 gene that encodes fibrillin, the major component of connective tissue microfibrills6. FBN1 was definitely implicated by the detection of tight linkage6,7 followed by the identification of several mutations in MFS patients7, 8, 9, 10. From then on, the concept of genetic heterogeneity was set aside although it had always been suspected to explain the great clinical variability of the syndrome. However, FBN1 mutations have been identified in only a fraction of MFS patients despite extensive screening. Furthermore, the investigation of biosynthesis and extracellular deposition of fibrillin in cultured MFS fibroblasts failed to detect any anomaly in approximately 7% of the patients11. Despite high cumulated lod scores, these observations show that the issue of genetic heterogeneity should not be disregarded in MFS.
We have been investigating a large family of more than 170 subjects, originating from the south of France, with a connective-tissue disorder. The autosomal dominant phenotype segregating in this family associates anomalies in two systems, namely the skeleton (tall stature, arm span greater than height, arachnodactyly, scoliosis, and pectus) and the heart and the aorta (mitral valve prolapse, aortic dilation, aortic dissection or rupture). However, none of the ocular features observed in classic MFS (myopia, ectopia lentis) are documented in the family12,13. These features are thus characteristic of an incomplete form of Marfan syndrome2,3 and this was the initial diagnosis12 since several affected subjects fulfilled the Berlin criteria. This family was included in the panel of families that were studied by the International Marfan Syndrome Consortium to map the MFS gene14,15. The diagnosis of MFS went thus unchallenged until we excluded linkage between the family phenotype and the FBN1 and FBN2 fibrillin genes13 that are involved in MFS6,7 and congenital contractural arachnodactyly (CCA)6 respectively. At that time, the clinical features of all family members were scrutinized and a controversy arose because of divergent interpretation of the Berlin criteria. A compromise was reached and the terminology “Marfan-like” was provisionally adopted13, 16, 17, 18. Since this terminology has been justifiably disputed because clinical findings in the majority of individuals in this family are identical to those observed in conventional Marfan syndrome16 and since several MFS patients displaying no anomaly in fibrillin have been reported11 the implication of a second locus (MFS2) could no longer be eluded. Therefore, recognition of genetic heterogeneity in MFS prompted us to attempt localization of MFS2 through exclusion mapping in this single exceptional family.
Results
Exclusion map and 3p assignment
One hundred forty four genetic markers from 22 autosomes were tested for linkage to the MFS2 locus. These (AC)n microsatellite markers spanning the human genome were chosen on two criteria: their informativity and an average distance of 20 centiMorgans (cM) between adjacent markers19. Each locus was tested for linkage to MFS2 with the MLINK program20. The combined data were also analyzed with the EXCLUDE program21: a non-overlapping exclusion zone of at least 2685 cM, corresponding to 93.07% of the total genome, was established from the cumulative exclusion intervals for each marker. A strong suspicion for linkage with MFS2 was given first by marker D3S1300 with a maximum lod score of 2.53 at θ=0.17. This was the only locus investigated that gave a lod score higher than 1.0. For this reason, the EXCLUDE analysis indicated that the most probable position for the MFS2 locus was on chromosome 3 with a probability of 100%.
The linked marker D3S1300 maps at 3p21 22 that also harbors a collagen gene: COL7A1. Mutations in this gene are associated with Epidermolysis Bullosa (EB)23,24. Although the clinical features and histologic alterations of MFS are very different from those observed in EB, we investigated a possible identity between COL7A1 and the disease locus, since they both map to 3p21. Two intragenic RFLPs, Pvull25 and Alul26, and a closely linked anonymous marker, D3S2 27, were studied after PCR amplification. The Alul polymorphism was non-informative and the Pvull marker showed a maximum lod score of 1.58 (at θ=0). However, the Mspl polymorphism at the D3S2 locus showed two obligate recombinants (IV51 and IV54). Thus, the involvement of the COL7A1 gene was excluded.
Microsatellite markers confirm and refine localization on 3p24.2-p25
To better define the localization of MFS2, 10 polymorphic markers proximal and distal to D3S1300, and spanning a region of 54 cM, were studied: tel-D3S1263, D3S1286, D3S1266, D3S1277, D3S1289, D3S1261, D3S1284, D3S1274, D3S1276, D3S1281-cen. Table 2 summarizes the pairwise lod scores for these loci. Negative lod scores were obtained for the markers proximal to D3S1300. Among the distal markers, D3S1286 and D3S1266 gave the highest lod score values of 3.04 (at θ=0.10) and 2.47 (at θ=0.07) respectively. We then investigated a region of 22 cM surrounding these two markers and studied 11 other loci: tel-D3S2338, D3S1293, D3S1599, D3S2336, D3S1583, D3S1567, D3S2335, D3S2337, D3S1283, D3S1609, D3S1619-cen. Positive lod scores were observed for several markers Table 2. The highest lod score was 4.89 at θ=0.05 for marker D3S2336. Markers D3S1293 and D3S1283 were mapped with somatic cell hybrids (R158 and GM11752 (3;21)) to 3p24.2-p25 22.
Table 2.
Microsatellite tandem repeats localized to chromosome 3p24.2–25
| Locus | Marker name | Primer sequence | Predominant allele size range (bp) |
|---|---|---|---|
| D3S2338 | AFMa037zf5 | GAAGCCAGCAGTTTCTC
CTGTATTGTTTTCCAGGATAAG |
191 |
| D3S2336 | AFM336zb5 | TCCTTTAGTGGTTTTAACACA
TTTACTTGGGCATGTTTG |
105 |
| D3S2335 | AFM312yf5 | GCTGAATGCTTCTGAATGTAT
AAGAGATGGGGTGCTTT |
166 |
| D3S2337 | AFM015xd7 | TACTTGGCATAGCCAGTTGA
AGCCTCTGTNTTGGTTGTAT |
123 |
Thirteen-marker haplotypes were constructed (from tel-D3S1286 to D3S1619-cen) (marker order is shown in figure 1. Within these, a unique 6 marker sub-haplotype (from tel-D3S1599 to D3S2337-cen) was found unrecombined in all affected individuals figure 2. This haplotype is defined by two obligate recombinants identified for loci D3S1293 (subject IV55) and D3S1283 (subject IV54). These data assign MFS2 to an area of less than 9 cM in the subdistal region of 3p. Surprisingly, the 6-marker haplotype is also carried by subjects IV44 and IV86 who had always been considered as “unaffected” in the linkage analyses. This observation revealed that the penetrance of the disease gene was not complete with the clinical criteria that had been used for the classification of family members. To refine the most probable position of the disease locus, LINKMAP analyses were performed. Since erroneous assumption of penetrance has a strong effect on θ 28, these analyses were carried out with a penetrance of 0.89 estimated from the family data. These analyses Figure 3 showed that the most probable position of the MFS2 gene was at D3S2335 (multipoint lod score in log base 10 = 5.65) thus confirming the regional assignment. However, since lod score variations are slight between D3S1599 and D3S2335, all the positions between these two loci are almost equally likely.
Figure 1.
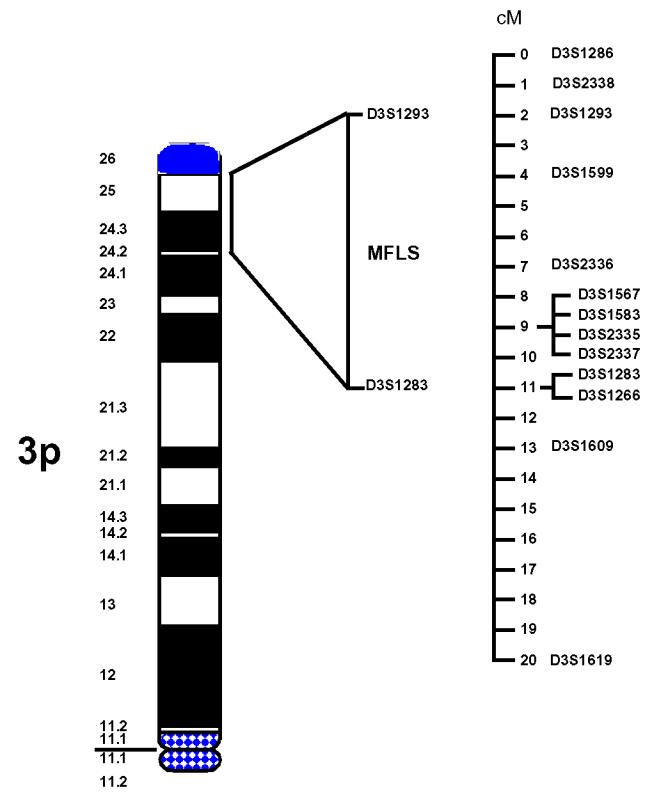
The relative physical locations of the disease gene on the short arm of chromosome 3 and of 13 regional markers.
Figure 2.
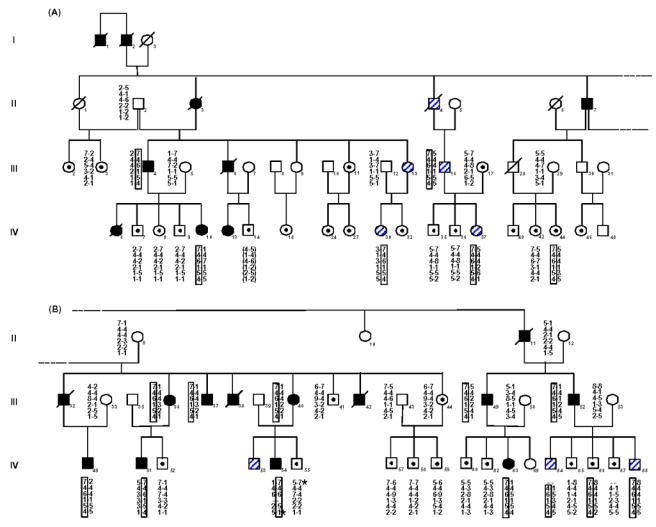
Segregation of chromosome 3p24.2–p25 markers in the Marfan kindred.
(Note that panel A and panel B represent different parts of a single pedigree; i.e., panel B is the rightward extension of panel A). Haplotypes (top to bottom) at tel-D3S1293, D3S1599, D3S2336, D3S2335, D3S2337, D3S1283 -cen markers are shown for each family member tested. Blackened symbols denote affected members, unblackened symbols denote unaffected spouses or unexamined family members, unblackened symbols with a dot in the center denote members considered unaffected, and hatched symbols denote members having an unknown phenotypic status. A slash denotes that the family member is deceased. An asterisk indicates the obligate recombinants with markers D3S1293 (subject IV55) and D3S1283 (subject IV54).
Figure 3.
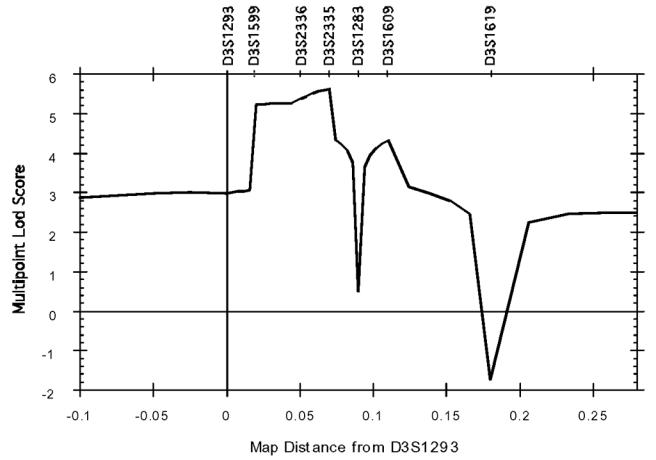
Graph of the multipoint lod scores versus map distance in centiMorgans from locus D3S1293. Composite lod score curve for which marker D3S1293 was chosen arbitrarily as origin for the map. Recombination fractions were converted into centiMorgans using Haldane map function.
Discussion
We have located in 3p24.2-p25 a second gene involved in MFS by exclusion mapping. The data from a single family place the gene between two recombinational events that define the disease haplotype in the family. Although the clinical features are identical to those observed in MFS, this diagnosis could not be made in all affected individuals using recognized criteria3,13. Therefore patient status was established independently by two of us (G. J. and O. D.) with regard to the actual clinical follow-up. Furthermore, to avoid spurious recombination in the genetic analyses, 6 patients and two of their parents were scored unknown13. Linkage analyses were thus performed under very conservative but not powerful conditions. Despite these unfavorable conditions, a maximum lod sore of 4.89 (at θ=0.05) was obtained with marker D3S2336 Table 1, therefore demonstrating conclusive linkage. Careful examination of regional markers showed that two individuals (IV44 and IV86) scored as “unaffected”, carried the disease-related haplotype. Since it is highly unlikely that these two subjects are both double recombinants, they reveal instances of low or non expressivity. IV44 is an adult female who only presented isolated minor skeleton anomalies. IV86, 13 years old when he was first examined, showed no clinical alteration13. These subjects show that the penetrance is not complete in adults, in contrast with classic Marfan syndrome, but also age-dependent. Interestingly, the 6-marker haplotype is also found in all the subjects for whom no definite diagnosis could be made. These patients (IV16, IV30, IV37, IV84 and IV88) were always genotyped and scored as “unknown” in the linkage analyses, in order to avoid spurious results due to misclassification. It must be noted that the clinical findings in these 5 individuals are unchanged since the initial publication13. For the purpose of genetic counselling, all these subjects must now be considered as carriers of the disease gene.
Table 1.
Pairwise lod scores for chromosome 3 markers
| Lod scores at recombination fractions (θ) of: | Zmax | θmax | |||||||||
|---|---|---|---|---|---|---|---|---|---|---|---|
| Locus | Distancea | 0.00 | 0.001 | 0.01 | 0.05 | 0.1 | 0.2 | 0.3 | 0.4 | ||
| D3S1263 | −∞ | −4.42 | −1.47 | 0.40 | 1.02 | 1.28 | 1.08 | 0.6 | 1.28 | 0.18 | |
| D3S1286 | 0.12 | −∞ | −0.39 | 1.59 | 2.81 | 3.04 | 2.69 | 1.94 | 1.01 | 3.04 | 0.10 |
| D3S2338 | 0.01 | −∞ | −4.68 | −0.77 | 1.61 | 2.27 | 2.31 | 1.75 | 0.91 | 2.41 | 0.15 |
| D3S1293 | 0.01 | −∞ | −1.27 | 0.69 | 1.87 | 2.17 | 2.03 | 1.50 | 0.76 | 2.19 | 0.12 |
| D3S1599 | 0.01 | 0.71 | 0.71 | 0.69 | 0.63 | 0.54 | 0.37 | 0.21 | 0.08 | 0.71 | 0.00 |
| D3S2336 | 0.02 | −∞ | 3.55 | 4.50 | 4.89 | 4.71 | 3.87 | 2.70 | 1.32 | 4.89 | 0.05 |
| D3S1567 | 0.03 | 1.50 | 1.49 | 1.47 | 1.37 | 1.23 | 0.94 | 0.62 | 0.31 | 1.50 | 0.00 |
| D3S1583 | 0 | −0.53 | −0.53 | −0.47 | −0.30 | −0.18 | −0.05 | 0.01 | 0.02 | - | - |
| D3S2335 | 0 | −∞ | 3.24 | 4.15 | 4.47 | 4.27 | 3.48 | 2.45 | 1.22 | 4.47 | 0.04 |
| D3S2337 | 0 | −∞ | 3.24 | 4.16 | 4.47 | 4.27 | 3.48 | 2.43 | 1.20 | 4.47 | 0.04 |
| D3S1283 | 0.02 | −∞ | 1.07 | 2.97 | 3.94 | 3.99 | 3.38 | 2.40 | 1.19 | 4.02 | 0.07 |
| D3S1266 | 0 | −∞ | 1.07 | 2.01 | 2.46 | 2.42 | 1.97 | 1.32 | 0.60 | 2.47 | 0.06 |
| D3S1609 | 0.02 | 2.98 | 2.97 | 2.92 | 2.70 | 2.41 | 1.81 | 1.19 | 0.58 | 2.98 | 0.00 |
| D3S1619 | 0.07 | −∞ | −3.58 | −0.64 | 1.15 | 1.66 | 1.71 | 1.29 | 0.64 | 1.77 | 0.14 |
| D3S1277 | 0.01 | −∞ | −5.65 | −2.70 | −0.79 | −0.15 | 0.22 | 0.17 | 0.003 | - | - |
| D3S1289 | 0.11 | −∞ | −11.88 | −6.76 | −3.05 | −1.52 | −0.25 | 0.19 | 0.23 | - | - |
| D3S1300 | 0.12 | −∞ | −6.50 | −1.61 | 1.41 | 2.29 | 2.48 | 1.92 | 0.99 | 2.53 | 0.16 |
| D3S1261 | 0.19 | −∞ | −11.21 | −6.21 | −2.74 | −1.34 | −0.20 | 0.20 | 0.23 | - | - |
| D3S1284 | 0.08 | −∞ | −8.62 | −4.64 | −1.94 | −0.88 | −0.05 | 0.21 | 0.20 | - | - |
| D3S1274 | 0.07 | −∞ | −9.44 | −5.46 | −2.76 | −1.66 | −0.68 | −0.24 | −0.04 | - | - |
| D3S1276 | 0.01 | −∞ | −10.92 | −5.94 | −2.54 | −1.18 | −0.06 | 0.31 | 0.30 | - | - |
| D3S1281 | 0.13 | −∞ | −19.81 | −11.85 | −6.41 | −4.18 | −2.12 | −1.04 | −0.39 | - | - |
Distance between two adjacent markers in recombination fraction.
Our data provide conclusive evidence for the assignment of a second locus for MFS to chromosome 3p24.2-p25. Positioning of the disease locus in relation to the genetic linkage map indicates that MFS2 is located within a 9 cM interval flanked by D3S1293 and D3S1283. These microsatellite markers map to a region that contains 5 cloned genes22: THRB (Thyroid Hormone Receptor Beta), RAF (murine leukemia viral oncogene homolog 1), VHL (von Hippel-Lindau disease tumor suppressor gene), RARE (Retinoic Acid Receptor Beta) and ATP2B2 (ATPase, Ca++ transporting). None of these genes are likely candidates for MFS2. Furthermore, close examination of homologous loci in mouse (murine chromosomes 6 29, 9 30, and 16 31 failed to reveal any disease or developmental abnormality that could be related to the Marfan phenotype. Therefore, the assignment of MFS2 to 3p24.2-p25 opens the avenue to isolating the disease gene by the techniques of positional cloning.
For a long time, the extreme clinical variability of MFS had been attributed to an underlying genetic heterogeneity. To test this hypothesis, three heterogeneity tests were performed: two with the anonymous chromosome 15 markers initially reported as linked to the MFS locus5,15 and another with the FBN1 markers32. Kainulainen et al.5 and Tsipouras et al.32 found no evidence for genetic heterogeneity in a sample of 17 and 28 families respectively. Conversely, Sarfarazi et al.15 detected genetic heterogeneity in a sample of 22 families that included our French family. However, no heterogeneity was detected among the 21 remaining pedigrees. Therefore, heterogeneity went undetected in a sample of 45 families (since the families reported by Sarfarazi et al. were part of the sample reported by Tsipouras et al.). Despite these findings, the question of genetic heterogeneity of MFS has not been completely settled not only because of the debate over the terminology that should be adopted for the French family’s phenotype but also because of the identification of a second MFS family displaying recombination with the FBN1 locus (L. Peltonen, personnal communication). All the above indicate the existence of a small level of heterogeneity that was previously undetected. With the mapping of MFS2, the issue should be addressed again, not only because admixture tests will be more powerful since two candidate loci (FBN1 and MFS2) can now be simultaneously tested but also in the interest of patients awaiting unequivocal molecular diagnosis for genetic conselling. Finally, the involvement of MFS2 should also now be tested in other disorders overlapping MFS. Among these, ectopia lentis and CCA have been mapped to FBN1 and FBN2 respectively. However, mitral valve prolapse33, familial forms of annulo-aortic ectasia34 and the MASS (mitral valve, aorta, skeleton, and skin) phenotype35 are still orphan syndromes. In all these diseases, the cardiovascular manifestations strongly overlap the phenotype of the French family. Therefore the implication of this locus should be investigated.
Methodology
Patients and clinical evaluation
This large French family (see figure 212) was ascertained following the death of a 39 year old male subject from aortic dissection. A family investigation was undertaken. Subjects at risk underwent careful physical examination, echocardiography, and slit-lamp examination. Skeletal findings included arachnodactyly, narrow arched palate, pectus excavatum, scoliosis, increased lower-upper body segment ratio, tall stature, and increased arm span. Cardiovascular features were mitral valve prolapse associated with holosystolic mitral regurgitation, tricuspid valve prolapse, and dilatation of the ascending aorta. None of the affected subjects examined had ectopia lentis. Twenty members who showed major cardiovascular or skeletal manifestations and were first-degree relatives of an affected member were considered as definitely affected. Seventeen family members with no abnormality in any of the systems and 12 subjects who presented with isolated minor skeletal or cardiovascular findings, were considered unaffected. Finally no diagnosis could be made for 6 patients who showed minor skeletal anomalies and/or borderline aortic dilation or mitral valve prolapse and regurgitation. These subjects were scored as “unknown” in the genetic analyses. Complete individual clinical features are listed in 13.
DNA analysis and PCR amplification
Blood samples were collected from 59 family members and DNA was isolated according to a method described elsewhere36.
All PCR amplifications were performed under the following standard conditions. Forty ng DNA from each patient were used as template. The PCR was carried out in a final volume of 50 μl in a microtiter plate, using the Techne PMC3 thermocycler (Cambridge, England) or a thermocycler able to coamplify 16 microtiter plates simultaneously (IAS Products Inc.). The reaction included 5 μl of 10 X buffer (50 mM KCI, 10 mM Tris HCI pH 9, 1.5 mM MgCl2, 0.1% Triton and 0.01% gelatine), 50 pmol of each primer and 31 mM each of dATP, dTTP, dGTP and dCTP. Samples were overlaid with 20 μl of light mineral oil to prevent evaporation. After an initial “hot start” at 96°C for 5 min, 1 unit of Taq DNA polymerase (NBL) was added to each tube, then 35 cycles consisting of denaturation at 94°C (40s) and annealing-elongation at 55°C (30s) were carried out followed by an extension step at 72°C for 2 min. Aliquots from 16 PCR reactions from given DNA samples were pooled, precipitated, and resuspended in 5 μl of 0.1X TE and 12.5 μl of sequencing dye. Finally, they were loaded onto a 6% denaturing polyacrylamide DNA sequencing gel. Electrophoresis was performed for 3 to 5 h at 40 to 50 mA at 3000V. After transfer on Hybond N+ membranes, each forward primer was labelled using terminal transferase (Boehringer). Hybridization was performed at 42°C overnight in the AMASINO medium37. Autoradiography was carried out after the membranes were washed twice in 2XSSC, 0.1% SDS at room temperature.
Linkage analysis
Pairwise and multipoint analyses were performed using the MLINK and LINKMAP subprograms of the LINKAGE package20 assuming an autosomal dominant disease gene with a frequency of 0.00002 and equal female to male recombination rates. In the MLINK analyses, the penetrance value used was 1.0 since there was no evidence of skipped generations in the pedigree and since very conservative diagnostic criteria were used. Allele frequencies were calculated from the study of unrelated members of the family. In the LINKMAP analyses, the penetrance value was inferred from family data and was set at 0.89. Furthermore, the allelle systems were reduced.
The EXCLUDE program21 was used to produce the exclusion map. This program estimates 1) the positional likelihood of the disease locus on each chromosome, 2) the percentage of probability of a locus to be on any of the 22 autosomes.
Acknowledgments
We are indebted to family members for their co-operation. We thank Sylvie Duverneil, Armelle Faure, Maud Petit and Cécile Fizames for their help and contribution to this work. GC is supported by a grant from MESR (Ministère de I’Enseignement Supérieur et de la Recherche). Financial support was provided by grants from Caisse Nationale d’Assurance Maladie des Travailleurs Salariés, INSERM, Fédération de Cardiologie, Association Française contre les Myopathies(AFM), Faculté de Médecine Paris-Quest, Recherche Clinique-Assistance Publique (Grant CRC 930307), and GREG (Groupe de Recherche et d’Etude du Genome). This work was done with the technical support of Génethon.
References
- 1.McKusick VA. The cardiovascular aspects of Marfan’s syndrome: A heritable disorder of connective tissue. Circulation. 1955;11:321–342. doi: 10.1161/01.cir.11.3.321. [DOI] [PubMed] [Google Scholar]
- 2.Pyeritz RE, McKusick VA. The Marfan syndrome: Diagnosis and management. New Eng J Med. 1979;300:772–777. doi: 10.1056/NEJM197904053001406. [DOI] [PubMed] [Google Scholar]
- 3.Beighton P, et al. International nosology of heritable disorders of connective tissue, Berlin, 1986. Am J med Genet. 1988;29:581–594. doi: 10.1002/ajmg.1320290316. [DOI] [PubMed] [Google Scholar]
- 4.Kainulainen K, Pulkkinen L, Savolainen A, Kaitila I, Peltonen L. Location on chromosome 15 of the gene defect causing Marfan syndrome. New Eng J Med. 1990;323:935–939. doi: 10.1056/NEJM199010043231402. [DOI] [PubMed] [Google Scholar]
- 5.Kainulainen K, et al. Marfan syndrome: No evidence for heterogeneity in different populations, and more precise mapping of the gene. Am J hum Genet. 1991;49:662–667. [PMC free article] [PubMed] [Google Scholar]
- 6.Lee B, et al. Linkage of Marfan syndrome and a phenotypically related disorder to two different fibrillin genes. Nature. 1991;352:330–334. doi: 10.1038/352330a0. [DOI] [PubMed] [Google Scholar]
- 7.Dietz HC, et al. Marfan syndrome caused by a recurrent de novo missense mutation in the fibrillin gene. Nature. 1991;352:337–339. doi: 10.1038/352337a0. [DOI] [PubMed] [Google Scholar]
- 8.Kainulainen K, et al. Two mutations in Marfan syndrome resulting in truncated fibrillin polypeptides. Proc Natn Acad Sci USA. 1992;89:5917–5921. doi: 10.1073/pnas.89.13.5917. [DOI] [PMC free article] [PubMed] [Google Scholar]
- 9.Dietz HC, Saraiva JM, Pyeritz RE, Cutting GR, Francomano CA. Clustering of fibrillin (FBN1) missense mutations in Marfan syndrome patients at cysteine residues in EGF-like domains. Hum Mut. 1992;1:366–74. doi: 10.1002/humu.1380010504. [DOI] [PubMed] [Google Scholar]
- 10.Tynan K, et al. Mutation screening of complete fibrillin-1 coding sequence: Report of five new mutations, including two in 8-cysteine domains. Hum molec Genet. 1993;2:1813–1821. doi: 10.1093/hmg/2.11.1813. [DOI] [PubMed] [Google Scholar]
- 11.Aoyama T, Francke U, Dietz H, Furthmayr H. Quantitative differences in biosynthesis and extracellular deposition of fibrillin in cultured fibroblasts distinguish five groups of Marfan syndrome patients and suggest distinct pathogenetic mechanisms. J clin Invest. 1994;94:130–137. doi: 10.1172/JCI117298. [DOI] [PMC free article] [PubMed] [Google Scholar]
- 12.Boileau C, et al. Linkage analysis of five fibrillar collagen loci in a large French Marfan family. J med Genet. 1990;27:78–81. doi: 10.1136/jmg.27.2.78. [DOI] [PMC free article] [PubMed] [Google Scholar]
- 13.Boileau C, et al. Autosomal dominant Marfan-like connective-tissue disorder with aortic dilation and skeletal anomalies not linked to the fibrillin genes. Am J hum Genet. 1993;53:46–54. [PMC free article] [PubMed] [Google Scholar]
- 14.Blanton SH, et al. An exclusion map of Marfan syndrome. J med Genet. 1990;27:73–77. doi: 10.1136/jmg.27.2.73. [DOI] [PMC free article] [PubMed] [Google Scholar]
- 15.Sarfarazi M, et al. A linkage map of 10 loci flanking the Marfan syndrome locus on 15q: Results of an International Consortium Study. J med Genet. 1992;29:75–80. doi: 10.1136/jmg.29.2.75. [DOI] [PMC free article] [PubMed] [Google Scholar]
- 16.Gilchrist DM. Marfan syndrome or Marfan-like connective tissue disorder. Am J hum Genet. 1994;54:553. [PMC free article] [PubMed] [Google Scholar]
- 17.Boileau C, Jondeau G, Bourdarias JP, Junien C. Marfan syndrome or Marfan-like connective tissue disorder. Reply to Gilchrist. Am J hum Genet. 1994;54:554. [PMC free article] [PubMed] [Google Scholar]
- 18.Editor’s note. Am J hum Genet. 1994;54:553–554. [Google Scholar]
- 19.Weissenbach J, et al. A second-generation linkage map of the human genome. Nature. 1992;359:794–801. doi: 10.1038/359794a0. [DOI] [PubMed] [Google Scholar]
- 20.Lathrop GM, Lalouel JM, Julier C, Ott J. Strategies for multilocus linkage analysis in humans. Proc Natn Acad Sci USA. 1984;81:3443–3446. doi: 10.1073/pnas.81.11.3443. [DOI] [PMC free article] [PubMed] [Google Scholar]
- 21.Edwards JH. Exclusion mapping. J med Genet. 1987;24:539–543. doi: 10.1136/jmg.24.9.539. [DOI] [PMC free article] [PubMed] [Google Scholar]
- 22.Naylor SL, Buys CHCM, Carritt B. Report of the Fourth International Workshop on human chromosome 3 mapping 1993. Cytogenet Cell Genet. 1994;65:1–50. [PubMed] [Google Scholar]
- 23.Christiano AM, et al. A missense mutation in type VII collagen in two affected siblings with recessive Dystrophic Epidermolysis Bullosa. Nature Genet. 1993;4:62–66. doi: 10.1038/ng0593-62. [DOI] [PubMed] [Google Scholar]
- 24.Hilal L, et al. A homozygous insertion-deletion in the type VII collagen gene (COL7A1) in Hallopeau-Siemens dystrophic epidermolysis bullosa. Nature Genet. 1993;5:287–293. doi: 10.1038/ng1193-287. [DOI] [PubMed] [Google Scholar]
- 25.Hovnanian A, et al. Genetic linkage of recessive Dystrophic Epidermolysis Bullosa to the type VII collagen gene. J clin Invest. 1992;90:1032–1036. doi: 10.1172/JCI115916. [DOI] [PMC free article] [PubMed] [Google Scholar]
- 26.Christiano AM, Chung-Honet LC, Hovnanian A, Uitto J. PCR-based detection of two exonic polymorphisms in the human type VII collagen gene (COL7a1) at 3p21. Genomics. 1992;14:827–828. doi: 10.1016/s0888-7543(05)80204-6. [DOI] [PubMed] [Google Scholar]
- 27.Al-Imara L, et al. Linkage of autosomal dominant Dystrophic Epidermolysis Bullosa in three British families to the marker D3S2 close to the COL7A1 locus. J med Genet. 1992;29:381–382. doi: 10.1136/jmg.29.6.381. [DOI] [PMC free article] [PubMed] [Google Scholar]
- 28.Clerget-Darpoux F, Bonaïti-Pellié C, Hochez J. Effects of misspecifying genetic parameters in lod score analysis. Biometrics. 1986;42:393–399. [PubMed] [Google Scholar]
- 29.Moore KJ, Elliott RN. Mouse chromosome 6. Mamm Genome. 1993;4:88–109. doi: 10.1007/BF00360832. [DOI] [PubMed] [Google Scholar]
- 30.Kingsley DM. Mouse chromosome 9. Mamm Genome. 1993;4:136–153. doi: 10.1007/BF00360835. [DOI] [PubMed] [Google Scholar]
- 31.Reeves RH, Irving NG, Miller RD. Mouse chromosome 16. Mamm Genome. 1993;4:223–229. doi: 10.1007/BF00360842. [DOI] [PubMed] [Google Scholar]
- 32.Tsipouras P, et al. Genetic linkage of the Marfan syndrome, ectopia lentis, and congenital contractural arachnodactyly to the fibrillin genes on chromosomes 15 and 5. New Engl J Med. 1992;326:905–909. doi: 10.1056/NEJM199204023261401. [DOI] [PubMed] [Google Scholar]
- 33.Devereux RB, et al. Diagnosis and classification of severity of mitral valve prolapse: Methodologic, biologic, and prognostic considerations. Am Heart J. 1987;113:1265–1280. doi: 10.1016/0002-8703(87)90955-0. [DOI] [PubMed] [Google Scholar]
- 34.McKusick VA. Mendelian inheritance in man. 8. Johns Hopkins University Press; Baltimore: 1988. [Google Scholar]
- 35.Glesby MJ, Pyeritz RE. Association of mitral valve prolapse and systemic abnormalities of connective tissue. A phenotypic continuum. J Am med Ass. 1989;262:523–528. [PubMed] [Google Scholar]
- 36.Henry I, et al. The genes coding for alpha-, beta-, and gamma-chains of fibrinogen map to 4q2. Am J hum Genet. 1984;36:760–768. [PMC free article] [PubMed] [Google Scholar]
- 37.Amasino RM. Acceleration of nucleic acid hybridization rate by polyethylen glycol. Anal Biochem. 1986;152:304–307. doi: 10.1016/0003-2697(86)90413-6. [DOI] [PubMed] [Google Scholar]