Abstract
The plant hormone ethylene regulates a variety of processes of growth and development. To identify components in the ethylene signal transduction pathway, we screened for ethylene-insensitive mutants in Arabidopsis thaliana and isolated a dominant etr2-1 mutant. The etr2-1 mutation confers ethylene insensitivity in several processes, including etiolated seedling elongation, leaf expansion, and leaf senescence. Double mutant analysis indicates that ETR2 acts upstream of CTR1, which codes for a Raf-related protein kinase. We cloned the ETR2 gene on the basis of its map position, and we found that it exhibits sequence homology to the ethylene receptor gene ETR1 and the ETR1-like ERS gene. ETR2 may thus encode a third ethylene receptor in Arabidopsis, transducing the hormonal signal through its “two-component” structure. Expression studies show that ETR2 is ubiquitously expressed and has a higher expression in some tissues, including inflorescence and floral meristems, petals, and ovules.
The simple gas ethylene plays an important role in regulating growth and development in higher plants. It is involved in basic cellular processes such as cell elongation, cell division, and cell death, as well as in physiological processes such as seed germination, senescence, and fruit ripening (1). Ethylene is also a signal for plants to adapt to a changing environment. It mediates stress responses such as wound response and pathogen response (2, 3). A number of mutants defective in ethylene responses have been isolated in Arabidopsis thaliana with the aid of the “triple response” assay. The “triple response” refers to the three features of an etiolated seedling grown in the presence of ethylene, which are a short and thick hypocotyl, a short root, and an exaggerated apical hook. Mutants that do not display the triple response in ethylene (categorized as ethylene insensitive) are etr1, ein2, ein3, ein4, ein5, ein6, ein7, and ain1 (4). ctr1 mutants, which exhibit the triple response in air, are categorized as constitutive ethylene responsive (5). Ethylene response defects also extend to adult plants in mutants such as etr1 and ctr1 (5, 6). A genetic pathway for ethylene signal transduction has been deduced from double mutant analyses. ETR1 and EIN4 act upstream of CTR1, whereas EIN3, EIN5, EIN6, and EIN7 are downstream of CTR1 (4).
The molecular cloning of some of these genes has begun to reveal the components of the ethylene signal transduction pathway. The ETR1 gene encodes an ethylene receptor, as indicated by the ethylene-binding activity of the amino-terminal domain of ETR1 (7). The carboxyl-terminal region consists of a putative histidine kinase domain and a receiver domain, both of which are homologous to the bacterial “two-component” regulators (8). These regulators are sensors and transducers of a variety of signals in adaptation responses in bacteria (9). The first component, the sensor, consists of an input domain and a histidine protein kinase domain. The second component, the response regulator, has a receiver domain and an output domain. The histidine autokinase of the sensor is activated or repressed by the perception of the signal through the input domain. The phosphoryl group from the histidine residue can be transferred to the aspartate in the receiver domain, whereupon the activity of the output domain is modulated. In bacteria, the output domain usually has a DNA binding motif and regulates transcription directly. ETR1 has both the putative histidine kinase domain and the receiver domain in the same protein. This “hybrid” structure also exists in a small fraction of known bacterial sensors. By analogy to the bacterial two-component regulators, ETR1 may sense ethylene through the amino-terminal domain and transmit the binding signal to the histidine protein kinase domain and the receiver domain. ETR1 appears to be a member of a small family of ethylene receptors in Arabidopsis. An ETR1-related gene, ERS, was discovered by cross-hybridization to ETR1 (10). ERS is also implicated in ethylene sensing, as indicated by the dominant ethylene-insensitive phenotype conferred by a mutated ERS gene (10) and the ethylene-binding activity of the amino-terminal domain of ERS (A.B.B., unpublished results). CTR1 acts downstream of ETR1 and ERS and encodes a serine/threonine protein kinase related to the Raf kinases found in animals (5). CTR1 is a negative regulator of ethylene response, as loss-of-function mutants display constitutive ethylene responses. The downstream EIN3 gene encodes a novel nuclear-localized protein that is probably directly involved in transcriptional regulation (11).
To further elucidate the ethylene signal perception pathway, we undertook a genetic approach to isolate other genes involved in this process. We describe here the isolation and characterization of an ethylene-insensitive mutant etr2 and the cloning of the ETR2 gene. Its sequence similarity to ETR1 and ERS together with the genetic studies suggests that ETR2 may act as an additional ethylene receptor. Expression studies of the ETR2 gene suggest its possible involvement in the development of different plant tissues.
MATERIALS AND METHODS
Plant Strains and Growth.
Arabidopsis thaliana ecotype Columbia was used in this study unless stated otherwise. Etiolated M2 seedlings were screened after 3 days’ growth on Murashige and Skoog (MS) medium solidified with 1% agar in the presence of 5 μl/liter ethylene. Seedlings with long hypocotyls and roots were chosen as ethylene insensitive mutants for further characterization. Dose–response analysis was carried out as previously described (12).
Mapping of ETR2.
etr2-1 was crossed to ecotype Landsberg for mapping. Between 60 and 70 F3 families homozygous for ethylene-insensitive phenotypes were used for restriction fragment length polymorphism (RFLP) (13) and simple sequence length polymorphism (SSLP) mapping (14).
DNA Analysis.
Nucleotide sequences were determined with the use of Sequenase Version 2.0 (United States Biochemical) and synthetic oligonucleotides. A 7.3-kb fragment containing the ETR2 gene (see below) was sequenced at least once in both directions. To identify mutations in etr2-1, we amplified the ETR2 coding region from wild-type and mutant plant tissues by polymerase chain reaction (PCR). PCR products were excised from a low melting point gel and used directly for sequencing. A genomic DNA library constructed from Sau3A partially digested DNA of etr2-1 was screened at high stringency [wash in 0.25 M NaCl/10 mM phosphate, pH 7.4/1 mM EDTA (0.1× SSPE) at 65°C] with an ETR2 probe. λ clones containing the ETR2 gene were isolated. The alteration in etr2-1 was confirmed by sequencing the ETR2 gene isolated from this library.
Plant Transformation.
A full-length ETR2 genomic fragment was generated by fusing two EcoRI (5.5 kb and 1.8 kb) pieces into pBluescript (Stratagene). The 7.3-kb fragments isolated from wild-type and from etr2-1 mutant plants were each excised by BamHI/KpnI digestion and ligated into transformation vector pCGN1547 (15). These constructs in pCGN1547 were introduced into Agrobacterium strain ASE (16), which was used to transform wild-type Arabidopsis thaliana by the in planta vacuum infiltration method (17). T1 plants were selected on MS plates supplemented with 50 mg/liter kanamycin. About 20 transgenic plants were obtained for each construct.
RNA Analysis.
Poly(A)+ RNA was isolated from 1-week-old seedlings, roots, rosette leaves, inflorescences with flowers, and mature siliques of Arabidopsis thaliana ecotype Landsberg erecta (Ler)as previously described (18) by using the PolyATtract system (Promega). Poly(A)+ RNA was then incubated with RNase-free DNase I for 1 hr and subsequently extracted several times with phenol and chloroform. One microgram of poly(A)+ RNA was reverse-transcribed, and 1/100 of the first strand cDNA was used for PCR. Three different sets of primers were designed for amplification: ETR2 ORF encompassing the intron (5′-AGGACAAGATCTAAGC-3′ and 5′-AGGCAATCGAATCCAG-3′), the downstream untranscribed region of ETR2 (5′-CTGCACATTCCTCGAGC-3′ and 5′-GCAATAACTGTAGGCAGC-3′), and the ubiquitin-conjugating enzyme gene, UBC4 (5′-AGTGGAGCTCCACAAG-3′ and 5′-CCTTGCAGCCTCTGCG-3′) (19). PCR products were separated on agarose gels and visualized by using a digital imaging system (Alpha Innotech, San Leandro, CA). DNA amounts were quantitated by using the nih image 1.6.4 program.
To identify the 5′ end of the mRNA, flower poly(A)+ RNA was reverse transcribed and ligated with a linker DNA of the Marathon PCR System according to the manufacture (CLONTECH). 5′ ETR2 cDNA was amplified by using a primer (5′-CGTGGATAACCACCGCCG-3′) for the first round reaction and a nested primer (5′-CTGTACTCCAGAAACTG-3′) for the second round reaction in combination with the linker primers. The amplified DNA was cloned into the pCR2.1 vector (Invitrogen) and sequenced.
In Situ Hybridization.
The localization of RNA in plant tissues was analyzed by radioactive in situ hybridization as previously described (20) with modifications (21). The sense and antisense RNA probes were synthesized from the histidine kinase and receiver domains of the ETR2 gene by in vitro transcription in the presence of α-[35S]thio-UTP. Hybridized sections were exposed on Kodak emulsion NBT2 for 6 weeks.
RESULTS
Phenotypic Analysis of the etr2 Mutant.
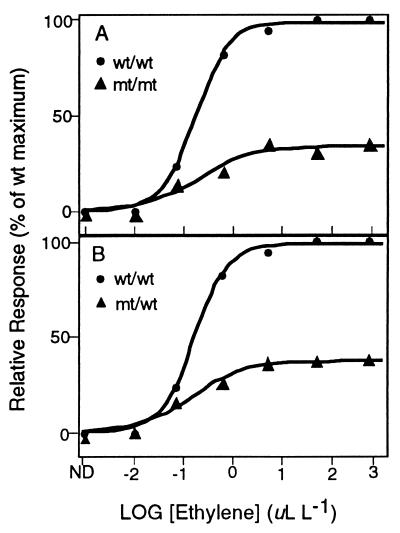
The etr2 (ethylene response 2) mutant was isolated from an ethyl methanesulfonate (EMS)-mutagenized population of 100,000 M2 seedlings by using the seedling growth response as a screen (6). Dose–response analysis of hypocotyl-elongation response in dark-grown seedlings indicated a greatly reduced sensitivity to ethylene in etr2-1 relative to the wild-type seedlings (Fig. 1A). A similar degree of insensitivity was observed for the root-growth response (data not shown). Similar to what was previously noted for the reduced-sensitivity etr1-2 mutant (12), the etr2-1 mutation did not appreciably alter the threshold or saturation concentrations of ethylene for the response, but rather primarily affected the degree of maximal responsiveness. Also similar to the etr1 mutants, the etr2-1 allele was genetically dominant over wild type as indicated by segregation of backcross progeny (data not shown), and by the dose–response curve for hypocotyl elongation in the heterozygous seedlings (Fig. 1B).
Figure 1.
Dose–response analysis of the hypocotyl elongation of the etr2-1 mutants (homozygous in A, heterozygous in B). •, Wild-type response; ▴, mutant response (represented as percentage of the wild-type response). ND, not detected.
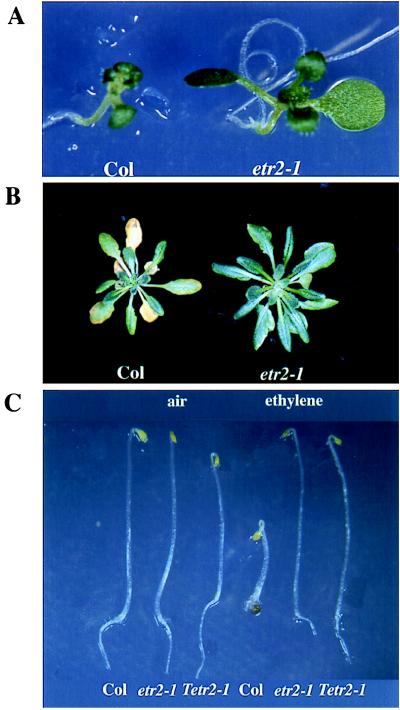
To further characterize the lesions in etr2-1, we examined other ethylene responses of this mutant. Ethylene inhibits leaf expansion of light-grown wild-type plants, so that wild-type plants have much smaller leaves when grown in ethylene than in air. This ethylene effect on leaf size is mostly due to an inhibition of cell expansion, and a correlation between leaf size and cell size has been demonstrated in ctr1-1 and ers-1 mutants (5, 10). Ethylene-insensitive mutants such as etr1-1 and ers-1 are not affected by this inhibitory effect of ethylene (ref. 10 and unpublished data). Moreover, etr1-1 and ers-1 mutants grown in air have bigger leaves than the wild type, presumably because they are insensitive to endogenous ethylene (10). Unlike etr1 and ers mutants, etr2-1 had the same leaf size as the wild type when grown in air (data not shown). However, the etr2-1 mutation greatly reduced the inhibitory effect of exogenous ethylene on leaf expansion, similar to, but to a lesser extent than, the etr1-1 and ers-1 mutations. etr2-1 mutants grown in ethylene had only slightly reduced leaf size compared with those grown in air (data not shown), but they had much larger leaves than did the wild type grown in ethylene (Fig. 2A). Ethylene also accelerates leaf senescence of mature plants. After being treated with ethylene for 3 days, 1-month-old wild-type plants showed leaf yellowing. In contrast, etr2-1 mutant leaves did not appear to be affected by ethylene treatment (Fig. 2B).
Figure 2.
Phenotypes of the etr2-1 mutant and the etr2-1 transgenic plants. (A) etr2-1 grown in the presence of ethylene has larger leaves than the wild type. (B) etr2-1 treated with ethylene has delayed leaf senescence compared with wild type. (C) Wild-type plants transformed with the mutant etr2 gene display ethylene-insensitive phenotypes in the triple response assay. Tetr2-1, etr2-1 transgenic plants.
Genetic Analysis of etr2 Mutant.
Preliminary data from crosses between etr2-1 and etr1-1 indicated that the loci represented by these mutations are unlinked. To confirm that etr2 represents a ethylene-response locus not previously described, the mutation was mapped by using a combination of restriction fragment length polymorphism (RFLP) and simple sequence length polymorphism (SSLP) markers. Data from more than 60 segregating F3 families indicated that etr2 mapped 7.2 centimorgans (cM) proximal to RFLP marker m560 and 27.2 cM proximal to SSLP marker nga 172 on chromosome 3. Therefore, the ETR2 locus is distinct from ETR1 on chromosome 1. It is also different from EIN4, which also resides on chromosome 3 but is more closely linked to nga 172 (22).
To place the ETR2 gene in the ethylene signal transduction pathway, we tested the epistatic relationship of etr2 and ctr1 by crossing etr2-1 to ctr1-2. Of 514 F2 progeny grown in air, 99 had the ctr1 phenotype. This is consistent with a ratio of 1 ctr1 to 3 wild type, taking into account that the transmission of ctr1 is 30% reduced compared with wild type (5). Of 463 F2 progeny grown in ethylene, 280 showed an ethylene-insensitive phenotype, consistent with a 9 insensitive to 7 sensitive (or constitutive responsive) ratio when etr2 is dominant and ctr1 is epistatic. These results indicate that ctr1 is epistatic to etr2. The epistatic relationship was later confirmed by genotyping the double mutants once the etr2-1 mutation was identified (see below).
Isolation of the ETR2 Gene.
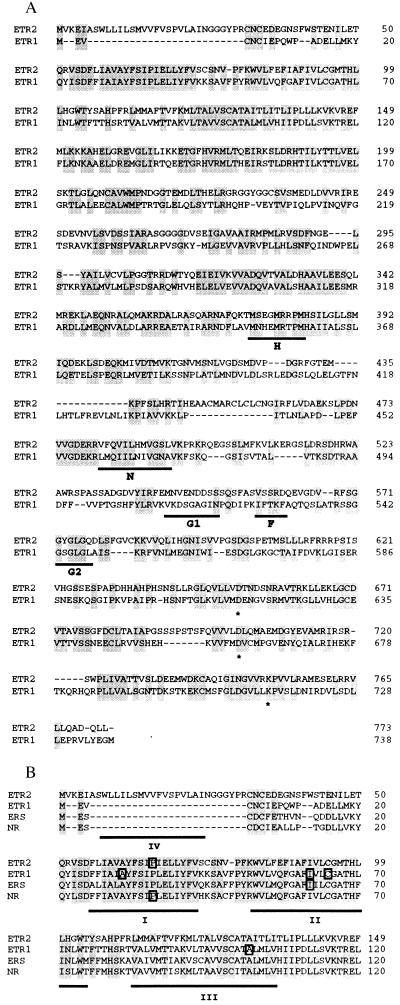
The etr2 mutation maps very close to the SUPERMAN (SUP) locus. The approximately 100-kb-long genomic DNA region containing the SUP gene was extensively analyzed previously, and several genes were identified in this region (21). One of these genes, Q8, showed sequence similarity to the ETR1 gene. Because the phenotypes of the etr1 and etr2 mutants resemble each other, we investigated whether Q8 was the ETR2 gene. We sequenced the Q8 gene from the etr2-1 mutant, and we identified a C → T transversion in etr2-1. This change results in a leucine substitution for a proline (residue 66) that is highly conserved among the other putative ethylene receptor genes (Fig. 3B). This substitution is identical to that in the mutant Never-ripe (Nr) gene, which is a putative ethylene receptor gene in tomato (23) (Fig. 3B). To further confirm the identity of Q8 as the ETR2 gene, we isolated the Q8 gene from a λ library constructed from etr2-1 genomic DNA. Two 7.4-kb-long genomic DNA fragments containing the Q8 coding region together with 3.5 kb upstream and 1.5 kb downstream were isolated from etr2-1 and wild type, respectively, and were used to transform wild-type Arabidopsis plants. Six of the nine transformants containing the fragment from etr2-1 exhibited the ethylene-insensitive phenotype (Fig. 2C), whereas none of the ten transformants with the wild-type fragment showed the insensitive phenotype. As no other genes were found in this 7.4-kb fragment, we conclude that Q8 is the ETR2 gene (GenBank accession no. AF047975).
Figure 3.
Protein sequence comparison between the putative ethylene receptors. (A) Amino acid sequence alignment of ETR2 and ETR1. Similar amino acids are shaded. The five motifs found in ETR1 corresponding to those of the bacterial histidine kinases (H, N, G1, F, G2) are underlined. Three residues corresponding to the residues conserved in the bacterial receiver modules are indicated by ∗. (B) Amino acid sequence alignment of the amino-terminal domains of Arabidopsis ETR2, ETR1, and ERS and tomato NR. Putative transmembrane segments are underlined. Amino acids that are mutated in ethylene-insensitive mutants are boxed.
Structure of the ETR2 Gene.
Using an ETR2 genomic DNA fragment as a hybridization probe, we isolated several cDNA clones from a cDNA library constructed from young flower RNA (24). Comparison of the cDNA sequence and genomic DNA sequence from Ler showed that the ETR2 gene consists of two exons that are interrupted by a short intron of 83 bp. 5′ Rapid amplification of cDNA ends (RACE) revealed an additional intron of 97 bp in the 371-bp-long untranslated leader region and four additional out-of-frame ATGs upstream of the initiating ATG of the ETR2 ORF.
The ETR2 gene encodes a putative protein of 773 amino acids. A search of the GenBank database showed that ETR2 has a high sequence similarity to the ethylene receptor gene ETR1 (8) and putative ethylene receptor genes ERS (10) and Nr (23). The deduced ETR2 protein has an overall structure similar to that of ETR1: it consists of an amino-terminal domain, a putative histidine kinase domain, and a receiver domain (Fig. 3A). ERS and Nr have only the amino-terminal domain and the putative histidine kinase domain. When sequence similarity of the full-length proteins is considered among the Arabidopsis gene products, ETR1 and ERS are more closely related to each other (79% similarity), and ETR2 is almost equally distantly related to ETR1 and ERS (65% and 63% similarity, respectively).
The amino-terminal domain is the most conserved portion among ETR2, ETR1, and ERS, with ETR2 sharing about 71% similarity to ETR1 and ERS (Fig. 3B). As this domain of ETR1 has ethylene-binding activity, ETR2 is likely to be capable of ethylene binding as well. One unique feature of ETR2 in this domain is the presence of an amino-terminal extension that may contain a fourth hydrophobic segment (Fig. 3B). A weaker sequence similarity in the putative histidine protein kinase domains is observed between ETR2 and ETR1/ERS (58%/56% similarity) than between ETR1 and ERS (79% similarity). While ETR1 and ERS have all of the five conserved motifs in the bacterial histidine protein kinases (H, N, G1, F, and G2) (9), ETR2 is more diverged from the consensus sequences (Fig. 3A). Most strikingly, the conserved histidine residue in the H motif, which is postulated to serve as a phosphorylation site in bacterial two-component proteins, is replaced by a glutamate residue in ETR2 (Fig. 3A). Sequences similar to the N motifs of ETR1 and ERS are present in ETR2, but the two N residues are absent. While the G2 motif is present in ETR2, neither the G1 motif nor the F motif is found in ETR2. The receiver domain of ETR2 has 66% similarity and 44% identity to that of ETR1. The aspartate and lysine residues conserved among the bacterial receiver domains are present in ETR2.
Expression of the ETR2 Gene.
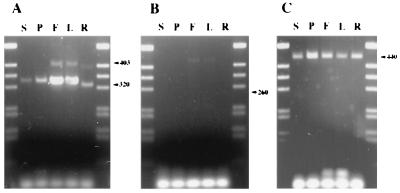
The low abundance of ETR2 clones in the cDNA library (1/300,000 cDNA clones) indicated that ETR2 is a weakly expressed gene. We applied the reverse transcription PCR (RT-PCR) method to analyze the expression of ETR2 in various tissues. Poly(A)+ RNA was isolated from seedlings, roots, leaves, flowers, and mature siliques. The total cDNA obtained from reverse transcription of poly(A) RNA was subjected to PCR using a set of ETR2-specific primers, which were designed to amplify DNA between two exons. As shown in Fig. 4A, the corresponding cDNA was amplified from all these tissues. Higher levels of amplification of ETR2 were obtained from flowers and leaves. Because the cDNA for the constitutively expressed UBC4 gene was amplified equally in experiments performed under the same conditions (Fig. 4C), ETR2 appears to be expressed more strongly in these tissues.
Figure 4.
Reverse transcription PCR analysis of ETR2 expression in various plant tissues: S, seedling; P, silique; F, flower; L, leaf; and R, root. (A) Amplification of ETR2 cDNA. The 320-bp-long DNA corresponds to the spliced cDNA, and the 403-bp-long DNA, to the unspliced cDNA. (B) Control amplification of an untranscribed region downstream of the ETR2 gene. PCR amplification did not yield any detectable DNA of the corresponding size (260 bp), which was, however, produced by PCR amplification on the Ler genomic DNA (data not shown). (C) Amplification of 440-bp-long cDNA for UBC4, a constitutively expressed gene in these tissues (19).
In the reverse transcription PCR analysis, cDNA containing the second intron was also detected (Fig. 4A). In flowers and leaves, 14% of the total amplified cDNA was of the unspliced class, which may lead to a shorter protein product. It is very unlikely that the amplified DNA with the intron was derived from genomic DNA, as the control PCR reaction with a set of primers for the untranscribed region downstream of ETR2 did not yield any corresponding DNA (Fig. 4B). This is also indicated by the finding that some of the cDNA clones contained this unspliced intron (data not shown).
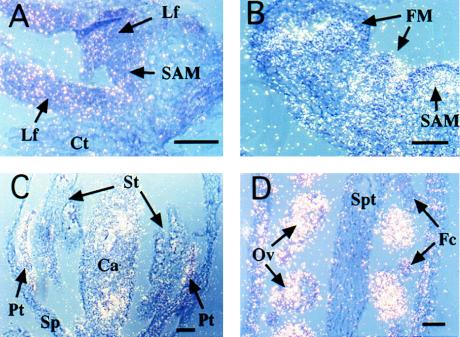
To better localize cells expressing ETR2, we examined the accumulation of ETR2 RNA by using in situ hybridization. ETR2 appears to be expressed weakly but evenly in all tissues, including shoot apical meristems and leaf primordia (Fig. 5A). However, ETR2 mRNA is more strongly detected in central inflorescence meristems and young floral meristems (Fig. 5B). In flowers, ETR2 expression is concentrated in developing petals and ovules (Fig. 5 C and D). The expression is detected in all parts of the ovule and persists after fertilization.
Figure 5.
Localization of ETR2 RNA in seedlings (A), inflorescence shoots and young floral meristems (B), young flowers at stage 9 (floral stages according to ref. 25) (C), and carpels at stage 13–14 (D). Plant tissues (Ler ecotype) were sectioned longitudinally. Pictures were taken by a double exposure of bright- and dark-field micrographs, which show radioactive signals as bright grains. SAM, shoot apical meristem; Lf, leaf primordium; Ct, cotyledon; FM, floral meristem; Pt, petal; Sp, sepal; St, stamen; Ca, carpel; Ov, ovule; Spt, septum; Fc, funiculus. (Scale bars, 50 μm). Hybridization of the sense RNA probe did not give any signal above the background level (data not shown).
DISCUSSION
From a genetic screen for ethylene response mutants, we identified the gene ETR2. The etr2 mutant exhibits a dominant ethylene-insensitive phenotype in the triple response assay, in leaf expansion, and in leaf senescence. These phenotypes are similar to those of etr1 mutants and ers transgenic mutants. Like ETR1 and ERS, ETR2 acts upstream of CTR1 in the ethylene signaling pathway as shown by the epistasis. ETR2 maps to the well characterized region of the SUP locus on chromosome 3. We determined that an ETR1-related gene in that region is the ETR2 gene: we identified a mutation in this gene in the etr2-1 mutant, and reestablished the dominant mutant phenotype in wild-type plants transformed with the mutant gene.
The extensive sequence similarity and the similarity in mutant phenotype of ETR2 to ETR1 and ERS suggest that ETR2 has a function analogous to that of ETR1 and ERS. However, it is not certain that the ETR2 gene actually encodes an ethylene receptor, as the ethylene-binding activity of ETR2 has not been tested and only one dominant allele of etr2 is available. It is therefore possible that the etr2-1 mutant protein interferes with the function of the authentic ethylene receptors, while the wild-type function of ETR2 is not related with ethylene sensing.
If ETR1, ETR2, and ERS all act as ethylene receptors, this redundancy could account for the absence of recessive alleles of these genes from the genetic screens. However, it remains to be explained why several ethylene receptors are required. It is possible that ETR1, ETR2, and ERS contribute differently to ethylene signal transduction. Sequence comparison revealed that carboxyl-terminal regions of these proteins are less conserved than the amino-terminal putative ethylene-binding domain. ETR1 and ERS possess all of the signature motifs of histidine protein kinases, whereas in ETR2, this domain is very diverged from the consensus sequences. Another striking difference among the three proteins is the presence (ETR1 and ETR2) and absence (ERS) of the receiver domain. It is conceivable that the phosphoryl group from the histidine kinase domain may be transferred to the receiver domain of the same protein or other ethylene receptors or directly to unidentified downstream components. The molar ratio between ethylene receptor proteins with and without the receiver domain, thus, may determine the partitioning of phosphoryl groups between the receptors and downstream components. The presence of unspliced ETR2 RNA, which would lead to the complete deletion of the receiver domain, invites speculation about the importance of the two ethylene receptor classes, one with and another without the receiver domain.
This potential output activity difference among these three proteins, in combination with potential differences in ethylene-binding affinity, may provide a mechanism for fine tuning ethylene responses and may thus explain the maintenance of a family of receptors with apparent redundant function. Alternatively, each gene may have specific activities in certain tissues, giving individual genes separate functions. Enhanced ETR2 expression in petals and ovules suggests a possible tissue-specific function for ETR2. Ubiquitous expression of ETR1 has been shown by RNA blots (7); however, expression of ETR1 or ERS at the cellular level has not been investigated. Further characterization of the ETR1 and ERS expression pattern will determine whether there are tissue-specific expression patterns for these three genes. Moreover, isolation of loss-of-function mutants for these genes will help us to understand how these genes are involved in ethylene perception in Arabidopsis.
Acknowledgments
The ethyl methanesulfonate-mutagenized M2 seeds were provided by I. Raskin (Rutgers University). We thank X. Chen, J. Fletcher, T. Ito, S. Jacobsen, P. Kumar, C. Ohno, K. Roberg, R. Sablowski, D. Wagner, E. Ziegelhoffer, and members of Bleecker laboratory for comments on this manuscript. This work was supported by U.S. Department of Energy Grants 88ER13873 to E.M.M. and 91ER20029 to A.B.B.
ABBREVIATION
- cM
centimorgan
Footnotes
Data deposition: The sequence reported in this paper has been deposited in the GenBank database (accession no. AF047975).
References
- 1.Abeles F B, Morgan P W, Saltveit M E., Jr . Ethylene in Plant Biology. 2nd Ed. New York: Academic; 1992. [Google Scholar]
- 2.O’Donnell P J, Calvert C, Atzorn R, Wasternack C, Leyser H M O, Bowles D J. Science. 1996;274:1914–1917. doi: 10.1126/science.274.5294.1914. [DOI] [PubMed] [Google Scholar]
- 3.Penninckx I A, Eggermont K, Terras F R, Thomma B P, De Samblanx G W, Buchala A, Metraux J P, Manners J M, Broekaert W F. Plant Cell. 1996;8:2309–2323. doi: 10.1105/tpc.8.12.2309. [DOI] [PMC free article] [PubMed] [Google Scholar]
- 4.Ecker J R. Science. 1995;268:667–675. doi: 10.1126/science.7732375. [DOI] [PubMed] [Google Scholar]
- 5.Kieber J J, Rothenberg M, Roman G, Feldmann K A, Ecker J R. Cell. 1993;72:427–441. doi: 10.1016/0092-8674(93)90119-b. [DOI] [PubMed] [Google Scholar]
- 6.Bleecker A B, Estelle M A, Somerville C, Kende H. Science. 1988;241:1086–1089. doi: 10.1126/science.241.4869.1086. [DOI] [PubMed] [Google Scholar]
- 7.Schaller G E, Bleecker A B. Science. 1995;270:1809–1811. doi: 10.1126/science.270.5243.1809. [DOI] [PubMed] [Google Scholar]
- 8.Chang C, Kwok S F, Bleecker A B, Meyerowitz E M. Science. 1993;262:539–544. doi: 10.1126/science.8211181. [DOI] [PubMed] [Google Scholar]
- 9.Parkinson J S, Kofoid E C. Annu Rev Genet. 1992;26:71–112. doi: 10.1146/annurev.ge.26.120192.000443. [DOI] [PubMed] [Google Scholar]
- 10.Hua J, Chang C, Sun Q, Meyerowitz E M. Science. 1995;269:1712–1714. doi: 10.1126/science.7569898. [DOI] [PubMed] [Google Scholar]
- 11.Chao Q, Rothenberg M, Solano R, Roman G, Terzaghi W, Ecker J R. Cell. 1997;89:1133–1144. doi: 10.1016/s0092-8674(00)80300-1. [DOI] [PubMed] [Google Scholar]
- 12.Chen Q G, Bleecker A B. Plant Physiol. 1995;108:597–607. doi: 10.1104/pp.108.2.597. [DOI] [PMC free article] [PubMed] [Google Scholar]
- 13.Chang C, Bowman J L, Dejohn A W, Lander W S, Meyerowitz E M. Proc Natl Acad Sci USA. 1988;85:6856–6860. doi: 10.1073/pnas.85.18.6856. [DOI] [PMC free article] [PubMed] [Google Scholar]
- 14.Bell C J, Ecker J R. Genomics. 1994;19:137–144. doi: 10.1006/geno.1994.1023. [DOI] [PubMed] [Google Scholar]
- 15.McBride K E, Summerfelt K R. Plant Mol Biol. 1990;14:269–276. doi: 10.1007/BF00018567. [DOI] [PubMed] [Google Scholar]
- 16.Fraley R T, Rogers S G, Horsch R B, Eichholtz D A, Flick J S, Fink C L, Hoffman N L, Sanders P R. Bio/Technology. 1985;3:629–635. [Google Scholar]
- 17.Bechtold N, Ellis J, Pelletier G. C R Acad Sci Ser III. 1993;316:1194–1199. [Google Scholar]
- 18.Crawford N M, Campbell W H, Davis R H. Proc Natl Acad Sci USA. 1986;83:8073–8076. doi: 10.1073/pnas.83.21.8073. [DOI] [PMC free article] [PubMed] [Google Scholar]
- 19.Sullivan M L, Carpenter T B, Vierstra R D. Plant Mol Biol. 1994;24:651–661. doi: 10.1007/BF00023561. [DOI] [PubMed] [Google Scholar]
- 20.Drews G N, Bowman J L, Meyerowitz E M. Cell. 1991;65:991–1002. doi: 10.1016/0092-8674(91)90551-9. [DOI] [PubMed] [Google Scholar]
- 21.Sakai H, Medrano L J, Meyerowitz E M. Nature (London) 1995;378:199–203. doi: 10.1038/378199a0. [DOI] [PubMed] [Google Scholar]
- 22.Roman G, Lubarsky B, Kieber J J, Rothenberg M, Ecker J R. Genetics. 1995;139:1393–1409. doi: 10.1093/genetics/139.3.1393. [DOI] [PMC free article] [PubMed] [Google Scholar]
- 23.Wilkinson J Q, Lanahan M B, Yen H C, Giovannoni J J, Klee H J. Science. 1995;270:1807–1809. doi: 10.1126/science.270.5243.1807. [DOI] [PubMed] [Google Scholar]
- 24.Weigel D, Alvarez J, Smyth D R, Yanofsky M F, Meyerowitz E M. Cell. 1992;69:843–859. doi: 10.1016/0092-8674(92)90295-n. [DOI] [PubMed] [Google Scholar]
- 25.Smyth D R, Bowman J L, Meyerowitz E M. Plant Cell. 1990;2:755–767. doi: 10.1105/tpc.2.8.755. [DOI] [PMC free article] [PubMed] [Google Scholar]


