Abstract
This study involved the design and validation of a new Lyme disease risk assessment instrument. The study was funded in part by a research grant from the American Health Information Management Association (AHIMA) Foundation on Research and Education (FORE). The resulting instrument measured theoretical constructs such as attitudes, behaviors, beliefs, skills, and knowledge relative to Lyme disease. The survey assessment tool is described here, and the tool development process, the validation and reliability process, and results are presented.
The assessment tool was created by using a standard instrument development process that first involved constructing possible items (questions) based on several health behavior theories and known health risk behaviors. These items were then further refined by using focus groups, a small pilot study, factor analysis, and a large-scale pilot study. Validity and reliability indices were established with a test-retest reliability coefficient of .66, and finally the tool was used among a population living in a Lyme-disease-endemic area. Cronbach's alpha coefficients of .737 for behavioral items, .573 for cognitive items, and .331 for environmental items were established.
Introduction
This article describes the development of a tool for Lyme disease risk assessment that is intended to assist in achieving national public health goals related to Lyme disease prevention. The Healthy People 2010 plan of the United States Department of Health and Human Services sets a goal to reduce the Lyme disease incidence in endemic states from 17.4 cases per 100,000 people to 9.7 cases per 100,000 people by 2010, a 44 percent reduction.1 A thorough literature search of the Internet and major databases including Web of Science, CINAHL, ERIC, PsychInfo, BIOSIS, and LISA revealed no comprehensive self-administered Lyme disease risk assessment instrument in existence for which reliability and validity indices were available. The establishment of a single valid and reliable instrument for the assessment of Lyme disease risk may provide valuable data toward developing prevention strategies to reach the Healthy People 2010 goal of reducing Lyme disease incidence in endemic areas by 44 percent.
Background
Gregory Poland provides an analysis of research literature regarding risk factors and prevention efforts.2 Several factors have been determined to be particularly relevant, including environmental risk, occupational risk, and behavioral risk. These factors are consistent with information provided by the Centers for Disease Control and Prevention (CDC).3 Environmental factors that affect risk include tick density and tick-human interaction. The research shows that while tick density was found to be lower in developed areas than in wooded or farm areas, human exposure to infected ticks occurred most often in residential areas. The presence of leaf litter and other tick habitats in residential areas is associated with the risk of contacting Lyme disease. According to the CDC, behavioral risk factors include spending more than five hours per week on trails, cutting wood, spending more than 30 hours per week outdoors, and engaging in outdoor nonhiking activities.4,5 While literature on the development of specific Lyme disease instruments is lacking, Pett, Lackey, and Sullivan discussed the development of health assessment tools generally.6 They demonstrate the use of factor analysis in this process and argue that the ability to develop valid and reliable health-related instruments is essential if health care interventions are to be evidence based.
Robert Devillis describes the steps needed to develop measurement scales.7 These steps parallel the steps taken to develop the AIDS Attitude Scale (AAS) as described by Shrum, Turner, and Bruce.8 The steps include (1) determining what is to be measured, (2) generating an item pool, (3) having experts review the item pool, and (4) administering the scale to a sample of subjects and subsequently evaluating the results through the use of statistical techniques such as correlation, items means (mean score for each question), factor analysis, and Cronbach's alpha.
Aday delineates other important aspects of instrument development such as informed consent, question formulation, and sampling techniques. Aday also discusses formatting of questions about demographics, behavior, knowledge, and attitudes.9
Theoretical Constructs
The development of the assessment tool for Lyme disease relied on diffusion theory (with regard to innovator/adopter types), risk perception theory, and the Health Belief Model. Other specific risk behaviors identified by the CDC were also included in the survey development.
Everett Rogers's work in diffusion theory is well known across many disciplines.10,11,12 Diffusion is defined as the process by which an innovation is spread throughout a social system over time. An innovation is an idea, a practice, or an object that is perceived as new. According to diffusion theory, specific characteristics of an innovation as it interacts with the social system and the distribution of the type of innovators in the population determine the rate of adoption of the innovation.13 Because the use of new technology by communities and individuals may be important in the prevention of Lyme disease, it was essential to measure innovator/adopter characteristics of the population.
By contrast, Slovic discusses the perception of being at risk.14 He writes about insurance decisions and the framing of outcomes, noting that individuals are more likely to act in a protective manner if they believe themselves to be at risk. Witte, Meyer, and Martell, following in the tradition of the Health Belief Model, further described risk perception in the Extended Parallel Process Model (EPPM) initially developed by Leventhal, suggesting that individuals make two types of risk appraisals.15,16,17 First, individuals determine whether the health risk is relevant to them personally. Second, if the individuals' perceived susceptibility or the severity of the risk is low, the individuals may ignore the risk. However, if their perceived susceptibility or the severity of the risk is judged to be high enough, the individuals will be motivated to mitigate the health risk.
Items in the assessment tool developed for the research presented here were based on Effective Health Risk Messages by Witte, Meyer, and Martell.18 The objective of the research presented here was to develop a valid and reliable assessment tool to aid in the derivation of an educational diagnosis as required by the PRECEDE (Predisposing, Reinforcing, and Enabling Constructs in Educational Diagnosis and Evaluation)-PROCEED (Policy, Regulatory, and Organizational Constructs in Educational and Environmental Development) model of public health planning.19 In order to develop an educational diagnosis, it is important to measure constructs such as attitudes, behaviors, beliefs, skills, and knowledge.
During this research it was found that preventative behavior was associated with more factors than perceived susceptibility and perceived severity. These additional factors included Lyme disease knowledge, self-efficacy in undertaking Lyme disease prevention measures, response efficacy, beliefs, attitudes, observation of others, communication with others, and willingness to use innovation and learned skills.
Methodology
This study involved the design and validation of a new Lyme disease risk assessment instrument. The methodology used in the study was based on the development of a similar assessment tool for HIV/AIDS risk reduction, the AIDS Attitude Scale (AAS), which was developed using the aforementioned steps.20For this study, the following process was used: (1) an exploratory phase and development of items, (2) validity analysis, (3) test-retest reliability analysis, (4) a large-scale pilot study, and (5) final use in a Lyme-disease-endemic area.
Criteria for Inclusion
To conduct this research, the researcher obtained a list of eligible students from the registrar of a college in a Lyme-disease-endemic area. Inclusion criteria required being an undergraduate over the age of 18 and living either on campus or in Bucks County or Montgomery County in Pennsylvania. Students could not participate more than once in the research and could not have been enrolled in a program that was administered by the researcher or have been a student in a class taught by the researcher. The eligible individuals were provided packets and were requested to complete the consent form and the assessment tool and deposit them in drop boxes located in designated buildings on campus. If an individual participated in any segment of the research, he or she was ineligible to participate in other segments. For example, a participant could be in only one focus group, and participants completed assessment tools only once. The only exception to this was that participants in the test-retest segment completed the assessment tool twice in order to determine the test-retest correlation.
Development of the Item Pool
The survey included items developed based on a review of the literature, items that addressed the theory being measured by the research, and items used in similar research. The assessment instrument that was used initially was composed of three parts. Part 1 consisted of demographic items. Part 2 consisted of forced-choice items. The first items in this part, which dealt with diffusion theory and the individual's status as an early or late innovator/adopter, were adapted from the work of Peoples-Lee.21 The remaining two forced-choice items asked about time spent in activities that could be considered behavioral risks and were included after focus group discussion. Part 3 represented items gleaned from the literature, including Effective Health Risk Messages (Witte, Meyer, and Martell) and CDC recommendations. These items represented cognitive, behavioral, and environmental factors related to Lyme disease. To the extent possible, both positively worded and negatively worded items were used. Eleven items were randomly arranged into a Likert scale that ranged from Frequently to Never. The remaining 11 items were also randomly arranged in a Likert scale that ranged from Strongly Agree to Strongly Disagree.
Focus Groups
After the draft assessment tool was developed, three focus groups were held to explore the comprehensiveness of the instrument and to assess its length, clarity, interpretation, scales, and readability. Focus group participants were solicited by the researcher by calling the individuals and requesting that they be part of the groups. Every attempt was made to have a range of educational levels, ages, racial groups, and occupations.
Two focus groups were conducted with students from the college (11 total participants), and the third focus group consisted of faculty and staff (6 participants). Following each focus group session, the instrument was refined prior to use with the subsequent focus group. During the focus group sessions, participants were asked about the scales to determine preferences for any particular scale This was done so that the issues with format that could impact usability were considered.
Validity Analysis
Initially a pool of 39 items (excluding demographic questions) was created. Two Lyme disease experts were asked to participate in the development process by evaluating and revising items to improve their validity and decrease ambiguity. The experts rated the items for relevance on a scale of 1 to 5, with 1 being very relevant and 5 being not relevant. The validity indices resulted in an average validity measure of 1.2 per item on the 5-point scale.
Reliability Analysis Using Test-Retest Method
Reliability of the survey tool was established via two approaches. First, the test-retest method was used to assess consistency across time. For this assessment, a sample of 28 respondents was needed to achieve a large effect size at the .05 level of significance as defined by Cohen.22 A convenience sample of undergraduate students residing in a Lyme-disease-endemic area was asked to complete the instrument. The researcher visited classrooms of potential volunteers and requested students' participation in the reliability segment of the research. Information regarding the research project and a consent form were provided to students.
The test-retest reliability analysis was undertaken with 34 of roughly 70 recruited undergraduate students. These 34 students completed both the initial administration of the tool and the second administration approximately two to three weeks later. Twelve students completed the initial administration but did not complete the second. The questions were evaluated for stability over time for continued use in the assessment tool. The overall test-retest correlation was found to be 0.66. (Detailed results are presented below.) The second reliability assessment, which is discussed in more detail below, established the internal consistency of the instrument within three categories-cognitive, behavioral, and environmental-and was conducted in the final phase of the research using factor analysis and by computing Cronbach's alpha for these categories.
Factor Analysis of Large-Scale Pilot Study Data
A large-scale pilot study was conducted during January and February of the 2003-2004 academic year to determine whether any items should be removed from the assessment tool and to explore the underlying relationships between items in the tool. Participants in this part of the study included undergraduates 18 years or older who either resided on a college campus located in a Lyme-disease-endemic environment or lived off campus in an endemic county. In addition, these individuals had not participated in any previous focus group, small pilot study, or reliability sample. There were approximately 1,800 students in the student body at the time this research was conducted, and 743 students received packets. Participant responses were analyzed using factor analysis with Varimax rotation and Kaiser normalization, as described by Pett, Lackey, and Sullivan.23 Analysis resulted in 12 factors and the removal of four items from the tool.
Use of the Survey Tool with a Population at Risk for Lyme Disease
The refined assessment tool was used in the final phase of the study with adults who worked at a college in a Lyme-disease-endemic area. During the last research phase, approximately 450 employees (all full-time or part-time faculty or staff of the college) were asked to complete the assessment tool during March of the 2003-2004 academic year.
The potential participants were each sent a packet through interoffice mail to their work mailbox that contained a cover letter, the instrument, a consent form, a numbered ticket for a drawing for an American Express gift certificate, and five dollars in cash. The cover letter explained the purpose of the study and was the primary means of recruiting participants. The letter also explained that in order to keep the participants' identities confidential, everyone who was eligible was sent a packet. Further, the letter notified participants that if they did not wish to participate, they had no obligation to do so and were free to keep the five dollars. This process was designed to ensure confidentiality of both participants and nonparticipants. The packets resulted in 223 responses (approximately 50 percent of those who received packets). Summary descriptive statistics were tabulated, and internal consistency measures were computed. Factor analysis was performed, and results were compared with the factor analysis and statistical results found in the large-scale pilot testing phase.
Results
Table 1 provides a summary of each phase as well as the number of participants in each segment of the research. The types of results vary according to the purpose of the section. Overall, the various phases contributed to determining the validity and reliability of the instrument as well as the appropriate items for inclusion.
Table 1.
Summary of Research Phases and Results
| Research Phase | Number of Participants | Method(s) Used | Results |
|---|---|---|---|
| Item development | NA | Review of literature | Initial item pool developed |
| Validity analysis | 2 | Review by Lyme disease experts | Average validity measure of 1.2 (1 being very relevant, 5 being not at all relevant) |
| Focus groups | 11 students; 6 faculty/staff | Student focus groups (2); faculty/staff focus group (1) | Refinement of assessment tool |
| Reliability analysis | 34 | Test-retest method | Test-retest correlation of 0.66 |
| Large-scale pilot study | 333 | Factor analysis | 12 factors derived accounting for 66% of the variance; elimination of items not associated with a factor |
| Use of assessment tool in a Lyme-disease-endemic area | 223 | Computation of summary statistics and internal reliability measures; factor analysis | 11 factors derived accounting for 66% of the variance |
Development of Item Pool, Analysis of Validity, and Focus Group Refinement
The initial survey instrument was evaluated by Lyme disease experts, who assigned a validity average of 1.2 with 1 being very relevant and 5 being not at all relevant. After the validity evaluation, modifications were made based on the experts' suggestions. Three separate focus groups were convened, and modifications were made to the assessment tool between focus group sessions. The purpose of the focus groups was to explore comprehensiveness of the instrument and to assess its length, clarity, interpretation, scales, and readability.
The assessment instrument was modified as follows based on focus group suggestions. Part 1, which consisted of demographic items, remained the same through all revisions. Part 2 consisted initially of two forced-choice items but was expanded to include two more based on feedback from the focus groups as noted above. These first items dealt with diffusion theory and the individual's status as an early or late innovator/adopter. The next forced-choice items asked behavioral risk questions related to time spent in activities. The activity questions were modified based on focus group suggestions. The wording of several of the questions in Part 3 was also refined to improve readability based on testing in focus groups.
Reliability Analysis
A reliability analysis with 34 students was undertaken for all questions using the appropriate statistic based on the scale used in the question. Kendall's tau-b was used for questions 9-30 because the scale included zero, potentially skewing the correlation if another type of correlation calculation was used. The Pearson correlation coefficient was used for questions 31-53 because the scale was considered continuous. The first criterion for retaining questions was a correlation coefficient significant at the .01 level. If an item met that criterion, a cross-tab analysis was undertaken. If the cross-tab analysis revealed that the item had 76 percent or more responses on the retest with either the same answer or an answer only one level above or below the original response, the item was retained. Based on the reliability analysis, two questions were deleted based on the lack of stability. These were questions 15 and 22 (see Table 2). Beyond the demographic and forced-choice items, the items in the iteration of the assessment tool used in the test-retest reliability analysis contained items numbered 11 through 53. Item 11 contained two parts during the reliability analysis, but these sections were combined later in the development of the assessment tool. The overall test-retest reliability coefficient was found to be .66.
Table 2.
Test-Retest Reliability Summary
| Item Used in Test-Retest Analysis | Correlation Coefficient |
|---|---|
| 11A. On average, I spend the following number of hours in my yard at my home (where the primary residence is) each week during the spring and summer months. | tau b.723** |
| 11B. On average, I spend the following number of hours in my yard at my vacation home or other residence (other home or vacation home) each week during the spring and summer months. | tau b.564** |
| 12. On average, I spend the following number of hours hiking, fishing, or participating in outdoor activities in the woods per week during the spring and summer months. | tau b .84; cross-tab 94% |
| 13. I tuck my pants into my socks when I work in my yard. | tau b .609** |
| 14. I have read information about Lyme disease in the newspaper. | tau b .586** |
| 15. A health professional has given me information about Lyme disease. | tau b .333*; cross-tab 71% |
| 16. I use tick repellent when I work in my yard (for example, mow the lawn, trim hedges, garden, etc.). | tau b .556** |
| 17. I have seen information about Lyme disease on the Internet. | tau b .350*; cross-tab 76% |
| 18. I see deer on or near the property where I live. | tau b .682** |
| 19. I wear light-colored clothing when I hike, fish, or participate in outdoor activities in the woods. | tau b .459** |
| 20. I use tick repellent when I hike, fish, or participate in outdoor activities in the woods. | tau b .524** |
| 21. I have seen my family or friends tuck pant legs into their socks to prevent Lyme disease. | tau b .653** |
| 22. I have seen information about Lyme disease at a health fair. | tau b .281; cross-tab 74% |
| 23. I have seen information about Lyme disease on television. | tau b .568** |
| 24. I check my body for ticks after I work in my yard. | tau b .779** |
| 25. Do you work at a job that is outdoors? | tau b 1.00** |
| 26. I use tick repellent at my job when I work outdoors. | tau b .802; cross-tab 100% |
| 27. I wear light-colored clothing at my job when I work outdoors. | tau b .252; cross-tab 80% |
| 28. I check my body for ticks at my job after I work outdoors. | tau b .943*; cross-tab 100% |
| 29. I work in my yard (for example, mow the lawn, trim hedges, garden, etc.). | tau b .817** |
| 30. I have a job that requires me to work outdoors. | tau b .639** |
| 31. I do not know how to recognize the early signs of Lyme disease. | Pearson .650** |
| 32. Recognizing the early signs of Lyme disease is important in order to treat Lyme disease when it occurs. | Pearson .350*; cross-tab 97% |
| 33. I know how much Lyme disease occurs in the area where I live. | Pearson .757** |
| 34. I am not at risk to get Lyme disease. | Pearson .411*; cross-tab 82% |
| 35. I know how to wear clothing that will make it easy to detect ticks. | Pearson .749** |
| 36. Undertaking tick checks after leaving tick habitat will prevent Lyme disease. | Pearson .506** |
| 37. Lyme disease is serious. | Pearson .692** |
| 38. I know where to get information about Lyme disease prevention. | Pearson .758** |
| 39. I do not know how to recognize the habitat where ticks live. | Pearson .552** |
| 40. I am able to use an insect repellent effectively. | Pearson .655** |
| 41. I am not easily able to detect deer ticks on my body. | Pearson .333; cross-tab 76% |
| 42. Using insect repellent with DEET (diethyl-m-toluamide) will prevent contracting Lyme disease. | Pearson .382*; cross-tab 91% |
| 43. I know how to recognize the habitat where ticks live. | Pearson .623** |
| 44. No matter what I do, I will get Lyme disease. | Pearson .231; cross-tab |
| 97% | |
| 45. I am not easily able to detect unusual rashes and a bull's-eye rash if it occurs on my body. | Pearson .486** |
| 46. Lyme disease is not serious. | Pearson .486** |
| 47. Avoiding tick habitats will prevent Lyme disease. | Pearson .483** |
| 48. Lyme disease is easy to get. | Pearson .615** |
| 49. I know how much Lyme disease occurs in the area where I work. | Pearson .757** |
| 50. Being alert to a “bull's-eye” rash will allow early diagnosis and treatment of Lyme disease. | Pearson .442** |
| 51. Several of my neighbors have had Lyme disease. | Pearson .692** |
| 52. I am at risk to get Lyme disease. | Pearson .711** |
| 53. How much money would you be willing to spend annually to prevent Lyme disease in your household? (please specify a dollar figure) | Pearson .700** |
Significant at the .001 level
Significant at the .05 level
Factor Analysis in the Large-Scale Pilot Study
During the large-scale pilot phase, 743 packets were distributed to potential participants. Of these packets, 333 (45 percent) were returned and used for the factor analysis. Factor analysis was undertaken for the purpose of reducing the number of items by eliminating items not found to be associated with a factor. Twelve factors accounting for 66 percent of the variance were derived from the factor analysis. Principal component analysis and principal axis analysis with Varimax rotation and Kaiser normalization were performed. The factor analysis revealed one question that was not associated with factors when both principal component analysis and principal axis analysis were done; thus, that question was eliminated from the assessment tool.
Generally, items with rotated factor loadings of .40 or higher were used to determine the factors. As discussed above, questions about prevention behaviors associated with an outdoor job were also removed because they were dependent on the initial question of whether or not the respondent had an outdoor job. This question structure does not allow meaningful factor analysis for the questions that are dependent upon whether or not the respondent had an outdoor job. Further, the risk factor is whether or not the respondent has an outdoor job, rather than any other behaviors beyond working outdoors.
As a result of all modifications, Part 1 of the assessment tool consisted of eight demographic items based on the format used by the United States Department of Commerce Bureau of the Census Short Form. Part 2 consisted of four forced-choice items, two of which dealt with diffusion theory and the individual's status as an early or late innovator/adopter and were adapted from the work of Peoples-Lee.24The remaining two forced-choice items asked about time spent in activities that could be considered behavioral risks and were included after focus group discussion. Part 3 consisted of 34 questions that represented items gleaned from the literature, including Effective Health Risk Messages (Witte, Meyer, and Martell) and CDC recommendations. These items represented cognitive, behavioral, and environmental factors related to Lyme disease.
Use of the Assessment Tool in a Lyme-Disease-Endemic Area
An analysis of the demographic information of the 223 respondents in the final phase revealed a mean age of 48.4 years. The mode was age 57. The majority was white (81.4 percent) and lived in Lyme-disease-endemic counties (86.5 percent) in Pennsylvania. Of the sample, 72.5 percent were female, and 54 percent had an educational level of bachelor's degree or higher.
The second reliability assessment was undertaken during this phase to assess the internal consistency of the instrument within each of the factors and in the three general categories of items: cognitive, behavioral, and environmental. Factor analysis was completed using principal component analysis with Varimax rotation. The pattern of factor loadings was examined, and, generally, a cutoff point of .40 was used in assigning items to factors. There were two instances in which items with factor loadings below .40 were kept. These questions, with factor loadings of .384 and .291, were retained because the underlying theory they represented was felt to be associated with the other constructs in the factor. Eleven factors were extracted and rotated. The total variance explained by the factors was 66 percent. An attempt was made to name each factor as is suggested in statistical theory.25 Internal consistency of the tool by factor and type of question was determined using Cronbach's alpha. Table 3 provides the results of this analysis.
Table 3.
Cronbach's Alpha Reliability Coefficients Using Factors
| Factor | Number of Items | Cronbach's Alpha |
|---|---|---|
| 1 | 9 | .8652 |
| 2 | 8 | .5276 |
| 3 | 4 | .6370 |
| 4 | 2 | .6078 |
| 5 | 2 | .5831 |
| 6 | 3 | .3660 |
| 7 | 2 | .3503 |
| 8 | 2 | .2841 |
| 9 | 2 | .3214 |
| 10 | 2 | .1870 |
| 11 | 2 | .0111 |
Discussion
The major goal of this research was to develop a valid and reliable tool for the assessment of Lyme disease risk that could be used to help prevent Lyme disease. This goal was accomplished.
Factor analysis was useful in demonstrating which factors were consistently derived during the large-scale pilot phase and the final phase. The following factors were consistently derived:
knowledge-related constructs
perceived severity constructs
behavioral risk
constructs associated with ticks
constructs related to preventive actions
fatalism (“No matter what I do, I will get Lyme disease”) and environmental risk
In terms of test-retest reliability, it is recommended that the coefficient be .70 or higher.26 However, there are many new health-related instruments that do not meet this level.27 The test-retest reliability coefficient of .66 found in this study is within the general range of coefficients associated with many new health-related instruments in the scientific literature. For example, the test-retest coefficient for a suicide screening instrument, determined after an eight-day interval, was .32.28 Another instrument, a screen for anxiety-related emotional disorders in children, had a test-retest reliability coefficient of .47 with a six-month interval between administrations.29 An anxiety rating scale for pediatric patients was found to have a test-retest reliability of .55.30
Internal consistency or internal reliability measures ranged from .0111 to .8652 when using the constructs within the factors and from .3308 to .7365 when using the items grouped by question types. (See Table 3 and Table 4.) It is noteworthy that the five highest-ranking factors each had a reliability coefficient of .50 or higher. In terms of the reliability coefficients obtained by grouping questions together, ideally Cronbach's alpha should be above .70 to insure that an instrument has internal consistency.31 In this regard, more work should be undertaken to determine the reasons for the lack of internal consistency to improve the Cronbach's alpha.
Table 4.
Cronbach's Alpha Reliability Coefficients by Type of Question
| Question Type | Number of Items* | Cronbach's Alpha |
|---|---|---|
| Behavioral | 6 | .7365 |
| Cognitive | 23 | .5732 |
| Environmental | 3 | .3308 |
Note that only 32 of the 33 items were used. One of the items had a dichotomous answer and was not used in the analysis.
The low reliability coefficients obtained when grouping questions together may be due to the variety of scales and constructs used within each of the general categories. Generally, the reliability coefficient measures homogeneity of items, and some of the constructs within categories were not homogeneous in this study. For example, the items measuring environmental aspects of Lyme disease prevention include very different constructs, such as “I see deer on or near the property where I live” and “Several of my neighbors have had Lyme disease.” Similarly, the behavior-related category also has a broad range of items within it. Behavioral items include questions about the number of hours the individual spends in the yard and whether the individual follows preventative behaviors recommended by the CDC. While the lack of homogeneity of constructs is likely a large reason for the low Cronbach's alpha, it is still important to undertake further evaluation to determine if the Cronbach's alpha could be improved.
Limitations
The study was undertaken in one geographic location in the United States, and the ability to generalize the findings has not been established. As discussed by Pett, Lackey, and Sullivan, it is optimal to have at least 10 participants for each item in the assessment tool or use a minimum of 300 participants for similar studies.32 This being the case, the final phase of the research should have had at least 300 participants instead of 223. The behavior represented in this research is self-reported and may therefore have variation in accuracy. And, finally, the research was conducted with a convenience sample based on those students and staff who were available to participate in the assessment tool development. It is not known how using a convenience sample may have skewed the results. Ideally, it is better to have a random sample for any study, but in this case all of the participants available were needed in order to have the minimum number of participants necessary for factor analysis.
Conclusions
Several conclusions can be drawn from the results of this research. The Lyme disease risk assessment tool developed during this research, while new, is based on relevant prevention and risk theories for which there are reliability and validity indices. Further, the assessment tool provides useful information for designing Lyme disease education and public health interventions for the individuals in a Lyme-disease-endemic area.
While the test-retest reliability of the items within the assessment tool is acceptable, more work should be conducted to further evaluate the tool and, if necessary, increase its internal reliability as measured by Cronbach's alpha.
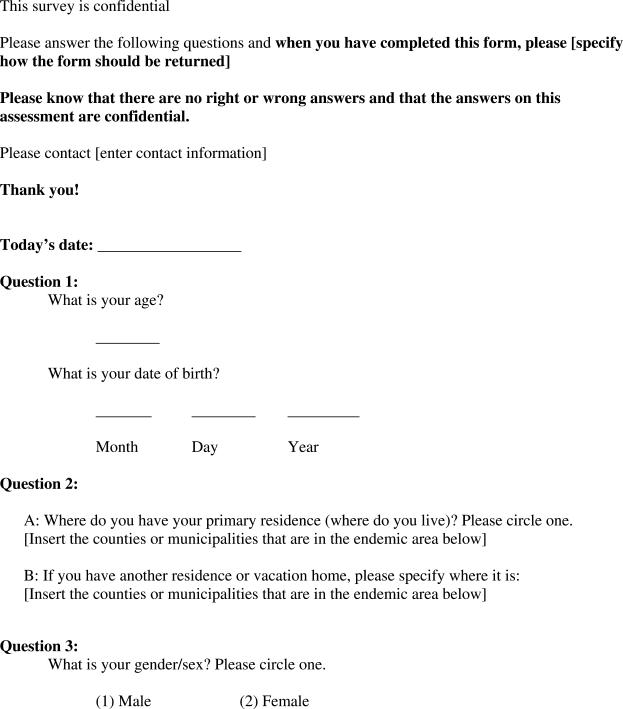
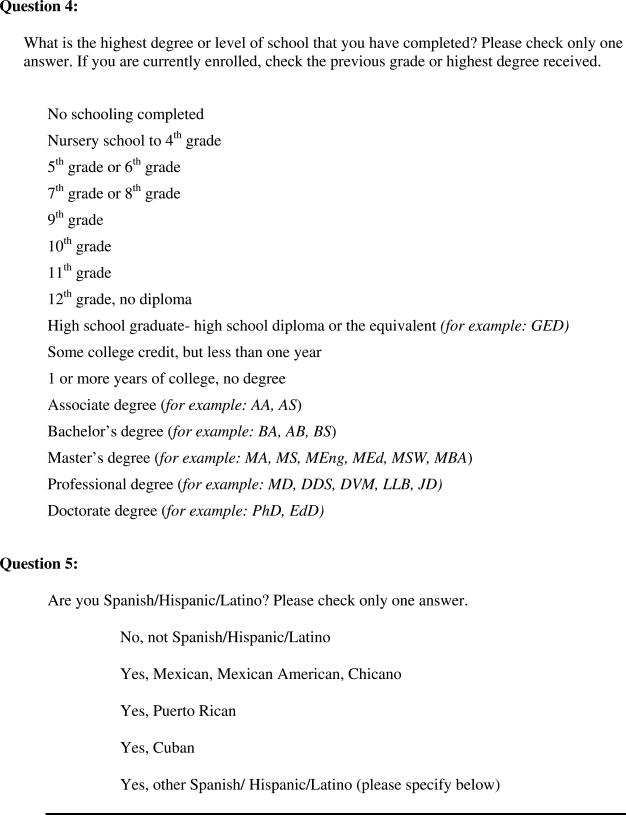
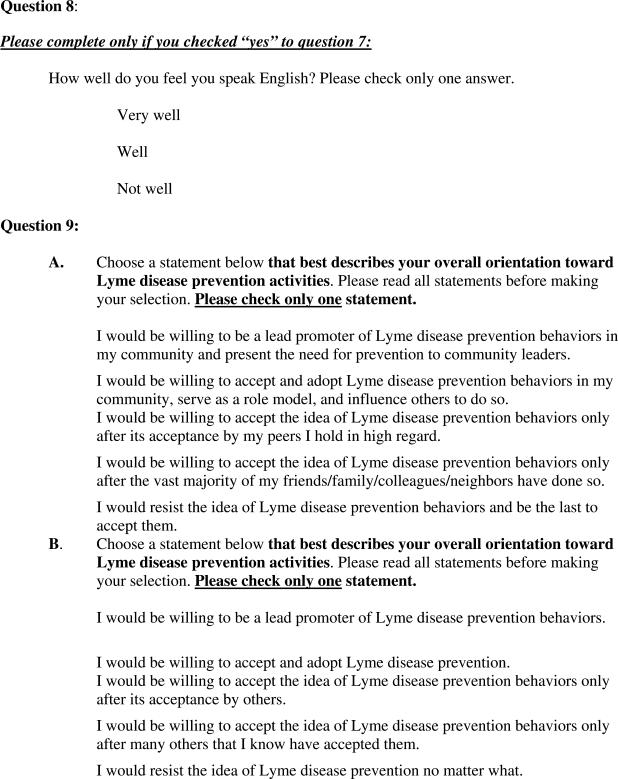
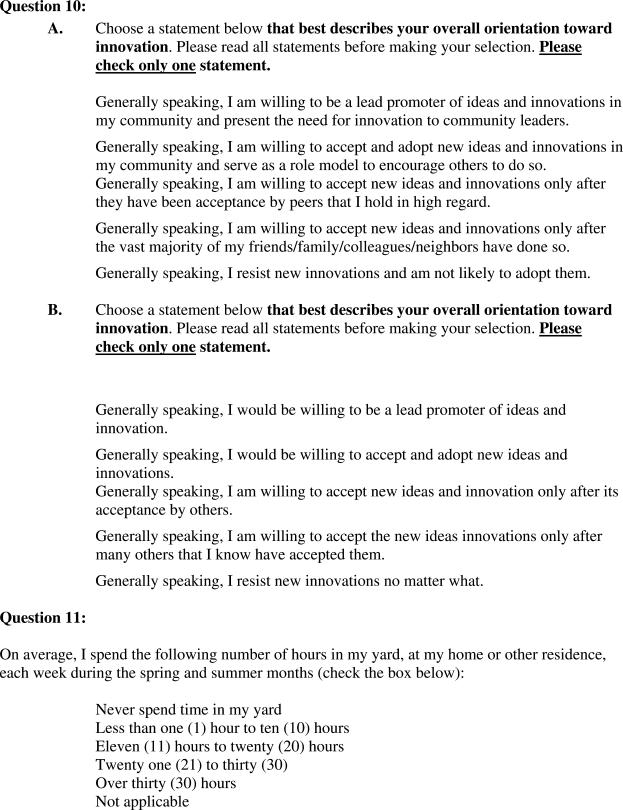
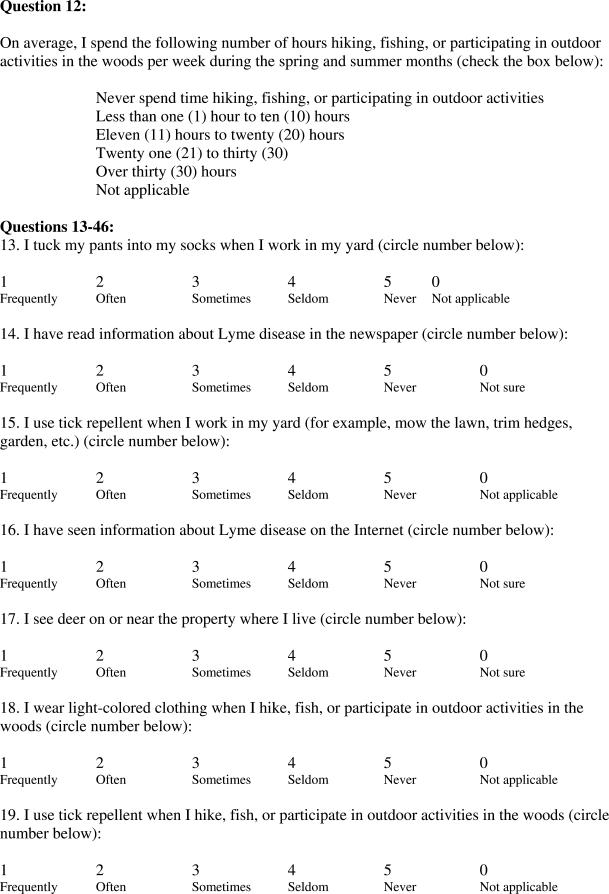
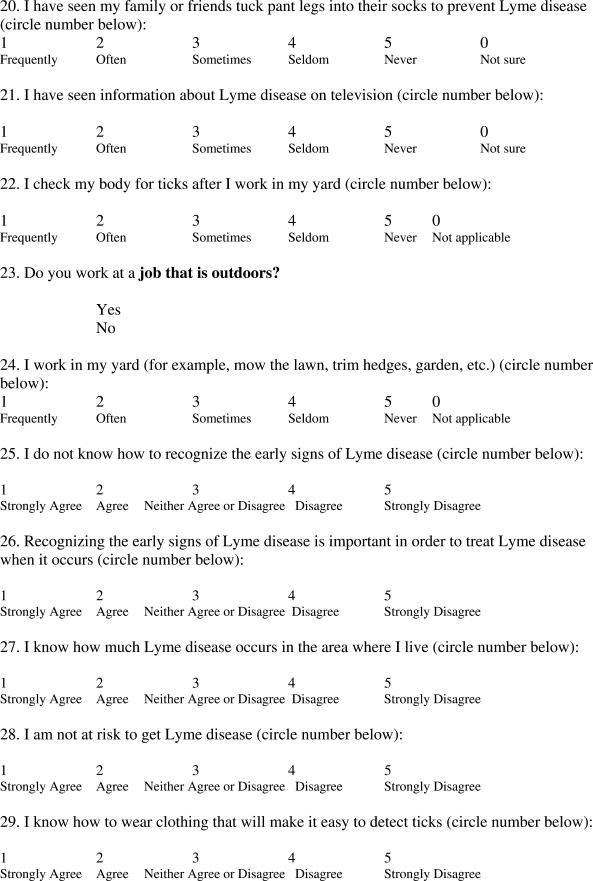
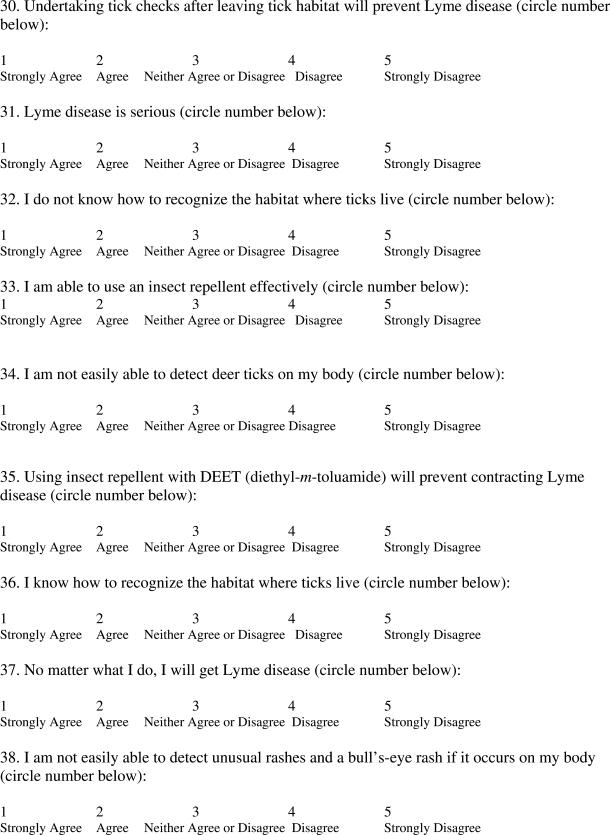
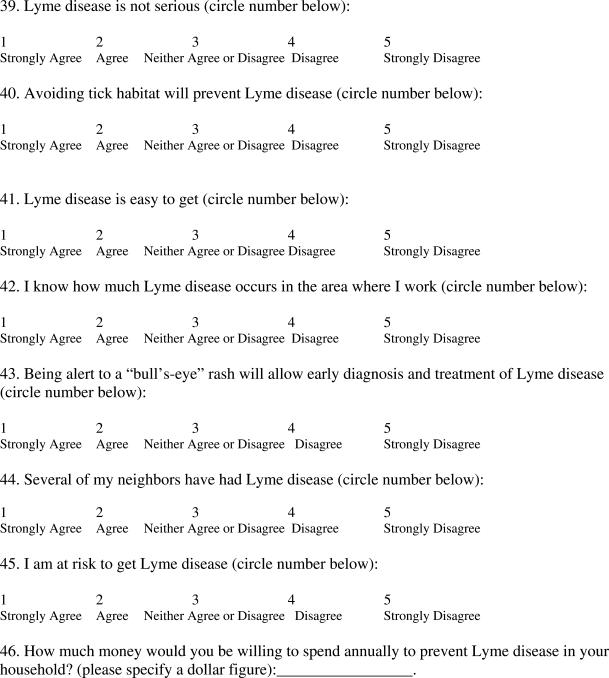
The tool provides potentially useful information about the attitudes, beliefs, risk behaviors, and perceptions about Lyme disease among populations in endemic areas. It may be used with groups of individuals in Lyme-disease-endemic areas to determine an appropriate educational intervention for each group. Any informational intervention can then be tailored to the group's needs. Please see Appendix A for the final version of the assessment tool.
The assessment tool should continue to be refined with a larger sample of people and across a variety of demographic characteristics. Further development and evaluation of the factors associated with this research is also warranted. This study produced different but somewhat similar factors in the large-scale pilot study and in use with a population-based sample, but further factor analysis may prove useful in determining how, if at all, the age, educational levels, gender, race, and other characteristics of participants impact the factors derived.
Using the assessment tool and continuing to research its effectiveness may contribute to our understanding of individuals' assessment of relative risk and aid in refining theoretical models such as diffusion theory and the Health Belief Model for use with environmental health issues. Anecdotal information resulting from the use of the assessment tool in a population living in an endemic area suggests that using the tool may cause some participants to engage in prevention-related activity.
Further, completing the assessment tool may have the implication of encouraging communication about and interest in Lyme disease. Following the use of the assessment tool in the endemic area, many individuals expressed interest in learning more about Lyme disease and expressed their interest and appreciation at being included in the study. Hopefully, the findings of this the study will improve public health prevention efforts relative to Lyme disease. Further work in the development of the assessment tool is certainly warranted, but it is clear that having a valid, reliable tool to aid in the creation of educational interventions to prevent Lyme disease is an important initial step in the process of decreasing the incidence of the disease in endemic areas.
Appendix A
A Public Health Assessment Tool to Prevent Lyme Disease
Contributor Information
Jennifer Hornung Garvin, Veterans Administration in Philadelphia, PA.
Thomas F Gordon, Temple University in Philadelphia, PA.
Clara Haignere, Temple University in Philadelphia, PA.
Joseph P DuCette, at Temple University in Philadelphia, PA.
Notes
- 1.United States Department of Health and Human Services, Office of Disease Prevention and Health Promotion. Healthy People 2010 Available at http://www.health.gov/healthypeople (retrieved March 15, 2002). [PubMed]
- 2.Poland G. A. “Prevention of Lyme Disease: A Review of Literature.”. Mayo Clinic Proceedings. 2001;76:713–24. doi: 10.4065/76.7.713. [DOI] [PubMed] [Google Scholar]
- 3.Centers for Disease Control and Prevention (CDC). “Case Definitions for Infectious Conditions under Public Health Surveillance.” Morbidity and Mortality Weekly Report 46, no. 20. Available at http://www.cdc.gov (retrieved March 17, 2003). [PubMed]
- 4.Centers for Disease Control and Prevention (CDC). “Case Definitions for Infectious Conditions under Public Health Surveillance.”. [Google Scholar]
- 5.Poland, G. A. “Prevention of Lyme Disease.”
- 6.Pett M. A, Lackey N. R, Sullivan J. J. Making Sense of Factor Analysis: The Use of Analysis for Instrument Development in Health Care Research. Thousand Oaks, CA: Sage; 2003. [Google Scholar]
- 7.Devillis, R. Scale Development: Theory and Applications, 2nd ed. Thousand Oaks, CA: Sage.
- 8.Shrum J. C, Turner N. H, Bruce K. E. “Development of an Instrument to Measure Attitudes toward Acquired Immune Deficiency Syndrome.”. AIDS Education and Prevention. 1989;1:222–30. [PubMed] [Google Scholar]
- 9.Aday L. A. Designing and Conducting Health Surveys. 2nd ed. San Francisco: Jossey-Bass; 1996. [Google Scholar]
- 10.Rogers E. M. Diffusion of Innovations. New York: Simon & Schuster; 1995. [Google Scholar]
- 11.Rogers E. M, Shoemaker F. F. Communication of Innovations. New York: Free Press; 1971. [Google Scholar]
- 12.Rogers, E. M., and K. L. Scott. (1997). The diffusion of innovation model and outreach from the national network of libraries of medicine to Native American communities [Electronic version]. Library of Medicine. Retrieved April 19th, 2003 from http://nnlm.gov/pnr/eval/rogers.html
- 13.Rogers, E. M., and K. L. Scott. (1997). The diffusion of innovation model and outreach from the national network of libraries of medicine to Native American communities.
- 14.Slovic P. The Perception of Risk. Sterling, VA: Earthscan; 2000. [Google Scholar]
- 15.Witte K, Meyer G, Martell D. Effective Health Risk Messages: A Step-by-Step Guide. Thousand Oaks, CA: Sage; 2001. [Google Scholar]
- 16.Green, Lawrence W, Ottoson Judith M. Community and Population Health. 8th ed. Boston: WCB/McGraw-Hill; 1999. [Google Scholar]
- 17.Witte, K., G. Meyer, and D. Martell. Effective Health Risk Messages
- 18.Witte, K., G. Meyer, and D. Martell. Effective Health Risk Messages
- 19.Green, Lawrence W., and Judith M. Ottoson. Community and Population Health
- 20.Shrum, J. C., N. H. Turner, and K. E. Bruce. “Development of an Instrument to Measure Attitudes toward Acquired Immune Deficiency Syndrome.” [PubMed]
- 21.Peoples-Lee, D. “Is There a Need for Complementary & Alternative Medicine (CAM) Education? Comparing the Views of Students and Faculty in Various Healthcare Professions.” Presented at the annual meeting of the American Public Health Association, Philadelphia, PA, October 2002.
- 22.Cohen J. Statistical Power Analysis for Behavioral Sciences. rev. ed. New York: Academy Press; 1997. [Google Scholar]
- 23.Pett, M. A., N. R. Lackey, and J. J. Sullivan. Making Sense of Factor Analysis
- 24.Peoples-Lee, D. “Is There a Need for Complementary & Alternative Medicine (CAM) Education? Comparing the Views of Students and Faculty in Various Healthcare Professions.” Presented at the annual meeting of the American Public Health Association, Philadelphia, PA, October 2002.
- 25.Pett, M. A., N. R. Lackey, and J. J. Sullivan. Making Sense of Factor Analysis
- 26.Osborn C. E. Statistical Applications for Health Information Management. Gaithersburg, MD: Aspen; 2000. [Google Scholar]
- 27.Osborn, C. E. Statistical Applications for Health Information Management
- 28.Shaffer D, Scott M, Wilcox H, Maslow C, Hicks R, Lucas C. P, Garfinkel R, Greenwald S. “The Columbia Suicide Screen: Validity and Reliability of a Screen for Youth Suicide and Depression.”. Journal of the American Academy of Child and Adolescent Psychiatry. 2004;43:71–79. doi: 10.1097/00004583-200401000-00016. [DOI] [PubMed] [Google Scholar]
- 29.Boyd R. C, Ginsburg G. S, Lambert S. F, Cooley M. R, Campbell K. D. Journal of the American Academy of Child and Adolescent Psychiatry. Vol. 42. 2003. “Screen for Child Anxiety Related Emotional Disorders (SCARED): Psychometric Properties in an African-American Parochial High School Sample.”; pp. 1188–96. [DOI] [PubMed] [Google Scholar]
- 30.Riddle M, Ginsburg G, Walkup J, Labelarte M, Pine D, Davies M, Greenhill L, et al. The Pediatric Anxiety Rating Scale (PARS): Development and Psychometric Properties.”. Journal of the American Academy of Child and Adolescent Psychiatry. 2002;42:345–63. doi: 10.1097/00004583-200209000-00006. [DOI] [PubMed] [Google Scholar]
- 31.Osborn, C. E. Statistical Applications for Health Information Management
- 32.Pett, M. A., N. R. Lackey, and J. J. Sullivan. Making Sense of Factor Analysis
References
- Allan B. F, Keesing F, Ostfeld R. S. “Effect of Forest Fragmentation on Lyme Disease.”. Conservation Biology. 2003;17:267–72. [Google Scholar]
- Babbie E. The Practice of Social Research. 9th ed. Belmont: Wadsworth/Thompson Learning; 2001. [Google Scholar]
- Harvell C. D, Mitchell C. E, Ward J. R, Altizer S, Altizer A, Dobson R. S, Ostfeld R. S, Samuel M. D. “Climate Warming and Disease Risks for Terrestrial and Marine Biota.”. Science. 2002;296:2158–62. doi: 10.1126/science.1063699. [DOI] [PubMed] [Google Scholar]
- Janz N, Becker M. “The Health Belief Model: A Decade Later.”. Health Education Quarterly. 1984;11:1–47. doi: 10.1177/109019818401100101. [DOI] [PubMed] [Google Scholar]
- Kerlinger F. N, Lee H. B. Foundations of Behavioral Research. Fort Worth, TX: Harcourt College; 2000. [Google Scholar]
- Orloski K. A, Campbell G. L, Genese C. A, et al. Emergence of Lyme Disease in Hunterdon County, New Jersey, 1993: A Case-Control Study of Risk Factors and Evaluation of Reporting Patterns.”. American Journal of Epidemiology. 1998;147:391–97. doi: 10.1093/oxfordjournals.aje.a009462. [DOI] [PubMed] [Google Scholar]
- Ostfeld R. S. “The Ecology of Lyme Disease Risk.”. American Scientist. 1997;85:338–46. [Google Scholar]
- Ostfeld R. S. “Little Loggers Make a Big Difference.”. Natural History. 1997;111:64–71. [Google Scholar]
- Ostfeld R. S, Jones C. G, Wolff J. O. “Of Mice and Mast.”. BioScience. 1996;46:323–30. [Google Scholar]
- Ostfeld R. S, Keesing F. “Biodiversity and Disease Risk: The Case of Lyme Disease.”. Conservation Biology. 2000;14:722–28. [Google Scholar]
- Scheaffer R, Mendenhall W, Ott L. Elementary Survey Sampling. 3rd ed. Boston: Duxbury; 1986. [Google Scholar]
- Shaw M. T, et al. American Journal of Tropical Medicine and Hygiene. Vol. 68. 2003. Factors Influencing the Distribution of Larval Blacklegged Ticks on Rodent Hosts.”; pp. 447–52. [PubMed] [Google Scholar]
- Smith P. F, Benach J. L, White J. D, Stroup D. F, Morse D. L. “Occupational Risk of Lyme Disease in Endemic Areas of New York State.”. Annals of the New York Academy of Science. 1988;539:289–301. doi: 10.1111/j.1749-6632.1988.tb31863.x. [DOI] [PubMed] [Google Scholar]
- Subak S. “The Effects of Climate on Variability in Lyme Disease Incidence in the Northeastern United States.”. American Journal of Epidemiology. 2003;157:531–38. doi: 10.1093/aje/kwg014. [DOI] [PubMed] [Google Scholar]
- Vanderhoof- Forschner K. Everything You Need to Know about Lyme Disease. New York: Wiley; 1997. [Google Scholar]
- Witte K. “The Role of Threat and Efficacy in AIDS Prevention.”. International Quarterly of Community Health Education. 1992;12:225–49. doi: 10.2190/U43P-9QLX-HJ5P-U2J5. [DOI] [PubMed] [Google Scholar]
- Witte K. International and Intercultural Communication Annals. Vol. 16. 1992. “Preventing AIDS through Persuasive Communications: A Framework for Constructing Effective, Culturally-Specific, Preventative Health Messages.”; pp. 67–86. [Google Scholar]
- Witte K. “Fear Control and Danger Control: A Test of the Extended Parallel Process Model (EPPM).”. Communication Monographs. 1994;61:113–34. [Google Scholar]
- Witte K. The Handbook of Communication and Emotion. New York: Academic Press; 1998. “Fear as a Motivator, Fear as Inhibitor: Using the EPPM toExplain Fear Appeal Successes and Failures.”. [Google Scholar]
- Witte K, Berkowitz J, Lillie J, Cameron K, Lapinski M. K, Liu W. Y. “Radon Awareness and Reduction Campaigns for African-Americans: A Theoretically-based Formative and Summative Evaluation.”. Health Education and Behavior. 1998;25:284–303. doi: 10.1177/109019819802500305. [DOI] [PubMed] [Google Scholar]
- Witte K, Cameron K. A, McKeon J, Berkowitz J. “Predicting Risk Behaviors: Development and Validation of a Diagnostic Scale.”. Journal of Health Communication. 1996;1:317–41. doi: 10.1080/108107396127988. [DOI] [PubMed] [Google Scholar]
- Witte K, Meyer G, Martell D. Effective Health Risk Messages: A Step-by-Step Guide. Thousand Oaks, CA: Sage; 2001. [Google Scholar]
- Witte K, Morrison K. “Examining the Influence of Trait Anxiety/Repression-Sensitization on Individuals' Reactions to Fear Appeals.”. Western Journal of Health Communication. 2000;64:1–29. [Google Scholar]
- Witte K, Murray L, Hubbell A. P, Liu W. Y, Sampson J, Morrison K. “Addressing Cultural Orientation in Fear Appeals: Promoting AIDS-protective Behaviors among Hispanic Immigrants and African-American Adolescents, and American and Taiwanese College Students.”. Journal of Health Communication. 2000;5:275–89. doi: 10.1080/108107301317140823. [DOI] [PubMed] [Google Scholar]
- Witte K. D, Stokols D, Ituarte P, Schneider M. “A Test of the Perceived Threat and Cues to Action Constructs in the Health Belief Model: A Field Study to Promote Bicycle Safety Helmets.”. Communication Research. 1993;20:564–86. [Google Scholar]


