Abstract
Kinematic analysis has provided important insights into the biology of growth by revealing the distribution of expansion within growing organs. Modern methods of kinematic analysis have made use of new image-tracking algorithms and computer-assisted evaluation, but these methods have yet to be adapted for examination of growth in a variety of plant species or for analysis of graviresponse. Therefore, a new image-analysis program, KineRoot, was developed to study spatio-temporal patterns of growth and curvature of roots. Graphite particles sprinkled on the roots create random patterns that can be followed by image analysis. KineRoot tracks the displacement of patterns created by the graphite particles over space and time using three search algorithms. Following pattern tracking, the edges of the roots are identified automatically by an edge detection algorithm that provides root diameter and root midline. Local growth rate of the root is measured by projecting the tracked points on the midline. From the shape of the root midline, root curvature is calculated. By combining curvature measurement with root diameter, the differential growth ratio between the greater and lesser curvature edges of a bending root is calculated. KineRoot is capable of analyzing a large number of images to generate local root growth and root curvature data over several hours, permitting kinematic analysis of growth and gravitropic responses for a variety of root types.
Detailed analysis of plant growth requires measurements that capture the large spatial and temporal heterogeneity of the expansion and differentiation of plant organs. While measurement of the aggregate growth of a plant organ provides important information, such as overall growth rate and velocity, the spatial distribution of growth is not described by these measurements. A number of researchers have characterized growth zones by employing kinematic analysis—an aspect of study of dynamics of physical motion (e.g. acceleration, velocity, etc.) without reference to the forces resulting in the movement (Gandar, 1983). As applied to plant growth, kinematics requires observation of the motion of discrete elements of an organ over time, from which the velocity and acceleration of those elements within a specified spatial context may be quantified.
Kinematic analysis has been widely used to determine the growth profiles (Silk and Erickson, 1979) of elongating plant organs, such as roots, stems, and leaves, in which the spatial distribution of growth may or may not be time dependent. More than six decades ago, using a compound microscope, Goodwin and Stepka (1945) measured cell division and the displacement of epidermal cells in Phleum roots at 30-s intervals in order to describe the processes of growth and maturation. Later studies have combined measurement of incremental organ growth and increase in cell length and cell number to define components of growth and analyze the spatial distribution of elongation (Erickson and Sax, 1956; Goodwin and Avers, 1956; Bertaud et al., 1986; Ben-Haj-Salah and Tardieu, 1995; Beemster et al., 1996; Sacks et al., 1997; Beemster and Baskin, 1998). In addition, relative elemental growth rate, describing the instantaneous displacement of points across a growing organ, has been analyzed for the two-dimensional growth of leaves (Erickson, 1966). Kinematic analysis has been used to study the influence of environmental factors on spatial and temporal growth patterns, e.g. effect of water stress (Sharp et al., 1988; Fraser et al., 1990; Liang et al., 1997; Sacks et al., 1997), shoot irradiance (Muller et al., 1998), and temperature (Pahlavanian and Silk, 1988; Walter et al., 2002) on maize (Zea mays) primary root elongation, and influence of nitrogen supply (Gastal and Nelson, 1994) and water stress (Durand et al., 1995) on fescue (Festuca spp.) leaf growth. Kinematic analysis has also been employed to describe the influence of biotic stress, such as aphid infestation, on elongation rate of alfalfa (Medicago sativa) shoot (Girousse et al., 2005). Recently, kinematic analysis has been used to analyze the effect of phosphorus deficiency on the elongation rate of the primary root of Arabidopsis (Arabidopsis thaliana; Ma et al., 2003) and grass leaf growth (Kavanova et al., 2006). Application of the kinematic approach in such diverse studies shows the utility of this technique in understanding the details of plant growth.
Various methods have been employed to visualize the spatial patterns of expansion for distinct physical elements of an organ (Erickson and Sax, 1956; Gandar, 1983). Many approaches involve marking the expanding regions of plant organs with ink, graphite particles, charcoal particles, carbon-water slurries, and needle holes, then measuring the displacement of the markers over time (Selker and Sievers, 1987; Sharp et al., 1988; Gould and Lord, 1989; Ben-Haj-Salah and Tardieu, 1995; Sacks et al., 1997; Beemster and Baskin, 1998; Granier and Tardieu, 1998, 1999; Muller et al., 1998; Hu et al., 2000). The displacement of these identifiable markers on the surfaces of the growing organs can be measured manually with a ruler or with a binocular microscope, or by taking time-lapse photographs using still or video cameras (Sharp et al., 1988; Gould and Lord, 1989; Bernstein et al., 1993; Ben-Haj-Salah and Tardieu, 1995; Sacks et al., 1997; Beemster and Baskin, 1998; Granier and Tardieu, 1998, 1999; Muller et al., 1998; Hu et al., 2000). More recently, instead of marking the growing organ, researchers have measured spatio-temporal displacements of natural landmarks such as vein structures on leaves (Schmundt et al., 1998) or computationally discernible patterns on the roots (van der Weele et al., 2003), and then applied various methods of image analysis for quantification of growth. Schmundt et al. (1998) used image sequence analysis, which they termed optical growth analysis, for measurement of growth in leaves of Ricinus communis and Nicotiana tabacum. They visualized leaf vein structures using infrared light and then employed computer-assisted image-analysis software based on a structure-tensor approach (Jahne, 1997) to obtain high-resolution growth maps of leaves. Their study resulted in quantification of the actual growth rates and changes in growth rates over time of the actively expanding leaves. Later, this method was modified by Walter et al. (2002), who applied automated image sequence analysis for detailed study of relative elemental growth rate distribution of growing maize primary roots influenced by variation in root temperature. Recently, van der Weele et al. (2003) introduced a new computer-assisted technique that involved the combination of two methods, the structure-tensor (Jahne, 1997) and robust matching algorithms (Black and Anandan, 1996), to measure the expansion profile of a growing root at high spatio-temporal resolution. They captured digital images of an Arabidopsis root at 5- or 10-s intervals, and nine consecutive images were analyzed using the structure-tensor method to find a line of minimum variation in pixel intensity and to define the moving and static portions of the root. van der Weele et al. (2003) used the robust matching algorithm to improve the initial, structure-tensor-based estimates of velocity.
In most of the studies discussed above, the primary objective was to characterize the growth of a plant organ. However, we wanted to characterize both root growth and gravitropic curvature of the basal roots of common bean (Phaseolus vulgaris) in response to gravity. Whereas one-dimensional kinematic study in the direction of growth is sufficient for identifying and characterizing the growth zones of the roots, at least two-dimensional kinematic analysis is essential for our purposes. It is necessary to examine root growth and bending over a relatively long period (4–6 h) to accommodate the time scales associated with changes in growth angle of basal roots. The structure-tensor method used by a number of researchers (Schmundt et al., 1998; van der Weele et al., 2003) calculates local root or leaf growth velocity with a high degree of confidence only if there are many high-contrast patterns, which are lacking at the magnification required to follow the growth of larger plant organs such as the roots of most crop plants. In the absence of such patterns, the structure-tensor method can only produce a very sparse velocity field with low confidence. Therefore, we developed a novel semiautomated image-processing system to analyze the gravitropic growth of roots that takes advantage of patterns not only at a pixel site but also in its neighborhood. As a result, the new approach can generate reliable root growth data even in regions where there are very low contrast patterns or no patterns as long as the neighborhood is large enough to include identifiable patterns. This approach is also particularly suitable for measuring the two-dimensional growth velocity of the root for relatively longer times. Furthermore, this program automatically detects root edges, generating the root midline for calculation of root curvature, diameter, and differential growth ratio between two sides of a bending root.
RESULTS
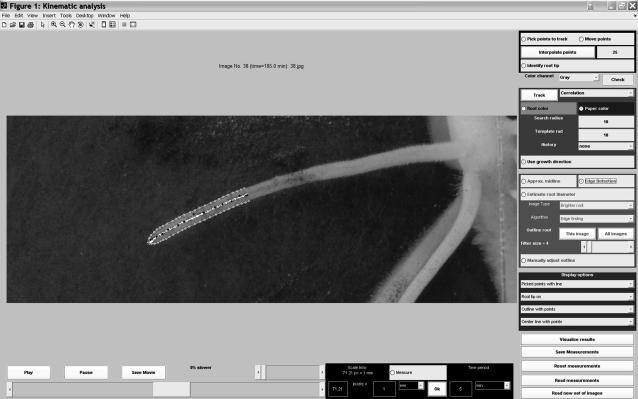
Here, we briefly describe the image-analysis program KineRoot for kinematic study of growth and gravitropism of roots. The mathematical details of the algorithm are provided in Supplemental Appendix S1. Although we use the new technique primarily to analyze gravitropic growth of basal roots of common bean, the approach can also be applied to study kinematics of other root systems. KineRoot was developed using Matlab 7.0 (The MathWorks). It features an easy-to-use graphical user interface, shown in Figure 1. KineRoot allows loading of a sequence of images (the number is limited only by the computer's memory), and then playing of the images as a movie at desired speeds and moving from one frame to another with the click of a mouse button. Furthermore, by measuring the millimeter marks on the ruler, KineRoot also allows easy spatial calibration of the images from pixels to millimeters. Image analysis by KineRoot is divided into two basic steps.
Figure 1.
Screen shot of the graphical user interface of the image-analysis software KineRoot.
Step 1: Tracking of Marker Points on the Root Images
From all the time sequence images loaded into KineRoot, the user selects an initial reference image that shows the root tip and elongation zone most clearly. In the reference image, the user selects a number of points (generally 10–15) along the root with one point lying on the root tip. The choice of points is arbitrary and unrelated to natural features or added graphite, with the only requirement being that they are chosen sequentially along the root. Then the user identifies the point lying on the root tip. The user can either choose all the points to be tracked by clicking the mouse on the image, or select a few points and then use cubic spline interpolation (Press et al., 1992) to generate the desired number of marker points to be tracked by the software. The marker points are then tracked in all other images sequentially such that the patterns around a point have the greatest similarity between two consecutive images. For tracking the points, a new highest correlation coefficient search algorithm and its variations are used.
Highest Correlation Coefficient Search
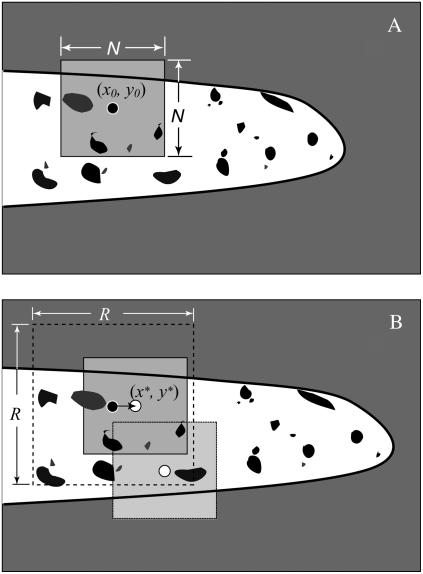
This algorithm matches boxes of pixels between a reference image and the current image irrespective of whether the pixels are on the root or on the background. The image in which the points have been tracked before the current image is used as the reference. For example, if the user selected the points in the ith image, then, for tracking the interpolated points in frames i + 1 and i − 1, the ith image is used as the reference. Similarly, for tracking points in image i + 2, image i + 1 is used as a reference, and, for tracking points in image i − 2, image i − 1 is used as the reference. Figure 2 schematically shows the pattern-matching algorithm using the highest correlation search method. The black circle in Figure 2A shows a point (x0, y0) in the reference image that is being searched for in the current image (Fig. 2B) based on patterns within the gray square in Figure 2A. As the root grows, the patterns separate from each other. However, images captured at frequent intervals ensure that a high degree of similarity is maintained between consecutive images. KineRoot calculates the correlation coefficient between the color intensities of pixels in the gray square in Figure 2A and color intensities of pixels from similar gray squares around a predicted point in Figure 2B, such as the white circles. This process of calculating the correlation coefficients between color intensities of the pixels in the reference image and the predicted image is repeated until the correlation coefficient reaches its highest magnitude. In Figure 2B, the white circle marked (x*, y*) shows the most likely location of point (x0, y0) in Figure 2A. The process ensures identification of the new locations of the points based on highest similarity between the patterns in two consecutive images, even if the points are not located on a graphite particle or other surface marker. The small arrow pointing from the black circle to the white circle in Figure 2B shows the local root growth velocity with respect to the fixed germination paper background.
Figure 2.
Schematic showing the pattern-matching algorithm. The white tubular shapes with black borders on the gray background show the growing root. The black spots show patterns on the root. A shows the reference image and B shows the current image. The black circle with a white outline in A is the marker point (x0, y0), which is being tracked in B. We chose all pixels within the gray square of N × N in A and correlate those with the gray boxes in B. The search for the new location of the marker point in B is restricted within the larger dotted square R × R. When the N × N box is centered on the (x*, y*) in B, the correlation with A is highest. But when the gray box is placed elsewhere, the correlation coefficient between the N × N boxes in A and B drops. Note that there is no requirement for the points to be on a graphite particle for tracking.
The user specifies the size of the square N within which pixels are correlated between two images (Fig. 2A) and the search box size R within which KineRoot searches for the new location of the points (Fig. 2B). The amount of computation necessary to track a point depends on the search box size R and pixel box size N. Since search for the new location of a tracked point is limited by the size of R, it is necessary that R is larger than the displacement distance of any marker point between two consecutive images. However, selecting an overly large value of R unnecessarily increases the computation without any benefit. Larger values of N match patterns over a larger area, increasing the accuracy of tracking to a certain extent. However, at very high values of N the root will occupy relatively less space in the gray shaded box in Figure 2B, and, therefore, the program will match patterns on the germination paper rather than the root, causing inaccurate tracking. Since N × N pixels from each image are correlated, minimizing N improves the speed of tracking due to reduction of computational load. Therefore, optimum choices of R and N are important for both computational efficiency and accuracy of the method.
To make the algorithm efficient, the operator can use the velocity of the marker points to provide a better prediction to the search algorithm and reduce the search box size R. In Figure 2B, the dashed square of size R × R pixels is centered on the point (x0, y0). But if the velocity of the point (x0, y0) in Figure 2A is already known, then one can predict the new location of this point in Figure 2B, and, therefore, the dashed square R × R can be drawn around the predicted location of (x0, y0). This use of velocity of the individual points to provide a better initial guess to the search algorithm eliminates need for large R and reduces computational load, making the tracking algorithm more efficient. Use of estimated velocity for tracking can be toggled on or off in the software.
Highest Color-Weighted Correlation Coefficient Search Algorithm
Although the highest correlation search method worked in more than 70% of our experiments, if the root grew into an area where the background (in this case the germination paper texture) was very different from the reference image, the algorithm had more difficulty tracking the points accurately.
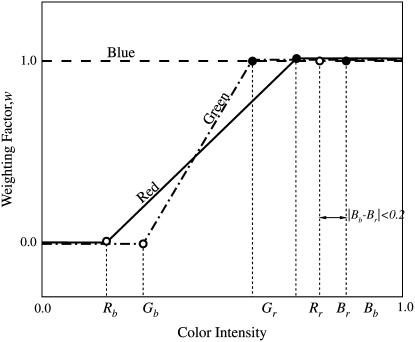
To overcome this problem, we introduced a weighing factor w, based on the color of the pixel, into the calculation of correlation coefficient. The user selects a small area of the image covering only the root and then another area covering only the background. Color intensities of red, green, and blue channels from each of these areas are averaged and stored as root color (Rr, Gr, Br) and background color (Rb, Gb, Bb), where R, G, and B are the intensities of red, green, and blue, respectively, and range between 0 and 1. Figure 3 shows a schematic for calculation of the weighing factor w. If the difference in intensity of any color between the root and the background is less than 0.2, the weighing factor w is assigned a value of 1 (e.g. the dashed line in Fig. 3 labeled “Blue”); otherwise, the weighing factor is calculated by linear interpolation for pixels with color intensity between that of the root and the background. If the color intensity is outside the root and background color intensity range, w is assigned a value of 1 or 0 depending on proximity to the root color or background color, respectively. The color-based weighing factors reduce the importance of the pixels from the background in calculating the correlation coefficients between two boxes of pixels. As a result, even if the appearance of the background changes drastically, the software is able to track points on the root reliably. It should be noted that in case of low contrast images, where the intensity difference between the root and background is less than 0.2 for all three colors, the weighing factor becomes 1. As a result, the color-weighted highest correlation search method changes to the highest correlation search method described in the previous section.
Figure 3.
Schematic showing the weights for calculating color-weighted correlation coefficients based on color of the pixel and sampled colors of the root (Rr, Gr, Br) and the background (Rb, Gb, Bb). The red, green, and blue labeled lines show the weighting factors for the corresponding colors. If the difference in color intensity between the root and the background is less than 0.2, weighting factor is assigned a value of 1; otherwise, weighting factor w is calculated by linear interpolation for a pixel whose color intensity lies between that of the root and the background. If the color intensity of a pixel is outside this range, a value of 1 or 0 is assigned based on the proximity to the root color or background color, respectively.
Using Tracking History
In addition to the methods described above, we also employed a variation where instead of using the previous image as the only reference, the user could include more images, including the one where the user first selected the points as reference. In the absence of history tracking, if there are 50 images and the user chooses the 35th image to select the points, then the 35th image will be used as reference for locating the points on the 34th image, the 34th image will be used as a reference for the 33rd image, and so on. However, with history tracking the user could also use other images where points have already been tracked as a reference also, e.g. for the 22nd image the reference could include the 23rd, 24th, 25th, and the initial reference image (in this example, the 35th image). KineRoot calculates a weighted average of the correlation coefficients, putting greater weight on images with closer proximity in time to the current image and progressively lesser weight on the images that are further away from the current image. Then this average correlation coefficient is used for finding the most likely position of a marker point.
Apart from the maximal correlation search method, KineRoot can also use a simpler approach for straight roots by searching for the minimum pixel intensity difference. Further details on this approach are provided in Supplemental Appendix S1.
The tracking methods described above have different computational loads. Since our objective is to track marker points reliably with the minimum possible computation, the methods are ranked and chosen according to decreasing computational efficiency in the following order: minimum pixel intensity difference search method, highest correlation coefficient search method, highest color-weighted correlation coefficient search method, combination of difference and correlation search methods, and correlation search with tracking history method. After tracking the marker points, the algorithm for each method provides a confidence measure of marker tracking, and, if the confidence measure is too low, KineRoot suggests that the user use the next tracking method with a higher computational load. For the correlation coefficient search method, the minimum of the highest correlation coefficients for tracking all marker points in all frames provides the confidence measure F = Cmin. A threshold value of confidence F = 0.8 was used before moving to the next method.
Step 2: Automatic Edge Detection and Finding the Midline of the Roots
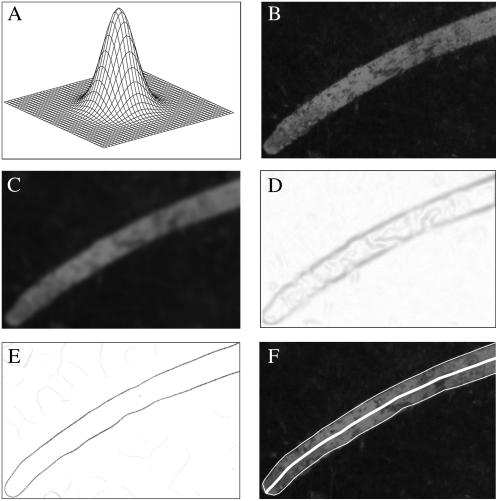
Once the marker points are tracked along the root, KineRoot finds the root centerline and projects these points on the midline to estimate root growth. To identify the root midline, the edges of the root are identified in each image. An “edge” in an image is defined as a line at which the gradient of color intensity has a local peak. However, quite often the edge cannot be accurately identified by highest magnitude of the derivative of the pixel intensities directly because of noise in the image or blurriness at the edge. Many methods have been developed for automatic detection of edges from digital images (Prewitt, 1970; Sobel, 1978; Canny, 1986). Among these methods, one of the most popular is the edge detection algorithm by Canny (1986). The Canny algorithm has three steps, of which we use two and replace the third step with a simpler method by customizing for the specific characteristics of root images. The steps of edge detection are shown in Figure 4.
Figure 4.
Steps of automatic edge detection: A, two-dimensional Gaussian filter; B, close-up image of a basal root; C, basal root image after noise smoothing by convolution with the Gaussian filter; D, magnitude of the gradient of the smoothed image showing blurry edges; E, edge enhanced by non-maxima suppression; F, detected upper and lower edges of the root and the centerline shown by white lines.
Noise Smoothing and Image Gradient
Since an edge is identified by a sudden change in color within a span of a few pixels, i.e. a strong color gradient, it is important to ensure that the strongest color gradients of the image do not reflect either noise or the dark graphite particles on the image. Therefore, before detecting the edge of the root, noise is smoothed by convolving the image with a Gaussian filter (Fig. 4A). Figure 4B shows the image before convolution, and Figure 4C shows the smoothed image after convolution with the Gaussian filter.
Edge Enhancement
In this step the magnitude of the color intensity gradient of the image is calculated (Fig. 4D). To obtain the best estimate of the root edge, it is important to use the maximum available contrast between the root and the background. For our experiments the background germination paper is blue, whereas the root color is light gray. When we compared the individual red, green, and blue colors between the root and the background, we found that instead of averaging all three colors, the red color produced the highest contrast, whereas the blue color had the least contrast. Therefore, for edge detection in our experiments, best results were obtained using the intensity of red color of the pixels. However, KineRoot allows the user the flexibility of choosing how to calculate the color gradient. Figure 4D shows that although the gradient identifies the edges, the peak gradient corresponding to the edge spreads over more than one pixel width, resulting in a smudged edge. To identify the true edge in the image, the Canny edge detector identifies the local maxima along the edge and suppresses all other high gradient values in the image (Fig. 4E), resulting in edges that are one pixel wide.
Edge Finding
Although the Canny edge detection algorithm has one more step in which the edge points are linked together to generate the final edge, we apply an easier approach knowing that the roots have tubular shape and the edges can be found if we move perpendicular to the lines joining the tracked points. However, there could be another root near the edge that can be picked erroneously by the computer. To prevent this error, the user measures the approximate root diameter, which is then used as the search radius for finding the root edge from the non-maxima suppressed image gradient (Fig. 4E). Figure 4F shows the final edge-detected image, where both upper and lower edges are outlined with thin white lines.
Root Midline Identification
By taking the average of both upper and lower edges, we can also identify the root midline, which is shown by the thick white line in Figure 4F. To get an accurate estimate of the root midline by averaging the root edges even for highly curved roots, the points are selected through an iterative algorithm that ensures that the radial lines connecting any pair of edge points are locally perpendicular to the root midline. The details of the root midline identification algorithm are provided in the Supplemental Appendix S1.
Measurements
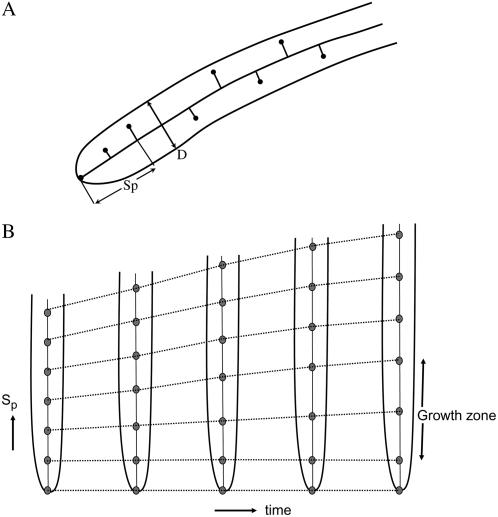
Once the root midline is found, we project the tracked marker points on the midline (i.e. drop perpendicular on the midline) and measure the distance Sp of the pth point from the root tip along the midline of the root as shown in Figure 5A using the following equation.
 |
(1) |
Figure 5.
A, Schematic showing projection of tracked points on the root centerline. Distance of the projected tracked points from the root tip Sp is measured along the root centerline. From the detected root edge, we also measure the root diameter D as a function of distance from the root tip and time. B, Schematic showing the spatio-temporal trajectory of the tracked points. The region where the gap between the points increases rapidly with time identifies the growth zone.
For our subsequent measurements, we use Sp to compute root growth velocity and relative elongation rate. In addition, we also directly measure the root diameter D at any point along the root length. Figure 5B shows the schematic of the space-time mapping of marker points where distance of the marker points from the root tip is along the vertical axis and time is on the horizontal axis. Note here that since we use the root tip as our spatial reference, it is held fixed. The region where the distance between consecutive marker points changes more rapidly over time than other areas along the root identifies the growth zone (Fig. 5B).
Knowing the distance of the tracked points from root tip allows us to calculate root growth velocity as a function of distance from the root tip and time. If a point p is located at Sp distance from the root tip at time t and after δt time it moves to Sp + δSp distance from the root tip, then the growth velocity of the point p is as follows.
 |
(2) |
The relative elongation rate describes the rate of relative growth of a small segment of the root over a short time where a root segment of length l = Sp − Sp−1 grows to l + δl over time δt. Therefore, relative elongation rate is as follows.
 |
(3) |
Relative elongation rate r(s, t) can also be calculated by taking the derivative of the root growth velocity u(s, t) with respect to distance from the root tip s (Silk and Erickson, 1978; Taiz and Zeiger, 1998).
Since we are also interested in bending of the roots, one of the important parameters to calculate from image analysis is the root curvature. Curvature is the reciprocal of radius of curvature, i.e. the radius of a circle that matches the curve at a point (x, y), and is given by
 |
(4) |
where y = y(x) is the equation that describes the root midline. To calculate the root diameter d at distance s from the root tip, a line locally perpendicular to the root midline is drawn. The distance between the two points of intersection of the two edges with this perpendicular line is the root diameter at distance s from the root tip. As a root bends toward gravity, one side of the root grows more than the other side. Therefore, the ratio of arc lengths along the two edges of the root can be used to characterize graviresponse of a root. Following Silk and Erickson (1978), the differential growth ratio of two arcs of length δsu and δsl on the upper and lower edges of an element of a bending root is calculated by the following equation.
 |
(5) |
Example Measurements
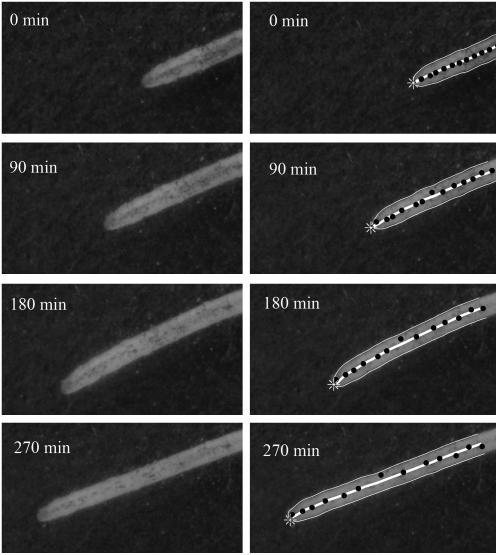
In this section we present representative measurements from one bean basal root to demonstrate the performance of KineRoot and the typical results obtainable from it. Figure 6 shows an example of marker point tracking and automatic edge detection using a montage of eight images of basal roots. The images shown in Figure 6 are at 90-min intervals from a sequence of 72 images originally captured at 5-min intervals. The images on the left show the patterns on the root generated by graphite particles, whereas the images on the right show the tracked marker points and the root edges on the same images as on the left. The 2-d-old seedling with emerging basal roots was grown in growth pouch in nutrient solution (see “Materials and Methods”). The images were captured beginning 36 h after the emergence of the basal roots. The black dots are the marker points selected by the user at 120 min and tracked in other frames by KineRoot using highest correlation search method. Note that after the user selected the marker points, they were interpolated to generate a total of 25 points that are tracked in all frames. To avoid crowding of the points, here we only show 14 points selected by the user. After the marker points were tracked, edges of the root were identified by edge detection. The average of the root edge lines generates the root midline, which is shown by the bold white line. The root tip is identified by the asterisk symbol. The marker points were projected on the midline to calculate distance Sp from the root tip along the midline.
Figure 6.
Montage of eight images of a bean basal root. The images are at 90-min intervals from a sequence of 72 images originally captured at 5-min intervals. The images on the left show the patterns on the root generated by graphite particles, whereas the images on the right show the tracked marker points and the root edges on the same images of the left. The upper and lower edges of the growing root are detected by KineRoot, and the bold white line shows the root midline. The black dots show the tracked points.
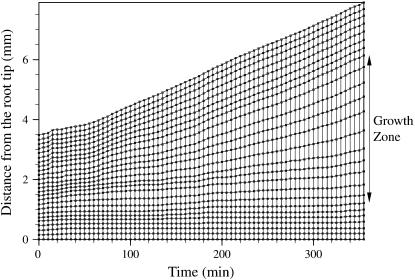
As the root grows, the marker points move away from each other (Fig. 6). The rate at which points move away from each other defines the growth zones of the root. In Figure 7, the top-most line (3.5 mm at time 0 min and 7 mm at 355 min) shows overall growth of the selected root segment. The points located between 0.8 and 2.2 mm from the root tip at time = 0 separated more than points in other regions of the root; this is the rapid elongation zone of the root.
Figure 7.
Root length map showing the growth of the root by plotting distance of the marker points from the root tip along the root midline at 5-min time intervals.
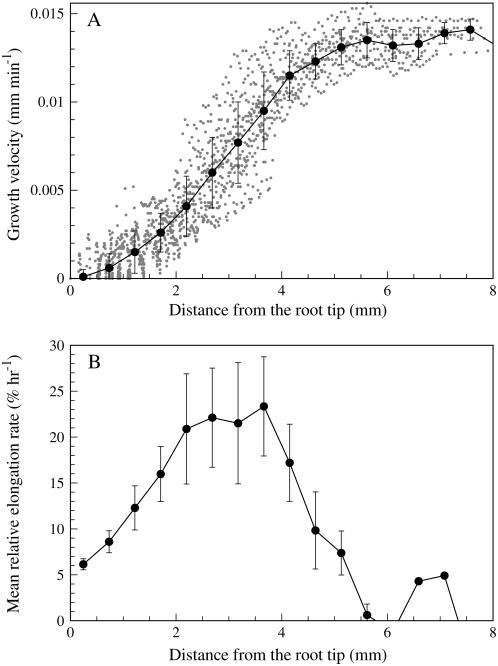
Figure 8A shows the growth velocity of tracked markers from a single root as a function of distance from the root tip. The gray dots in Figure 8A show the growth velocity of all marker points from 72 images taken over a period of 6 h at 5-min intervals. The superimposed bold line is the mean growth velocity after grouping the data in bins of 0.5 mm. The raw data from KineRoot form a clustered group showing the robustness of the algorithm. The velocity profile shows the typical sigmoid shape and is comparable to results of other kinematics techniques (e.g. Sharp et al., 1988; Fraser et al., 1990; Sharp et al., 2004). The plot of mean relative elongation rate as a function of distance from the root tip (Fig. 8B) shows that the growth zone spans up to 6 mm from the root tip.
Figure 8.
A, Root growth velocity plotted as a function of distance from the root tip. The gray dots show the growth velocity of 25 tracked points in 72 frames. The bold line shows the average growth velocity after grouping the data in bins of 0.5 mm. The vertical bars are ± 1 sd. B, Mean relative elongation rate plotted against distance from the root tip with sd error bars.
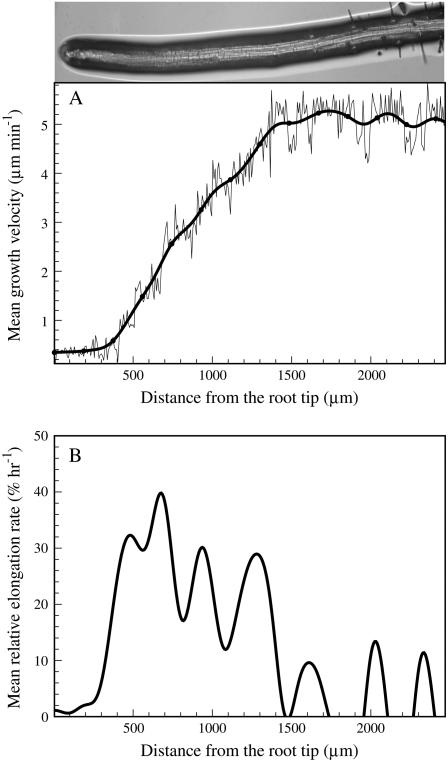
To show the versatility of the software in handling the images of different types of roots, we also analyzed the growth velocity and relative elongation rate of Arabidopsis primary root. Gray-scale images of Arabidopsis primary root were collected by using a compound microscope with infrared light and without marking. Figure 9A shows the velocity profile of the primary root measured as a function of distance from the root tip. The image at the top of Figure 9A shows the primary root of Arabidopsis from which the mean velocity profile was calculated. The thin wiggly line in Figure 9A shows the growth velocity obtained through tracking of 500 marker points along the root. The solid black line shows smoothed growth velocity plot obtained using the method of overlapping polynomials. Figure 9B shows the profile of relative elongation rate, i.e. the derivative of the smoothed growth velocity data in Figure 9A. The data represented in Figure 9 show average growth velocity and relative elongation rate calculated from nine frames. Second-order finite difference method was used for calculating derivatives to estimate both growth velocity and relative elongation rate.
Figure 9.
A, Root growth velocity of Arabidopsis primary root plotted as a function of distance from the root tip. Thin wiggly lines represent growth velocity data obtained from tracking of 500 marker points, and solid black line is the smoothed root growth velocity profile. B, Relative elongation rate calculated from the derivatives of smoothed velocity profiles. The image of the root from which the velocity profile was obtained is shown at the top.
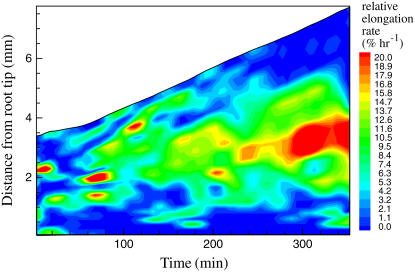
A color isocontour plot shows relative elongation rate of bean root as a function of distance from the root tip and time, i.e. spatio-temporal variation in relative elongation rate (Fig. 10). The isocontour plot is generated using Matlab 7.0 through KineRoot's interface. The length of the growth zone increases with time from approximately 1.5 mm (1–2.5 mm from root tip) at 60 min to 4 mm (1–5 mm from root tip) at 350 min. The apical boundary of the growth zone remains almost constant at 1 mm from the root tip, but the distal end of the growth zone expands, lengthening the growth zone. In addition, the rate of elongation also increases with time as shown by the large red region beyond 270 min compared to mostly green elongation zone before that. The isocontour plot illustrates the dynamism of the developing growth zone.
Figure 10.
Colored isocontour plot of the rate of relative elongation plotted as a function of distance from the root tip and time. Reds, oranges, and yellows show high rate of elongation, whereas light and dark blues show low/zero rate of elongation.
Detection of root edges also allows us to measure root diameter in space-time coordinates. Figure 11 shows the time-averaged root diameter as a function of distance from the root tip. The diameter of the root near the tip is minimum and reaches a nearly constant magnitude at about 1.5 mm from the root tip. The small error bars in Figure 11 show that as the root grows by about 3.5 mm in length over 6 h, the root diameter remains nearly constant.
Figure 11.
Mean root diameter plotted as a function of distance from the root tip. The vertical bars show ± 1 se. Where bars are not visible, the se is less than the size of the symbol.
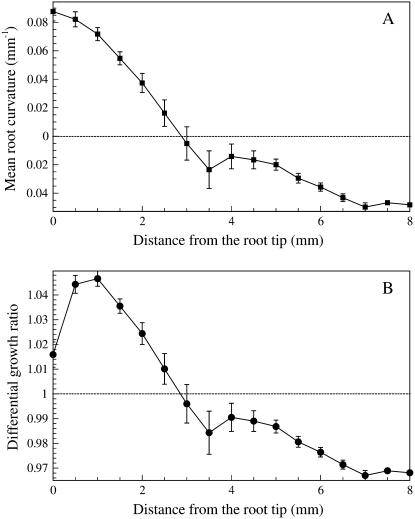
Root graviresponse or curvature can be described by KineRoot as curvature of the root midline (Fig. 12A) or as the differential growth ratio between two edges of the root (Fig. 12B). Positive curvature and a differential growth ratio greater than 1 indicate downward bending, and negative curvature indicates upward bending. In this case, we have presented the very small change in growth direction of a plagiogravitropic bean basal root in the absence of gravistimulation, i.e. these data are for the small changes in direction accompanying normal plagiogravitropic growth. Although the curvature and the differential growth ratio are very small in this example (the upper edge of the root grew 2%–4% more than the lower edge in 6 h), KineRoot was able to quantify this difference and detect two regions of bending, the apical bending zone spanning 1 to 3.5 mm from the root tip and the distal bending zone spanning 3.5 to 5.5 mm from the root tip.
Figure 12.
A and B, Mean root curvature (A) and differential growth ratio (B) between the upper and lower sides of the root plotted as a function of distance from the root tip. Positive curvature and differential growth ratio greater than 1 indicate downward bending and vice versa. The vertical bars indicate se.
DISCUSSION
This study presents semiautomated image-analysis software, KineRoot, for kinematic analysis of root growth and graviresponse. This method is suitable for larger-rooted species, such as crop plants, as well as for small-rooted plants, and can monitor growth over several hours. As an example, we present analysis of common bean basal root growth and graviresponse. Common bean basal roots were 0.4 to 1 mm in diameter and 10 to 20 mm long at the onset of the study, and grew at rates of 0.8 to 1.2 mm/h. Since these roots are devoid of patterns permitting spatio-temporal tracking at suitable magnification, we sprinkled graphite particles to add patterns to the root for tracking by KineRoot. Although use of ink or graphite particles as markers has been used before (Erickson and Sax, 1956; Sacks et al., 1997; Beemster and Baskin, 1998; Muller et al., 1998), the process was tedious. Clearly visible markers had to be added very carefully for tracking because mechanical stimulation can damage roots and/or alter root growth. However, in KineRoot the computer matches patterns within boxes of pixels surrounding a marker, so there is no need for any particular type or placement of markers on the roots, and any point on the root can be used as a marker even if there is no graphite particle exactly at that point, as long as there are some uniquely identifiable color patterns around the roots. As a result, KineRoot is more suitable for kinematic study of a large number of roots with minimal user interventions. Furthermore, the method of pattern matching allows us to track the marker points on the roots for extended periods, even if the roots deviate from a straight trajectory.
The existing algorithms based on the structure-tensor method (Schmundt et al., 1998; van der Weele et al., 2003) search for a path of minimum pixel intensity difference in a stack of seven to nine images to generate the velocity field of the plant organ. Therefore, in any portion of the plant organ where there are very few patterns, this method cannot generate velocity with sufficient confidence, and as a result produces a velocity field that is very sparse. In a growing root, it is the zone of interest (the growth zone) that becomes less populated with patterns with time, and the structure-tensor method generates very few high-confidence velocity measurements there. Since KineRoot not only matches patterns at a pixel site but also from its neighboring sites, even when the patterns expand within the growth zone, KineRoot can track marker points with high confidence based on patterns in the neighboring pixels.
Our analysis of growth velocity and relative elongation rate shows that KineRoot can also be used to analyze the images of different types of roots, such as relatively large roots of common bean and small roots of Arabidopsis. KineRoot automatically tracks the marker points and detects edges of the roots, generating reliable growth data. The growth velocity data generated by KineRoot (Figs. 8 and 9) match the description of root growth found in the literature (Taiz and Zeiger, 1998). The growth zone of roots can be divided into two main regions, the meristem (zone of cell division) and zone of rapid elongation. As the cells divide, they successively pass through the elongation zone and to the maturation zone, where growth ceases as cells become mature with differentiated characteristics (Dolan et al., 1993; Taiz and Zeiger, 1998). The rate of root elongation is regulated by the combined effects of cell production in the meristem and cumulative cell expansion in both meristem and growth zone (Beemster and Baskin, 1998). Since individual cells are not visible in images collected for KineRoot analysis of common bean, it is not possible to directly measure the cell production in the meristem. Our analysis of a bean root shows that the relative elongation rate is not quite zero close to the root tip (Fig. 8B), reflecting the expansion of meristem cells. The plot of relative elongation rate of an Arabidopsis root, which is to a finer scale, shows a small (<300 μm) zone at the site of the apical meristem with nearly flat relative elongation rate (Fig. 9B). The relative elongation rate and velocity profile of an Arabidopsis primary root obtained using KineRoot matches closely with the output from a structure-tensor method, RootFlowRT (T. Baskin, personal communication; RootFlowRT described in van der Weele et al., 2003).
Color isocontour plotting shows the variation in relative elongation rate as a function of both space and time (Fig. 10). This type of representation of bivariate data allows easy identification of spatio-temporal patterns of growth of the basal roots. The spatio-temporal isocontour plot of relative elongation rate (Fig. 10) also explains the large sds in Figure 8B. Since the length of the growth zone as well as rate of elongation change with time, grouping data from the entire duration of the experiment introduces variability, resulting in large sd in mean relative elongation rate (Fig. 8B).
Identification of the root edge allows us to not only locate the root midline but also measure the root diameter. In this example, the root diameter remained nearly constant during the nearly 6-h test period, whereas root length grew by 3.5 mm (Fig. 11). The diameter function would be useful under situations such as drought, when root radial expansion is reduced throughout the growth zone (Sharp et al., 1988).
KineRoot measures the distribution and extent of root curvature as well as root elongation, permitting detailed analysis of gravitropism and other responses resulting in changes in the direction of growth. The root midline was used to estimate the curvature of the root as it grew (Fig. 12A). When combined with root diameter, root curvature can also be used to calculate differential growth ratio (Fig. 12B) between two sides of a bending root because a root can only bend if one side grows more than the other side. In this case, since the bending of the root was minimal, the differential growth ratio was also minimal with the upper edge growing 2% to 4% more than the lower edge of the root. The program was able to quantify even very small and temporary growth differentials.
Our approach of nearly automatic image analysis and measurement using colored images provides a new tool for application of kinematic techniques to the analysis of spatio-temporal growth of plant organs over long time spans as long as there are discernible patterns in the images for tracking on the organ.
MATERIALS AND METHODS
Experimental Method
Common bean (Phaseolus vulgaris) genotype TLP19 developed at the International Center for Tropical Agriculture (Cali, Colombia) was employed for this study. Seeds were surface sterilized with 6% sodium hypochlorite for 5 min, rinsed thoroughly with distilled water, and scarified with a razor blade. Seeds were germinated at 28°C in darkness for 2 d in rolled germination paper (25.5 × 37.5 cm; Anchor Paper Co.) moistened with nutrient solution, which was composed of (in μm) 3,000 KNO3, 2,000 Ca(NO3)2, 1,000 NH4H2PO4, 250 MgSO4, 25 KCl, 12.5 H3BO3, 1 MnSO4, 1 ZnSO4, 0.25 CuSO4, 0.25 (NH4)6Mo7O24, and 25 Fe-Na-EDTA. Germinated seeds with radicles approximately 2 to 3 cm long were transferred to a sheet of 30- × 24-cm blue germination paper (Anchor Paper Co.) stiffened by attaching perforated plexiglass sheets to stabilize the root system. The bottom of the blue paper with plexiglass was placed to allow direct contact with the nutrient solution. The germination paper containing a seedling was suspended in nutrient solution and covered with aluminum foil to prevent illumination of the roots.
Graphite particles sprinkled on the roots created patterns on the otherwise uniformly colored root that could be followed in image analysis. A small amount of graphite powder was drawn into a dropper fitted with a pipette tip and then blown on the roots from close proximity. During this procedure care was taken to not touch the roots or change the orientation of the seedling with respect to the gravity. A pouch containing one seedling was placed in a water-sealed plexiglass box maintained at 25°C to 26°C. Seedlings were photographed from outside the plexiglass box. Images of root systems were captured for 4 to 6 h at fixed intervals (5 min) using a high-resolution (6 Megapixel) digital single-lens reflex camera (Nikon D70s) fitted with 105-mm Nikkor micro lens, beginning 1 d after emergence of basal roots in pouches. The camera was triggered at fixed intervals by a laptop computer through a universal serial bus cable using the software Nikon Capture 3.5. The resolution of the captured images was 10 to 20 μm pixel−1. Except for the use of the camera's flash for image capture, plants were grown in complete darkness to minimize light exposure of the roots. To avoid shadows from direct flash, which interferes with image analysis, light from two flashes was bounced off a sheet of white paper placed on top of the plexiglass box. The flashes were wirelessly triggered by the built-in flash of the Nikon D70s camera. A ruler was attached to the supporting plexiglass sheet for calibrating pixel dimensions into millimeters.
Arabidopsis (Arabidopsis thaliana) images were obtained from Dr. Tobias Baskin, University of Massachusetts, Amherst, MA.
The KineRoot program is available for downloading from Dr. Anupam Pal (apal@iitk.ac.in). Since the software is built using Matlab 7, the user must have Matlab to use the software. KineRoot is compatible with Windows, Linux, and Unix versions of Matlab.
Supplemental Data
The following materials are available in the online version of this article.
Supplemental Figure S1. Illustration of the algorithm used for finding the midline of the root.
Supplemental Appendix S1. Mathematical details of the new image-analysis program KineRoot.
Supplementary Material
Acknowledgments
We gratefully acknowledge Dr. Tobias Baskin for providing the image of the primary root of Arabidopsis shown in Figure 9.
This work was supported by U.S. Agency for International Development Bean/Cowpea Collaborative Research Support Program.
The author responsible for distribution of materials integral to the findings presented in this article in accordance with the policy described in the Instructions for Authors (www.plantphysiol.org) is: Kathleen M. Brown (kbe@psu.edu).
The online version of this article contains Web-only data.
Open Access articles can be viewed online without a subscription.
References
- Beemster G, Baskin T (1998) Analysis of cell division and elongation underlying the developmental acceleration of root growth in Arabidopsis thaliana. Plant Physiol 116 1515–1526 [DOI] [PMC free article] [PubMed] [Google Scholar]
- Beemster GTS, Masle J, Williamson RE, Farquhar GD (1996) Effects of soil resistance to root penetration on leaf expansion in wheat (Triticum aestivum L.): kinematic analysis of leaf elongation. J Exp Bot 47 1663–1678 [Google Scholar]
- Ben-Haj-Salah H, Tardieu F (1995) Temperature affects expansion rate of maize leaves without change in spatial distribution of cell length (analysis of the coordination between cell division and cell expansion). Plant Physiol 109 861–870 [DOI] [PMC free article] [PubMed] [Google Scholar]
- Bernstein N, Lauchli A, Silk WK (1993) Kinematics and dynamics of sorghum (Sorghum bicolor L.) leaf development at various Na/Ca salinities (I. Elongation growth). Plant Physiol 103 1107–1114 [DOI] [PMC free article] [PubMed] [Google Scholar]
- Bertaud DS, Gandar PW, Erickson RO, Ollivier AM (1986) A simulation model for cell proliferation in root apices. I. Structure of model and comparison with observed data. Ann Bot (Lond) 58 285–301 [Google Scholar]
- Black MJ, Anandan P (1996) The robust estimation of multiple motions: parametric and piecewise-smooth flow fields. Comput Vis Image Underst 63 75–104 [Google Scholar]
- Canny J (1986) A computational approach to edge detection. IEEE Trans Pattern Anal Mach Intell 8 679–698 [PubMed] [Google Scholar]
- Dolan L, Janmaat K, Willemsen V, Linstead P, Poethig S, Roberts K (1993) Cellular organisation of the Arabidopsis thaliana root. Development 119 71–84 [DOI] [PubMed] [Google Scholar]
- Durand J-L, Onillon B, Schnyder H, Rademacher I (1995) Drought effects on cellular and spatial parameters of leaf growth in tall fescue. J Exp Bot 46 1147–1155 [Google Scholar]
- Erickson RO (1966) Relative elemental rates and anisotropy of growth in area: a computer programme. J Exp Bot 17 390–403 [Google Scholar]
- Erickson RO, Sax KB (1956) Rates of cell division and cell elongation in the growth of the primary root of Zea mays. Proc Am Philos Soc 100 499–514 [Google Scholar]
- Fraser TE, Silk WK, Rost TL (1990) Effects of low water potential on cortical cell length in growing regions of maize roots. Plant Physiol 93 648–651 [DOI] [PMC free article] [PubMed] [Google Scholar]
- Gandar PW (1983) Growth in root apices. I. The kinematic description of growth. Bot Gaz 144 1–10 [Google Scholar]
- Gastal F, Nelson CJ (1994) Nitrogen use within the growing leaf blade of tall fescue. Plant Physiol 105 191–197 [DOI] [PMC free article] [PubMed] [Google Scholar]
- Girousse C, Moulia B, Silk W, Bonnemain JL (2005) Aphid infestation causes different changes in carbon and nitrogen allocation in alfalfa stems as well as different inhibitions of longitudinal and radial expansion. Plant Physiol 137 1474–1484 [DOI] [PMC free article] [PubMed] [Google Scholar]
- Goodwin RH, Avers W (1956) Studies on roots. III. An analysis of root growth in Phleum pratense using photomicrographic records. Am J Bot 43 479–487 [Google Scholar]
- Goodwin RH, Stepka W (1945) Growth and differentiation in the root tip of Phleum pratense. Am J Bot 32 36–46 [Google Scholar]
- Gould KS, Lord EM (1989) A kinematic analysis of tepal growth in Lilium longiflorum. Planta 177 66–73 [DOI] [PubMed] [Google Scholar]
- Granier C, Tardieu F (1998) Spatial and temporal analyses of expansion and cell cycle in sunflower leaves. A common pattern of development for all zones of a leaf and different leaves of a plant. Plant Physiol 116 991–1001 [DOI] [PMC free article] [PubMed] [Google Scholar]
- Granier C, Tardieu F (1999) Water deficit and spatial pattern of leaf development. Variability in responses can be simulated using a simple model of leaf development. Plant Physiol 119 609–620 [DOI] [PMC free article] [PubMed] [Google Scholar]
- Hu Y, Camp KH, Schmidhalter U (2000) Kinetics and spatial distribution of leaf elongation of wheat (Triticum aestivum L.) under saline soil conditions. Int J Plant Sci 161 575–582 [Google Scholar]
- Jahne B (1997) Digital Image Processing: Concepts, Algorithms, and Scientific Applications, Ed 4. Springer, Berlin
- Kavanova M, Grimoldi AA, Lattanzi FA, Schnyder H (2006) Phosphorus nutrition and mycorrhiza effects on grass leaf growth. P status- and size-mediated effects on growth zone kinematics. Plant Cell Environ 29 511–520 [DOI] [PubMed] [Google Scholar]
- Liang BM, Sharp RE, Baskin TI (1997) Regulation of growth anisotropy in well-watered and water-stressed maize roots. 1. Spatial distribution of longitudinal, radial, and tangential expansion rates. Plant Physiol 115 101–111 [DOI] [PMC free article] [PubMed] [Google Scholar]
- Ma Z, Baskin TI, Brown KM, Lynch JP (2003) Regulation of root elongation under phosphorus stress involves changes in ethylene responsiveness. Plant Physiol 131 1381–1390 [DOI] [PMC free article] [PubMed] [Google Scholar]
- Muller B, Strosser M, Tardieu F (1998) Spatial distributions of tissue expansion and cell division rates are related to sugar content in the growing zone of maize roots. Plant Cell Environ 21 149–158 [Google Scholar]
- Pahlavanian AM, Silk WK (1988) Effect of temperature on spatial and temporal aspects of growth in the primary maize root. Plant Physiol 87 529–532 [DOI] [PMC free article] [PubMed] [Google Scholar]
- Press WH, Teukolsky SA, Vetterling WT, Flannerty BP (1992) Numerical Recipes in C: The Art of Scientific Computing, Ed 2. Cambridge University Press, New York
- Prewitt JMS (1970) Object enhancement and extraction. In EBS Lipkin, A Rosenfield, eds, Picture Processing and Psychopictorics. Academic Press, New York, pp 75–149
- Sacks MM, Silk WK, Burman P (1997) Effect of water stress on cortical cell division rates within the apical meristem of primary roots of maize. Plant Physiol 114 519–527 [DOI] [PMC free article] [PubMed] [Google Scholar]
- Schmundt D, Stitt M, Jahne B, Schurr U (1998) Quantitative analysis of the local rates of growth of dicot leaves at a high temporal and spatial resolution, using image sequence analysis. Plant J 16 505–514 [Google Scholar]
- Selker JML, Sievers A (1987) Analysis of extension and curvature during the graviresponse in Lepidium roots. Am J Bot 74 1863–1871 [Google Scholar]
- Sharp R, Silk W, Hsaio T (1988) Growth of the maize primary root at low water potentials. I. Spatial distribution of expansive growth. Plant Physiol 87 50–57 [DOI] [PMC free article] [PubMed] [Google Scholar]
- Sharp RE, Poroyko V, Hejlek LG, Spollen WG, Springer GK, Bohnert HJ, Nguyen HT (2004) Root growth maintenance during water deficits: physiology to functional genomics. J Exp Bot 55 2343–2351 [DOI] [PubMed] [Google Scholar]
- Silk WK, Erickson RO (1978) Kinematics of hypocotyl curvature. Am J Bot 65 310–319 [Google Scholar]
- Silk WK, Erickson RO (1979) Kinematics of plant growth. J Theor Biol 76 481–501 [DOI] [PubMed] [Google Scholar]
- Sobel I (1978) Neighborhood coding of binary images for fast contour following and general binary array processing. Computer Graphics and Image Processing 8 127–135 [Google Scholar]
- Taiz L, Zeiger E (1998) Plant Physiology, Ed 2. Sinauer Associates, Sunderland, MA
- van der Weele CM, Jiang HS, Palaniappan KK, Ivanov VB, Palaniappan K, Baskin TI (2003) A new algorithm for computational image analysis of deformable motion at high spatial and temporal resolution applied to root growth. Roughly uniform elongation in the meristem and also, after an abrupt acceleration, in the elongation zone. Plant Physiol 132 1138–1148 [DOI] [PMC free article] [PubMed] [Google Scholar]
- Walter A, Spies H, Terjung S, Kusters R, Kirchgessner N, Schurr U (2002) Spatio-temporal dynamics of expansion growth in roots: automatic quantification of diurnal course and temperature response by digital image sequence processing. J Exp Bot 53 689–698 [DOI] [PubMed] [Google Scholar]
Associated Data
This section collects any data citations, data availability statements, or supplementary materials included in this article.


