

Abstract
Hippocampal CA1 pyramidal neurons receive intrahippocampal and extrahipppocampal inputs during theta cycle, whose relative timing and magnitude regulate the probability of CA1 pyramidal cell spiking. Extrahippocampal inputs, giving rise to the primary theta dipole in CA1 stratum lacunosum moleculare, are conveyed by the temporoammonic pathway. The temporoammonic pathway impinging onto the CA1 distal apical dendritic tuft is the most electrotonically distant from the perisomatic region yet is critical in regulating CA1 place cell activity during theta cycles. How does local hippocampal circuitry regulate the integration of this essential, but electrotonically distant, input within the theta period? Using whole-cell somatic recording and voltage-sensitive dye imaging with simultaneous dendritic recording of CA1 pyramidal cell responses, we demonstrate that temporoammonic EPSPs are normally compartmentalized to the apical dendritic tuft by feedforward inhibition. However, when this input is preceded at a one-half theta cycle interval by proximally targeted Schaffer collateral activity, temporoammonic EPSPs propagate to the soma through a joint, codependent mechanism involving activation of Schaffer-specific NMDA receptors and presynaptic inhibition of GABAergic terminals. These afferent interactions, tuned for synaptic inputs arriving one-half theta interval apart, are in turn modulated by feedback inhibition initiated via axon collaterals of pyramidal cells. Therefore, CA1 circuit integration of excitatory inputs endows the CA1 principal cell with a novel property: the ability to function as a temporally specific “AND” gate that provides for sequence-dependent readout of distal inputs.
Keywords: voltage-sensitive dye imaging, circuit integration, temporoammonic, inhibition, gating, theta cycle
Introduction
During exploratory locomotion and rapid eye movement sleep in rodents, the hippocampus exhibits rhythmic oscillatory field potentials at frequencies ranging from 4 to 10 Hz (theta frequency) (Vanderwolf, 1969; Winson, 1974; Kamondi et al., 1998; Lisman, 1999; Buzsáki, 2002). Theta oscillations are thought to represent the on-line state of the hippocampus, with the synchronization of hippocampal neurons during theta activity serving as a reference for information encoding by hippocampal place cells (Buzsáki and Chrobak, 1995; Skaggs et al., 1996; Jensen and Lisman, 2000; Huxter et al., 2003). Theta oscillations are most prominent in area CA1 stratum lacunosum moleculare (SLM), the terminal field of the temporoammonic pathway. At the trough of the theta wave recorded at the hippocampal fissure, the presence of a maximal current sink in stratum lacunosum moleculare indicates strong excitatory synaptic currents at the synapses innervated by the temporoammonic pathway. This theta dipole disappears with removal of the entorhinal cortex (Kamondi et al., 1998; Buzsáki, 2002). At this same phase, the current source in stratum radiatum (SR) indicates that there is little synaptic activity at the Schaffer collateral synapses. In contrast, at the peak of the CA1 fissure theta wave, synaptic currents in stratum lacunosum moleculare are weak, whereas inputs at Schaffer collateral synapses in stratum radiatum are strong (Brankack et al., 1993). The presence of phase-shifted dipole sinks in CA1 stratum radiatum shows that CA3 output contributes to theta field in this lamina (Buzsáki et al., 1986; Brankack et al., 1993), and recent studies demonstrate that CA3 circuitry may function as an intrahippocampal theta oscillator (Kocsis et al., 1999). Modeling studies have suggested that encoding and context-dependent retrieval of memories in hippocampal CA1 is most effective when CA1 pyramidal neurons receive phase-shifted afferent inputs at one-half theta interval (Hasselmo et al., 2002). In the behaving animal, the relative magnitude and phase relationship between the intrahippocampal (CA3) and extrahipppocampal (temporoammonic) inputs may be responsible for the timing of CA1 pyramidal neurons spiking during theta cycle (Kocsis et al., 1999; Buzsáki, 2002).
In the present study, using whole-cell recordings and taking advantage of the laminar-specific information provided by voltage-sensitive dye imaging, we describe the regulation of temporoammonic inputs through interactions with specific excitatory and inhibitory pathways that activate spatially restricted dendritic compartments during the theta interval. Thus, we are able to measure the salient feature determining the efficacy of an excitatory synaptic input: its ability to propagate to the axon initial segment and regulate the action potential output of a pyramidal neuron. We find that circuit integration of excitatory inputs through the joint activation of NMDA-receptor and presynaptic inhibition of GABAergic terminals confers on the CA1 pyramidal neuron the properties of a temporally specific and sequence dependent “AND” gate in which the temporal order by which CA3 is activated before temporoammonic inputs allows the cell access to cortical information. These interactions are tuned for afferent inputs arriving at one-half theta interval. The function of this gate is further regulated in an activity-dependent manner by dendritically targeted feedback inhibition.
Materials and Methods
Hippocampal slice preparation. Male rats, 4-8 weeks old, were decapitated, and their brains were removed and blocked in ice-cold artificial CSF (ACSF) (in mm: 130 sucrose, 3 KCl, 1.25 NaHPO4, 1 MgCl2, 2 CaCl2, 26 NaHCO3, and 10 dextrose), in which NaCl was replaced with an equal osmolar concentration of sucrose. Hippocampal slices (400 μm) were cut at 12° off horizontal (Rafiq et al., 1993) with a vibrating tissue slicer (VT1000S; Leica, Deerfield, IL). Vibratome cuts at this angle provide three to four optimal slices with well preserved hippocampal-entorhinal cortical connections per animal. A cut was made between the CA1 and CA3 subfields to eliminate the possibility of recording reverberations from CA3 and disynaptic activation via the perforant path projection to CA3. Slices were allowed to recover in a static interface chamber at 34°C for 30 min and then stored at room temperature for up to 6 h.
Optical recording. Slices were stained with 0.125 mg/ml RH-795 (4-[4-[4-(diethylamino)phenyl]-1,3-butadienyl]-1-[2-hydroxy-3-[(2-hydroxyethyl) dimethylammonio]propyl]-dibromide) (Molecular Probes, Eugene, OR) in ACSF for 10 min and imaged in an oxygenated interface chamber using a fast 80 × 80 CCD camera recording at a 2 kHz frame rate (NeuroCCD; RedShirtImaging, Fairfield, CT). Epi-illumination was provided by a 150 W xenon lamp driven by a stable power supply (Opti Quip, Highland Mills, NY). The well size (215,000 electrons) of the CCD chip force the use of low-light intensities, and thus we avoided photodynamic damage to the brain tissue that frequently arise from the use of high-light intensities (Momose-Sato et al., 1995). Optical recording trials were 1 s long, with 30-50 trials per slice. At the light intensity that we are using, the evoked synaptic activity did not change noticeably after 50 s of total exposure time, further indicating that phototoxicity was insignificant in our experiments. A 4× objective lens (0.28 numerical aperture; Olympus Optical, Tokyo, Japan) focused the light on the region of interest in hippocampal area CA1. The image area was 1.92 × 1.92 mm. Each pixel collected light from a 24 × 24 μm region (see Fig. 2 A). An apical dendrite of a CA1 pyramidal neuron extends 600-800 μm, and, therefore, we were able to record voltage in 24-32 separate dendritic compartments simultaneously at a high sampling frequency (2 kHz) along the long axis of the dendrite, a necessary prerequisite to understand the role played by spatially restricted excitatory and inhibitory inputs in circuit integration. Throughout the recording, the temperature in the imaging chamber was maintained at 34 ± 1°C.
Figure 2.

Subthreshold membrane potential changes in the apical dendrites of CA1 pyramidal cell in stratum radiatum are closely correlated with the local voltage-sensitive dye signal. A, A schematic illustration of the optical setup used in the study. The voltage-sensitive dye signal is recorded with a CCD camera simultaneously with dendritic whole-cell recordings. I-clamp, Current clamp; HEC, hippocampal-entorhinal cortical slice. B, The current-clamp dendritic recording in response to a single stimulus applied in stratum radiatum is superimposed onto the local voltage-sensitive dye signal quantified from a region of interest near the recording electrode in stratum radiatum. Changes in the membrane potential of the CA1 apical dendrite appear to be closely correlated with the voltage-sensitive dye signal, which presumably results from dendritic activity of many CA1 pyramidal neurons. C, For the recordings shown in B, changes in the local voltage-sensitive dye fluorescence are plotted as a function of the changes in membrane potential of the CA1 apical dendrite. The two measurements are correlated linearly with a linear correlation coefficient of r = 0.95. D, Residuals of the linear fit in C fitted to the function plotted as changes in the local voltage-sensitive dye fluorescence against the changes in membrane potential of the CA1 apical dendrite indicate that there is no systematic variability in the voltage-sensitive dye signal not accounted for by the change in dendritic membrane potential recorded with the patch electrode. The voltage-sensitive dye signals were averaged over 12 trials. E, Summary data of all current-clamp recordings (n = 18) in which each current-clamp recording having a 10 mV change in membrane voltage from the baseline is plotted as a function of the local voltage-sensitive dye responses. Bin width is 0.025% ΔF/F.
Electrophysiological methods. Bipolar tungsten electrodes were used for stimulation (World Precision Instruments, Sarasota, FL). A field-recording electrode was positioned in the CA1 cell body layer to monitor field activity. A stimulating electrode was placed in the alveus to antidromically activate CA1 cells, a second electrode was placed in stratum radiatum to stimulate the Schaffer collateral axons, and a third electrode was positioned in the temporoammonic pathway to stimulate stratum lacunosum moleculare afferents. Although it was possible that we might have antidromically activated the Schaffer collaterals when we stimulated in stratum lacunosum moleculare, this was unlikely because the stimulating electrode was always positioned within 100 μm of the hippocampal fissure in stratum lacunosum moleculare in which axons from layer III entorhinal cortical cells are known to terminate preferentially (Steward and Scoville, 1976; Witter et al., 1988). Stimuli, consisting of 200 μs pulses at 40-100 μA, were delivered through stimulus isolation units (World Precision Instruments). Whole-cell somatic and dendritic patch recordings were performed using the Blanton blind patch technique (Blanton et al., 1989), and electrodes were 6-8 MΩ and filled with potassium gluconate-based intracellular solution (in mm: 145 K-gluconate, 2 MgCl2, 2 ATP·Mg, 0.5 GTP·Tris, 0.1 BAPTA, 2.5 KCl, 2.5 NaCl, and 10 HEPES). An Axoclamp 2A amplifier (Molecular Devices, Union City, CA) was used to perform the current-clamp recordings, responses were collected in both the imaging software at frame rate resolution (2 kHz) and on a separate computer digitized at 20 kHz using Axoclamp software. Drugs were applied by dilution of concentrated stock solutions into the perfusion medium. AP-5 [l-(+)-2-amino-5-phosphonopentanoic acid], MK 801 [(+)-5-methyl-10,11-dihydro-5H-dibenzo [a,d] cyclohepten-5, 10-imine maleate], ZD 7288 (4-ethylphenylamino-1, 2-dimethyl-6-methylaminopy-rimidinium chloride), gabazine [6-lmino-3-(4-methoxyphenyl)-1 (6H)-pyridazinebutanoic acid hydrobromide], CGP 55845A [(2S)-3-{[(15)-1-(3,4-dichlorophenyl)ethyl]amino-2-hydroxypropyl)(phenylmethyl) phosphinic acid], and DNQX (6,7-dinitroquinoxaline-2,3-dione) were obtained from Tocris Cookson (Ellisville, MO).
Data analysis. All analysis was performed in IGOR (WaveMetrics, Lake Oswego, OR) on averages of 12 trials. A reference frame was calculated as the average of 40 frames (0.4 ms integration time) preceding the stimulation. The data were displayed as the change in fluorescence divided by the resting fluorescence (ΔF/F). This minimizes variations in the signal attributable to differences in dye concentration and illumination intensity. To compensate for photobleaching, fitted double exponentials were subtracted from normalized ΔF/F. A depolarization of membrane potential produces a reduction in ΔF/F, or a downward deflection. To be consistent with electrophysiological conventions, ΔF/F signals were inverted so that depolarizations were displayed as positive signals (warmer colors) and hyperpolarizations represented as negative signals (colder colors). To enhance the relatively smaller amplitude hyperpolarizations and depolarizations associated with throughput of distal EPSPs propagation to the soma, the pseudo-color scale was artificially saturated at 0.1% ΔF/F in some experiments. The different layers in the hippocampal CA1 were visually identified. Local voltage-sensitive dye signals were quantified from regions of interest in stratum oriens (SO), SR, and SLM.
To study the spatiotemporal pattern of pathway activation, we generated raster line scans to yield activation profile images (Contreras and Llinás, 2001). At baseline, an arbitrary line is drawn from stratum oriens to the hippocampal fissure over the slice image, and the fluorescence signal from those pixels that fall under the line is recorded. This procedure is repeated for all sampling points in time to yield a stack of lines, with each line corresponding to a point in time and each point on a line corresponding to the fluorescence signal of the pixel (that falls under the line) at that time point. These one-dimensional lines when stacked together in time would yield a two-dimensional activation profile image, with the vertical axis depicting time and the horizontal axis representing distance from stratum oriens to the hippocampal fissure. To make comparisons between groups, we averaged the peak response of the area under the local voltage-sensitive dye signals (ΔF/F) from regions of interest in stratum oriens, stratum radiatum, and stratum lacunosum moleculare during an integration window of interest corresponding to the peak of the temporoammonic response in control. Significance between groups was determined using Student's t test in Matlab (MathWorks, Natick, MA). Data reported as significant achieved p ≤ 0.05 level. ANOVA was performed when appropriate.
Results
Our database of voltage-sensitive dye recordings were obtained from 36 slices. Simultaneous dendritic whole-cell recordings in stratum radiatum were made from 24 slices. Somatic recordings were performed in 12 additional unstained slices. Only those somatic and dendritic recordings that were stable for >15 min and had resting membrane potentials negative to -60 mV were considered.
CA1 circuit integration of afferent inputs
The temporoammonic pathway consists of axons from layer III entorhinal cortical neurons that fire at high frequency in vivo (Chrobak and Buzsáki, 1998). Therefore, to activate the axons of these layer III entorhinal cortical neurons in a similar manner, we applied a burst stimulus (four stimuli at 100 Hz) in SLM. Somatic recordings at rest (-64 mV) reveal an inhibitory response (-3.2 ± 0.35 mV, mean ± SEM; n = 12) (Fig. 1B). Our results are consistent with previous studies that found little or no evidence for somatic excitation after temporoammonic pathway stimulation (Buzsáki et al., 1995; Empson and Heinemann, 1995; Soltesz, 1995) but seemingly are at odds with hippocampal place cell studies indicating that temporoammonic inputs are necessary in regulating the specific firing properties of CA1 place cells during theta cycles (Csicsvari et al., 1999; Brun et al., 2002).
Figure 1.
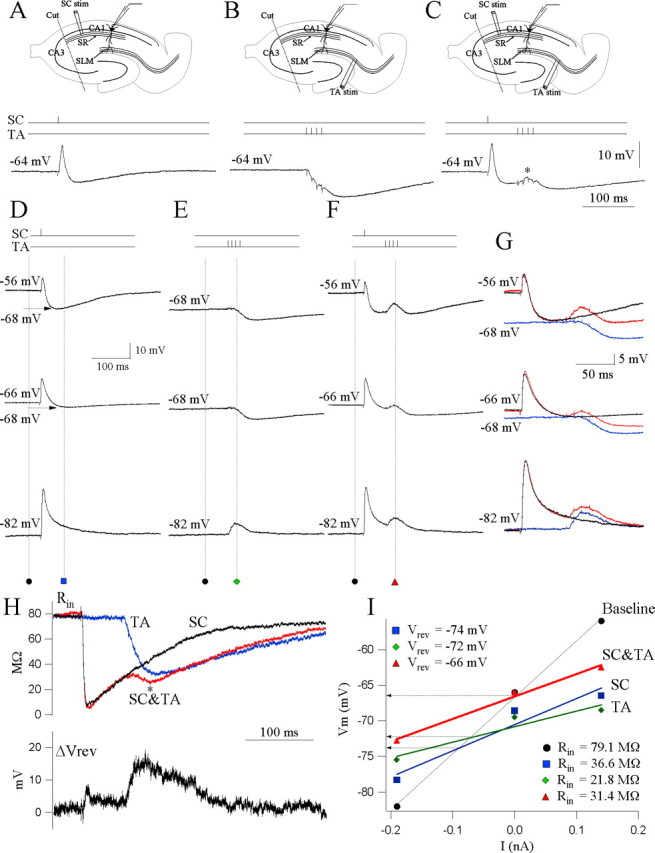
CA1 circuit integration of afferent inputs. A, Schaffer (SC) pathway stimulation. An example of a current-clamp somatic response to a single stimulus applied in stratum radiatum. The resting potential of the cell is -64 mV. The schematic shows the recording setup: one stimulating electrode is used to stimulate the Schaffer collaterals (SC). Somatic patch recording from CA1 pyramidal neurons records responses elicited by Schaffer stimulation. B, Temporoammonic (TA) pathway stimulation. Current-clamp response of the same cell to a burst of four stimuli at 100 Hz applied in stratum lacunosum moleculare. Note the inhibitory somatic response. Recording setup, One stimulating electrode is used to stimulate the temporoammonic axons (TA). Somatic patch recording from CA1 pyramidal neurons records responses elicited by temporoammonic stimulation. C, Schaffer-temporoammonic (SC&TA) pathway stimulation. Current-clamp response of the same cell to paired Schaffer and temporoammonic stimulation such that a single Schaffer stimulus precedes the temporoammonic burst stimulus by 60 ms. Note the integrated response recorded at the soma (asterisk). Similar results are obtained from 12 cells. Recording setup, Two stimulating electrodes are used, one to stimulate the Schaffer collaterals and the other to stimulate the temporoammonic axons (TA). Somatic patch recording from CA1 pyramidal neurons records responses elicited by the Schaffer-temporoammonic stimulation. D, Vm at rest (-68 mV) was displaced to depolarized (-56 mV, 0.14 nA) and hyperpolarized (-84 mV, -0.19 nA) levels by current injection. Recordings are from a different cell than that depicted in A-C. E, Responses to temporoammonic (TA) pathway stimulation at the three levels of Vm in the same cell as D. F, Integrated output of the soma to Schaffer-temporoammonic stimulation measured at three levels of Vm. G, Superimposed traces from D-F. Black, SC; blue, TA; red, SC&TA. H, Top, Calculated plots of the time continuous input resistance (Rin) throughout the synaptic response for the three stimulus conditions. Black, SC; blue, TA; red, SC&TA. Bottom, Calculated plot of the subtracted continuous Vrev. Note the depolarizing shift in Vrev during the Schaffer-gated temporoammonic response. I, I-V plot of the synaptic responses to Schaffer, temporoammonic, and Schaffer-temporoammonic stimulations. Measurements were made at baseline (square) and at the time point corresponding to the peak of the gating effect. Lines are the best linear fit to each set of points, and Rin (values indicated) is the slope of the line. Intersection of the lines with the baseline indicate the apparent reversal potential of the particular response.
Schaffer collaterals, targeting the proximal CA1 apical dendrites, are one of the primary sources of excitatory input to hippocampal area CA1. Synaptic activation of Schaffer collaterals evoked a prominent somatic EPSP (15.8 ± 1.35 mV), followed by an IPSP (-3.45 ± 0.44 mV; n = 12) (Fig. 1A). We were interested in how activation of this powerful proximal excitatory pathway might influence the integration of distal temporoammonic inputs. It has been shown previously that simultaneous inputs onto a CA1 cell from the Schaffer and temporoammonic pathways can sum to make the cell more excitable (Remondes and Schuman, 2002; Roxin et al., 2003). In contrast, the presence of the late Schaffer-evoked IPSP suggested that activation of temporoammonic inputs during this IPSP would lead to an augmented feedforward inhibitory response in the soma, which would further restrict the ability of the temporoammonic EPSPs to depolarize CA1 cell bodies. We tested this hypothesis experimentally. Surprisingly, when the Schaffer stimulation preceded the temporoammonic burst stimulus by 20-200 ms, we found the opposite. Somatic recordings revealed the de novo appearance of an EPSP (4.5 ± 0.4 mV; n = 12) when the temporoammonic burst stimulus followed Schaffer activation by between 40 and 60 ms, a time coincident with the maximal Schaffer-induced IPSP (n = 12) (Fig. 1C,F, asterisk). These results suggest that circuit integration of previous Schaffer inputs gate temporoammonic activity to the CA1 soma.
To elucidate the specific synaptic components regulating the gating of temporoammonic inputs, we repeated the Schaffer-temporoammonic integration experiments while holding the Vm at different levels. In the example of Figure 1D-F, with the cell at rest (-66 mV), the synaptic response to Schaffer stimulation showed an evoked EPSP, followed by an IPSP that hyperpolarized the cell to -68 mV. To verify that the gating of temporoammonic EPSPs, occurring at the maximal of the Schaffer-induced IPSP, is not attributable to reversal of the temporoammonic IPSP, we recorded the response to temporoammonic pathway activation alone when the cell is hyperpolarized to -68 mV. The somatic recordings nevertheless showed an inhibitory response (-2.1 mV). This demonstrates that the temporoammonic EPSP, when preceded by previous Schaffer stimulation, is not attributable to reversal of the temporoammonic stimulation-induced IPSP. Depolarizing the cell (-56 mV, 0.14 nA) revealed a strong IPSP (-12 mV) that hyperpolarized the cell to -68 mV after the EPSP in response to Schaffer stimulation alone. Stimulating the temporoammonic pathway alone when the cell was hyperpolarized to -68 mV by current injection nevertheless showed an inhibitory response (-2.1 mV). However, the gated temporoammonic EPSPs was ∼3 mV larger than the gating obtained when the cell was at rest. Under hyperpolarization (-84 mV, -0.19 nA), the IPSP after Schaffer and temporoammonic stimulation alone were entirely depolarizing because of the reversal of the IPSP. Figure 1G illustrates the superimposed somatic responses to the different stimulation protocols obtained at different Vm values. To estimate Vrev, we plotted Vm against injected current (I-V plot) at baseline and at selected time points. Vrev was defined as the y value of the intersection of the I-V plot made at baseline with the I-V plot made at each point (Fig. 1I: Schaffer collateral (SC) Vrev, -74 mV; temporoammonic (TA) Vrev, -72 mV; Schaffer and temporoammonic (SC&TA) Vrev, -66 mV). The gated temporoammonic EPSPs was ∼0.8 mV smaller compared with the gated temporoammonic EPSPs obtained when the cell was at rest. The plot of the time continuous Rin (Fig. 1H, top trace) associated with Schaffer-temporoammonic stimulation protocol (SC&TA, red) revealed a secondary drop in Rin (asterisk) when compared with the Rin associated with Schaffer (SC, black) and temporoammonic (TA, blue) stimulation alone. These findings suggest that influx of cationic currents underlie the gating effect. To support this hypothesis, we calculated the continuous plot of the change in Vrev after temporoammonic-Schaffer stimulation subtracted from Schaffer and temporoammonic stimulation alone (Fig. 1H, bottom trace). The subtracted Vrev showed a depolarizing change of +10.6 mV in driving force for the gated temporoammonic-evoked synaptic response.
Our findings obtained with somatic recordings measuring the integrated output of the CA1 circuitry demonstrated that previous Schaffer inputs, phase shifted at one-half theta period, gate temporoammonic activity to the CA1 soma. However, somatic patch-clamp recordings reveal little about the underlying integrative events occurring in more electrotonically distant circuit compartments that may influence propagation of these distal inputs. To further study the spatial and temporal properties of circuit integration of afferent CA1 inputs, we reexamined the Schaffer-temporoammonic integration phenomenon using voltage-sensitive dye imaging together with simultaneous dendritic whole-cell recordings.
Changes in membrane potential of CA1 pyramidal neuron dendrites correlate closely with the local voltage-sensitive dye signal
First, to determine how the change in fluorescence from the voltage-sensitive dye related to changes in membrane voltage, we compared the kinetics and amplitude of Schaffer-evoked voltage-sensitive dye signals in stratum radiatum with simultaneously obtained dendritic whole-cell recordings, also in stratum radiatum. In these voltage-sensitive dye recordings, membrane depolarization was represented as a positive signal (warmer colors), and membrane hyperpolarization was represented as a negative signal (colder colors). Although the voltage-sensitive dye signal presumably results from the summed signals of neuronal ensembles, we found a remarkably close correlation of the voltage-sensitive dye response with the simultaneous dendritic recordings from the apical dendrite in stratum radiatum (Fig. 2B). The kinetics of dendritic membrane potential changes were well matched to local voltage-sensitive dye responses quantified in a 120 × 120 μm region near the recording electrode (n = 18) (Fig. 2C,D). The close correlation of the evoked responses in the patched apical dendrite to the local voltage-sensitive dye fluorescence confirmed that local populations of neurons respond in a quantitatively similar manner to synaptic stimulation (Salzberg et al., 1973, 1983; Contreras and Llinás, 2001; Petersen et al., 2003). The IPSP after the Schaffer-evoked EPSP, shown as membrane hyperpolarization in the dendritic recordings, is reflected as a decrease in the local voltage-sensitive dye fluorescence that has kinetics closely matched to the patch recordings. Furthermore, in a subset of experiments in which alvear stimulation evoked a feedback IPSP visible in the voltage-sensitive dye signal, we confirmed that the voltage-sensitive dye IPSP was attributable to GABAergic inhibition by blocking it with the GABAA antagonist gabazine (1 μm; n = 4; data not shown). Normalizing observed signals ΔF to the resting light intensity F (i.e., ΔF/F) minimizes the differences in slice thickness, dye density, illumination intensity, and a variety of experimental parameters. However, dye bound to nonparticipating membrane (glia and blood vessels) does not contribute to the useful optical signal. Nevertheless, this nonparticipating dye contributes to resting fluorescence and degrades the fractional change in fluorescence (ΔF/F) for the unit change in membrane potential. The calibration of optical signal from multiple sites in terms of membrane potential requires a voltage signal that has a known amplitude at all recording locations on neuronal processes (Djurisic et al., 2004). Such a signal is usually not available. However, because dendritic processes have greater membrane area than cell somata, the voltage-sensitive dye fluorescence signal emphasizes corresponding dendritic activity (Salzberg, 1983; Salzberg et al., 1983; Grinvald et al., 1994) and that the CA1 apical dendrite is a key compartment for integration of excitatory synaptic inputs; therefore, to approximate the changes in fluorescence in these local dendritic compartments, we use patch recordings from the apical dendrite as a calibration signal. For all dendritic recordings, we plotted the change in voltage-sensitive dye fluorescence as a function of the change in membrane potential recorded from the dendrites. This revealed a close linear relationship between the voltage-sensitive dye response and membrane potential. For all experiments, the linear correlation coefficient exceeded 0.9. Thus, for each slice in which we performed simultaneous dendritic recordings, we report both changes in fluorescence (ΔF/F) and the recorded Vm. The linear fit of the change in voltage-sensitive dye fluorescence plotted as a function of membrane potential was similar in all experiments. For 18 patch recording/voltage-sensitive dye experiments, the slope was 0.0998 ± 0.0072%/10 mV (Fig. 2E). Therefore, for a limited region of interest near the patch electrode, a 0.1% change in voltage-sensitive dye fluorescence can be approximated by a 10 mV change in neuronal transmembrane voltages.
Feedforward GABAA-mediated inhibition and intrinsic Ih properties spatially restrict temporoammonic EPSPs to distal CA1 dendrites
Next, we proceeded to study the specific spatial and temporal properties of temporoammonic pathway activation in response to a burst stimulus in stratum lacunosum moleculare. Burst stimulation evoked an augmenting EPSP highly restricted to a strip 100-150 μm wide corresponding to the synaptic target of the temporoammonic pathway: the distal apical tuft of CA1 neurons (Fig. 3A). This strip of activation generated a 0.13% amplitude ΔF/F signal, corresponding to a 10-15 mV depolarization during the temporoammonic-evoked EPSP. Consistent with results described above, there was minimal propagation of this temporoammonic-evoked EPSP to stratum radiatum and stratum oriens. Simultaneous whole-cell patch recordings from proximal dendrites in stratum radiatum confirmed that the temporoammonic activity was segregated because, consistent with the robust distal depolarization seen in the optical recording, the proximal dendrite showed only a small subthreshold membrane depolarization (1.34 ± 0.78 mV; n = 15). However, the amplitudes of temporoammonic-evoked responses were quite variable, with some responses being hyperpolarizing and some depolarizing, which contrasted with the consistent inhibitory responses recorded in the cell soma (Fig. 1B,E). We hypothesized that this was attributable to spatially compartmentalized feedforward inhibition on the apical dendrite. To quantify the amount of inhibition versus excitation along the apical somatodendritic axis of CA1 pyramidal neurons, we plotted the amplitude of the temporoammonic stimulation-evoked response of the CA1 pyramidal cell dendrite versus the position of the patch electrode, normalized as percentage distance between stratum pyramidale to the hippocampal fissure. This revealed that, in response to temporoammonic stimulation, dendritic patch recordings closer to stratum pyramidale (90-80% from the fissure) were mainly inhibitory, whereas recording sites at distances of 75-55% from the fissure were mainly excitatory (Fig. 3C). This suggests that feedforward inhibition activated through direct temporoammonic inputs primarily innervates the soma and proximal dendritic compartment.
Figure 3.
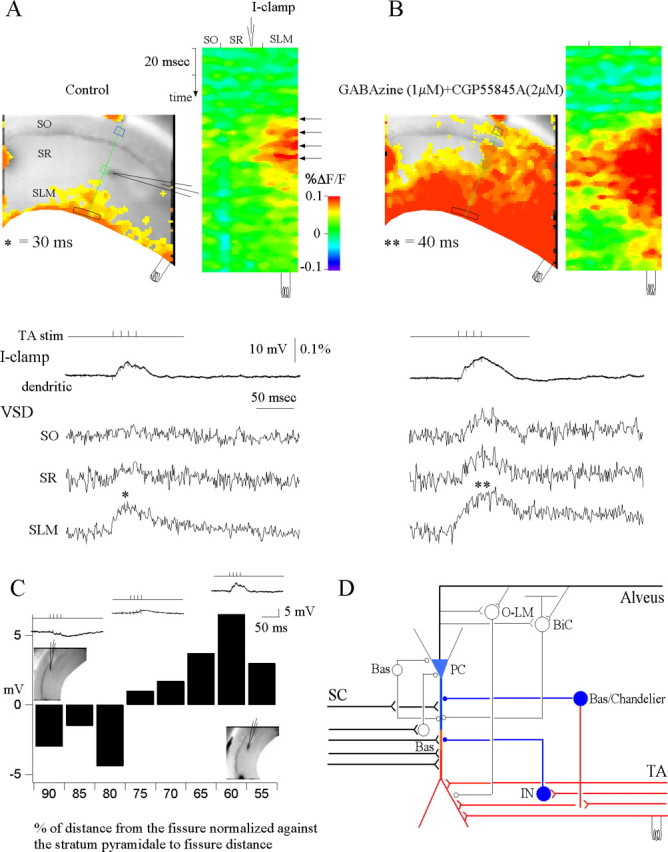
Feedforward GABAA-mediated inhibition activated via temporoammonic pathway stimulation spatially restricts evoked EPSPs to the distal dendrites of the CA1 pyramidal neurons. A, Control. A snapshot of activation at 30 ms of the voltage-sensitive dye (VSD) responses of evoked EPSPs (denoted by asterisk) to a burst stimulus (4 stimuli at 100 HZ) in stratum lacunosum moleculare (left) and the activation profile (right) generated from the raster line scan along the path of interest (green line) (see Materials and Methods). The location of the patch recording electrode is depicted in both the snapshot and raster scan images by the electrode graphic. Top trace, Current-clamp (I-clamp) dendritic shows the simultaneous whole-cell recording from the apical dendrite of a CA1 pyramidal cell in stratum radiatum. VSD SO, SR, and SLM are the local voltage-sensitive dye signals quantified from regions of interest in stratum oriens (blue box), stratum radiatum (green box), and stratum lacunosum moleculare (black box), respectively. The voltage-sensitive dye signals were averaged over 12 trials. Note that the temporoammonic-evoked EPSP is spatially restricted to the extreme distal dendrites of CA1 pyramidal neurons. B, Effects of the GABAA antagonist gabazine (1 μm) and the GABAB antagonist CGP 55845A (2 μm). Left, Snapshot at 40 ms. Note that the blockade of GABAergic inhibition results in loss of spatial segregation of the temporoammonic EPSPs in stratum lacunosum moleculare and significant propagation of temporoammonic EPSPs to stratum radiatum and stratum oriens (n = 4). C, Plot of the current-clamp dendritic whole-cell recordings along the somatodendritic axis of the CA1 pyramidal neuron in response to a burst stimulus in stratum lacunosum moleculare, as a function of the normalized distance of the patch electrode from the hippocampal fissure to stratum pyramidale. Insets show the relative current-clamp dendritic specimen records and locations of the patch electrode. Note that temporoammonic-evoked IPSPs are prevalent in recordings close to the cell somata, whereas EPSPs are prevalent in recordings from more distal dendrites. D, Schematic of the CA1 local circuitry showing the response to temporoammonic stimulation. Red represents excitation and blue represents inhibition. SC, Schaffer collateral; TA, temporoammonic pathway; PC, pyramidal cell; O-LM, oriens-lacunosum-moleculare interneuron; BiC, bistratified cell; Bas, basket cell; Chandelier, chandelier cell; IN, interneuron.
To verify that feedforward inhibition was responsible for compartmentalizing temporoammonic inputs to the distal apical tuft, we assessed temporoammonic responses in the presence of the GABAA receptor antagonist gabazine (1 μm) and the GABAB receptor antagonist CGP 55845A (2 μm). Stimulation of the temporoammonic pathway in the presence of GABA antagonists resulted in the loss of temporoammonic pathway segregation and significantly enhanced propagation of the temporoammonic EPSPs to the CA1 pyramidal cell soma (Fig. 3B) (CGP 55845A alone had no significant effect). This was reflected in the whole-cell recordings from the CA1 apical dendrite in stratum radiatum, which, in the presence of the GABA antagonists, showed a 4.1 mV increase in EPSP size over control after temporoammonic stimulation (n = 4). The feedforward inhibition evoked through temporoammonic stimulation was small and, although present as a hyperpolarization in the current-clamp recordings proximal to the cell soma, was not always resolved by the voltage-sensitive dye fluorescence (but see Figs. 5B, 6B). This temporoammonic-evoked inhibition was unveiled through the perfusion of gabazine. Thus, feedforward inhibition is necessary to limit temporoammonic EPSPs to the distal dendrites, and, without inhibitory regulation, temporoammonic inputs propagate to the soma. Although the exact interneurons mediating this feedforward inhibition have yet to be characterized, basket and chandelier cells that send projections to the CA1 pyramidal cell soma and proximal dendrites have been identified as postsynaptic targets of temporoammonic axons (Kiss et al., 1996). Thus, as the schematic in Figure 3D proposes, in the CA1 local circuitry, inhibitory feedforward interneurons compartmentalize temporoammonic EPSPs to the apical tuft, and, without inhibition, dendritic intrinsic properties permit propagation of temporoammonic inputs to the soma.
Figure 5.

Circuit integration: activation of NMDA receptors gates temporoammonic EPSPs. A, Schaffer (SC) pathway stimulation. Top trace, Current-clamp (I-clamp) dendritic shows the simultaneous whole-cell recording from the apical dendrite of a CA1 pyramidal cell in response to a single stimulus applied in stratum radiatum. VSD SO, SR, and SLM are the local voltage-sensitive dye (VSD) signals quantified from regions of interest in stratum oriens (blue box), stratum radiatum (green box), and stratum lacunosum moleculare (black box), respectively (see grayscale image in inset). The activation profile image, generated from the raster line scan along the path of interest (green line), shows the spatiotemporal response to a Schaffer collateral stimulus that returns to baseline and does not exhibit prolonged depolarization in stratum radiatum during the time window in which the temporoammonic pathway is activated. SC, Schaffer collateral stimulation; TA, temporoammonic stimulation. The location of the patch recording and stimulating electrodes are schematically depicted by graphics above and below the raster scan, respectively. The voltage-sensitive dye signals were averaged over 12 trials. Alv stim, Alveus stimulation. B, Temporoammonic (TA) pathway stimulation. Note that the voltage-sensitive dye response is spatially restricted to the apical tuft in stratum lacunosum moleculare, and the current-clamp dendritic recording of a CA1 pyramidal neuron apical dendrite in stratum radiatum shows an inhibitory response. C, Schaffer-temporoammonic (SC&TA) pathway stimulation. The Schaffer and temporoammonic stimulus are paired so that a single Schaffer stimulus precedes the temporoammonic burst stimulus by 40 ms. With the previous Schaffer stimulus, the temporoammonic inputs integrate synergistically and propagate to stratum radiatum and stratum oriens. The asterisk denotes gating of temporoammonic EPSPs to stratum radiatum and stratum oriens (n = 9). D, Schaffer-temporoammonic pathway stimulation (SC&TA) with the NMDA receptor antagonist AP-5 (50 μm). In the presence of AP-5, the Schaffer and temporoammonic stimulus are paired so that a single Schaffer stimulus precedes the temporoammonic burst stimulus by 40 ms. AP-5 significantly blocks the gating of temporoammonic EPSPs to stratum radiatum and stratum oriens (**p = 0.05; ANOVA; n = 4).
Figure 6.
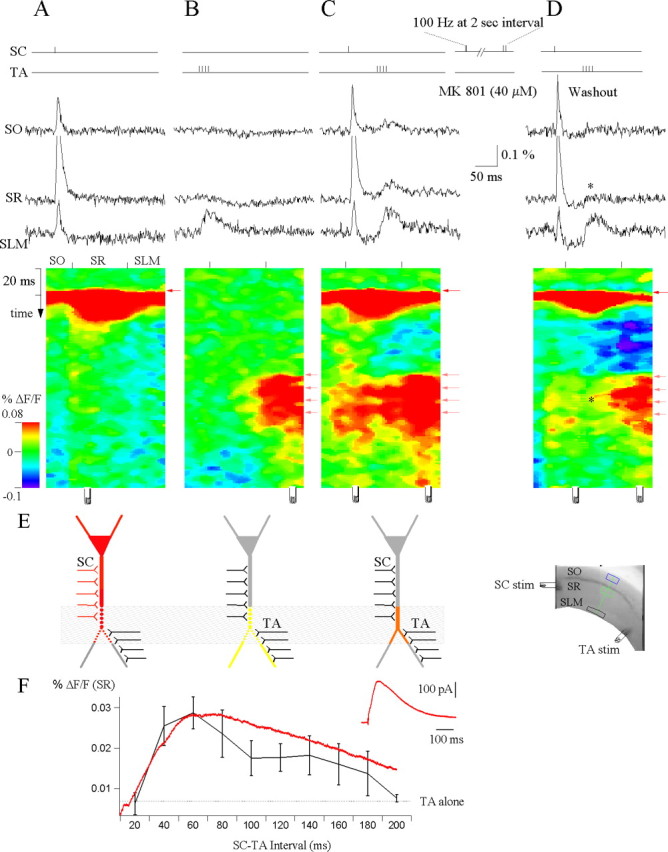
NMDA receptors specific to stratum radiatum mediate propagation of temporoammonic EPSPs. A, Schaffer (SC) pathway stimulation. VSD SO, SR, and SLM are the local voltage-sensitive dye (VSD) signals quantified from regions of interest in stratum oriens (blue box), stratum radiatum (green box), and stratum lacunosum moleculare (black box), respectively (see grayscale image in inset). The activation profile image, generated from the raster scan of the path of interest (green line), shows the spatiotemporal response to the Schaffer collateral stimulus that returns to baseline and does not exhibit prolonged depolarization in stratum radiatum during the time window in which the temporoammonic (TA) pathway is activated. Site of the stimulation electrode is depicted below the raster scans, respectively. The voltage-sensitive dye signals were averaged over 12 trials. B, Temporoammonic (TA) pathway stimulation. Note that the voltage-sensitive dye signal revealed an inhibitory response in stratum radiatum and is compartmentalized to the apical tuft in stratum lacunosum moleculare. C, Schaffer-temporoammonic (SC&TA) pathway stimulation. The Schaffer and temporoammonic stimulus are paired so that a single Schaffer stimulus precedes the temporoammonic burst stimulus by 60 ms. Propagation of temporoammonic EPSPs is gated to stratum radiatum and stratum oriens. To preblock the NMDA receptors in stratum radiatum, the Schaffer collaterals are stimulated with a paired stimulus at 100 Hz every 2 s for 10 min in the presence of the use-dependent NMDA antagonist MK 801 (40 μm). D, Schaffer-temporoammonic (SC&TA) pathway stimulation. After washout of MK 801, the Schaffer-specific NMDA receptors remain blocked, and now the Schaffer-temporoammonic stimulation showed that gating of EPSPs to stratum radiatum and stratum oriens are significantly suppressed (*p = 0.05; ANOVA; n = 3). E, Diagram indicating the dendritic compartments of a neuron activated by (from left to right) Schaffer collateral, temporoammonic, and Schaffer-temporoammonic pathway stimulation. The shaded box indicates the overlapping compartments that are both activated by Schaffer stimulation and subsequently depolarized by temporoammonic activity, thereby leading to unblocking of NMDA receptors in these overlapping regions. F, Temporoammonic throughput as a function of Schaffer-temporoammonic interval. Voltage-sensitive dye responses from stratum radiatum were quantified from a region of interest in stratum radiatum for different intervals in which Schaffer collateral stimulus precedes temporoammonic stimulation (n = 7). Superimposed (red) is the voltage-clamp recording of the Schaffer collateral-activated NMDA EPSC from the CA1 apical dendrite held at +40 mV and isolated using the pharmacological scheme containing 1 μm gabazine and 10 μm DNQX (n = 3). Note that the largest voltage-sensitive dye response was obtained when the Schaffer-temporoammonic interval lies between 40 and 60 ms, and this corresponds to the peak of the NMDA EPSC. The inset shows the Schaffer collateral-activated NMDA EPSC (n = 3) from the CA1 apical dendrite held at +40 mV.
One of the principal conductances regulating circuit integration in CA1 pyramidal neurons is Ih (Magee, 2000). In CA1 dendrites, the increased density of hyperpolarization-activated cation channels (Ih) results in a lower input resistance than the soma, which constrains EPSP activation and propagation (Shah et al., 2004). To test whether Ih also has a role in regulating propagation of temporoammonic EPSPs to the soma, we perfused the Ih antagonist ZD 7288 (20 μm). Application of ZD 7288 significantly facilitated the spread of EPSPs to stratum radaitum and stratum oriens (SR, 0.0048 ± 0.0029% ΔF/F (control) vs ZD 7288, 0.025 ± 0.0037% ΔF/F; SO, 0.0047 ± 0.0032% ΔF/F (control) vs ZD 7288, 0.03 ± 0.0073% ΔF/F; ANOVA, p ≤ 0.05; n = 5) (Fig. 4). This is consistent with the role of Ih in reducing dendritic input resistance. Therefore, temporoammonic inputs are compartmentalized to the apical tuft by feedforward GABAergic inhibition as well as intrinsic Ih properties. Loss of Ih is a frequent phototoxic side effect complicating analysis in voltage-sensitive dye studies (Momose-Sato et al., 1995). The fact that Ih remains functionally prominent further indicates that phototoxic side effects are minimal in the present studies, as have also been shown by in vivo and in vitro studies (Contreras and Llinás, 2001; Ma et al., 2004; Obaid et al., 2004).
Figure 4.

Intrinsic Ih properties spatially restrict propagation of temporoammonic EPSPs. A, Control. A snapshot of activation at 20 ms of the voltage-sensitive dye (VSD) responses of evoked EPSPs (asterisk) to a burst stimulus (4 stimuli at 100 HZ) in stratum lacunosum moleculare (left) and the activation profile (right) generated from the raster line scan along the path of interest (green line) (see Materials and Methods). VSD SO, SR, and SLM are the local voltage-sensitive dye signals quantified from regions of interest in stratum oriens (blue box), stratum radiatum (green box), and stratum lacunosum moleculare (black box), respectively. The voltage-sensitive dye signals were averaged over 12 trials. Note that the temporoammonic-evoked EPSP is spatially restricted to the extreme distal dendrites of CA1 pyramidal neurons. B, Perfusion of the Ih antagonist ZD 7288 (20 μm) results in significant facilitation of temporoammonic EPSPs to stratum radiatum and stratum oriens (**p ≤ 0.05, ANOVA; n = 4). Left, Snapshot at 40 ms. The inset compares the voltage-sensitive dye responses in stratum lacunosum moleculare and stratum radiatum in control (black) and in the presence of ZD 7288 (red).
Circuit integration: activation of NMDA receptors gates temporoammonic EPSPs
To more readily study the spatiotemporal pattern of circuit integration in different directions and planes, we generated raster line scans to yield temporal activation profiles (see Materials and Methods) for the temporoammonic-Schaffer integration experiments. This allowed us to visualize changes in voltage along the apical dendritic axis (left to right) over time (down) (see Figs. 5C, 6C,7C,8D). Dendritic whole-cell recording that, in control conditions, showed a -0.48 ± 1.05 mV IPSP when paired with previous Schaffer stimulation, produced a 5.1 ± 0.8 mV EPSP (n = 9) with a corresponding 0.049 ± 0.005% amplitude ΔF/F signal (n = 9) in stratum radiatum. This activation profile in response to the Schaffer-temporoammonic stimulation demonstrates that previous Schaffer activity created a condition that allowed the temporoammonic EPSPs to overcome feedforward inhibition and propagate to the soma. Similar results were obtained when we stimulated the temporoammonic pathway axons via the angular bundle (data not shown; Witter et al., 1989). We hypothesize that enhanced propagation is attributable to a direct effect on the proximal dendrite in stratum radiatum because, when we quantified regions of interest in stratum lacunosum moleculare, we found that previous Schaffer inputs produce no significant enhancement of temporoammonic EPSPs in stratum lacunosum moleculare (to 119.7 ± 16.8% of temporoammonic alone values; n = 9) (see Fig. 9C). Therefore, previous Schaffer activity is not providing significant heterosynaptic facilitation of temporoammonic inputs but is more likely acting directly on the proximal dendrite to increase propagation.
Figure 7.

Presynaptic GABAB inhibition mediates propagation of temporoammonic EPSPs. A, Temporoammonic (TA) pathway stimulation. The activation profile image, generated from the raster scan of the path of interest, shows the spatiotemporal response to the TA burst stimulus. Note that the voltage-sensitive dye (VSD) signal revealed an inhibitory response in SR, whereas the excitatory response is compartmentalized to the apical tuft in SLM. SC, Schaffer collateral stimulation; TA, TA stimulation. The voltage-sensitive dye signals were averaged over 12 trials. B, Schaffer (SC) pathway stimulation. The activation profile image shows the spatiotemporal response to the Schaffer collateral stimulus that returns to baseline and does not exhibit prolonged depolarization in stratum radiatum during the time window in which the TA pathway is activated. C, Schaffer-temporoammonic (SC&TA) pathway stimulation. The Schaffer and temporoammonic stimulus are paired so that a single Schaffer stimulus precedes the temporoammonic burst stimulus by 60 ms. The propagation of temporoammonic EPSPs are gated to stratum radiatum and stratum oriens (asterisk). Temporoammonic (TA) pathway (D) and Schaffer (SC) (E) stimulation in the presence of the GABAB antagonist CGP 55845A (2 μm). Note the appearance of a late depolarizing component. F, Schaffer-temporoammonic (SC&TA) pathway stimulation in the presence of GABAB antagonist CGP 55845A (2 μm). CGP 55845A significantly blocks the gating of temporoammonic EPSPs to stratum radiatum and stratum oriens (**p = 0.05; ANOVA; n = 4).
Figure 8.

Resegregation of afferent pathways integration by alvear-evoked feedback inhibition. A, Schaffer (SC) pathway stimulation. Top trace, Current clamp (I-clamp) dendritic shows the simultaneous whole-cell recording from the apical dendrite of a CA1 pyramidal cell in response to a single stimulus applied in the stratum radiatum. VSD SO, SR, and SLM are the local voltage-sensitive dye (VSD) signals quantified from regions of interest in stratum oriens (blue box), stratum radiatum (green box), and stratum lacunosum moleculare (black box), respectively (see grayscale image in inset). The activation profile image, generated from the raster scan of the path of interest (green line), shows the spatiotemporal response to the Schaffer collateral stimulus that returns to baseline and does not exhibit prolonged depolarization in stratum radiatum during the time window in which the TA pathway is activated. SC, Schaffer collateral stimulation; TA, temporoammonic stimulation; alveus, alveus stimulation. Sites of the patch electrode recording and stimulation are depicted by graphics above and below the raster scans, respectively. The voltage-sensitive dye signals were averaged over 12 trials. B, Temporoammonic (TA) pathway stimulation. Note that the voltage-sensitive dye response is spatially restricted to the apical tuft in stratum lacunosum moleculare, and the current-clamp dendritic recording of a CA1 pyramidal neuron apical dendrite in stratum radiatum shows an inhibitory response. C, Alveus stimulation evokes feedback inhibition. Note the inhibition evoked in both the dendritic patch recording and the voltage-sensitive dye signals obtained from regions of interest in stratum oriens (blue box) and stratum radiatum (green box) with a single alveus stimuli. (In the activation profile image, blue denotes hyperpolarization.) D, Schaffer-temporoammonic (SC&TA) pathway stimulation. The Schaffer and temporoammonic stimulus are paired so that a single Schaffer stimulus precedes the temporoammonic burst stimulus by 40 ms. The propagation of temporoammonic EPSPs are gated to stratum radiatum and stratum oriens (asterisk). E, Schaffer-alveus-temporoammonic (SC&alveus&TA) pathway stimulation. The Schaffer, alveus, and temporoammonic stimulus are paired so that a single Schaffer stimuli precedes the alveus stimulation by 30 ms, which precedes the temporoammonic burst stimulus by 10 ms. Unlike the expansion of activity in D, here the pathway interactions are resegregated by the alvear-evoked feedback inhibition (double asterisks; n = 9). F, Comparisons of the current-clamp whole-cell dendritic recordings in stratum radiatum for temporoammonic (TA, black), Schaffer-temporoammonic (SC&TA, red), and Schaffer-alveus-temporoammonic (SC&alveus&TA, blue) stimulation.
Figure 9.

Summary data of the Schaffer and temporoammonic pathway interactions and resegregation by alvear-evoked feedback inhibition. A, Summary data on the response in SO. The asterisk indicates significant temporoammonic (TA) throughput (*p ≤ 0.05, ANOVA; n = 9). B, Summary data on the response in SR. Single asterisk indicates significant temporoammonic (TA) throughput (*p ≤ 0.05, ANOVA; n = 9). C, Summary data on the response in SLM. There is no significant difference in stratum lacunosum moleculare responses between the temporoammonic and Schaffer-temporoammonic (SC&TA) stimulation protocols. D, Summary data on the response from Schaffer-temporoammonic stimulation in the presence of AP-5 (50 μm) (left), in the presence of CGP 55845A (2 μm) (center), and the response from Schaffer-alveus-temporoammonic (SC&Alv&TA) stimulation (right) in stratum oriens. There is no significant difference between the responses to Schaffer-temporoammonic (AP-5) and the arithmetic sum of the individual Schaffer (SC) and temporoammonic response (black), indicating that supralinear summation of Schaffer and temporoammonic inputs require activation of NDMA receptors (**p ≤ 0.05, ANOVA; n = 9). There is a significant difference between the responses to Schaffer-temporoammonic (CGP 55845A) and Schaffer-temporoammonic stimulation, indicating that presynaptic disinhibition significantly gates temporoammonic throughput to SO (***p ≤ 0.05, ANOVA; n = 9). There is a significant difference between the responses to Schaffer-temporoammonic and Schaffer-alveus-temporoammonic stimulation, indicating that feedback inhibition significantly suppresses temporoammonic throughput to SO (****p≤ 0.05, ANOVA; n = 9). E, Summary data on the response from Schaffer-temporoammonic stimulation in the presence of AP-5 (50 μm) (left), in the presence of CGP 55845A (2 μm) (center), and the response from Schaffer-alveus-temporoammonic stimulation (right) in stratum radiatum. There is no significant difference between the responses to Schaffer-temporoammonic (AP-5) and the arithmetic sum of the individual Schaffer and temporoammonic response (black) (**p ≤ 0.05, ANOVA; n = 9). There is a significant difference between the responses to Schaffer-temporoammonic (CGP 55845A) and Schaffer-temporoammonic stimulation, indicating that presynaptic disinhibition significantly gates temporoammonic throughput to SR (***p ≤ 0.05, ANOVA; n = 9). There is significant difference between the responses to Schaffer-temporoammonic and Schaffer-alveus-temporoammonic stimulation, indicating that feedback inhibition significantly suppresses temporoammonic throughput to SR (****p≤ 0.05, ANOVA; n = 9). F, Summary data on the response from Schaffer-temporoammonic stimulation in the presence of AP-5 (50 μm) (left), in the presence of CGP 55845A (2 μm) (center), and the response from Schaffer-alveus-temporoammonic stimulation (right) in stratum lacunosum moleculare. There is no significant difference between the responses to Schaffer-temporoammonic (AP-5) and the arithmetic sum of the individual Schaffer and temporoammonic response (black). There is no significant difference between the responses to Schaffer-temporoammonic (CGP 55845A) and Schaffer-temporoammonic stimulation. There is no significant difference between the responses to Schaffer-temporoammonic and Schaffer-alveus-temporoammonic stimulation.
Dendrites in CA1 stratum radiatum contain the highest density of NMDA receptors in the hippocampus, and the voltage sensitivity of these receptors could help boost temporoammonic inputs (Jones and Baughman, 1988; Mel, 1988). Although we do not rule out the possible role of presynaptic disinhibition of GABAergic interneurons at this point, we first assessed the role of NMDA receptors in circuit integration of afferent inputs by determining the effects of perfusion with the NMDA antagonist AP-5 (50 μm) during temporoammonic-Schaffer collateral integration experiments. AP-5 blocked temporoammonic throughput to stratum radiatum after Schaffer collateral stimulation (101.2 ± 15.7% of temporoammonic alone values; n = 4) (Fig. 5D, double asterisks), reducing the interaction between the Schaffer and temporoammonic pathways (SR, 0.009 ± 0.001% ΔF/F; SO, 0.0054 ± 0.005% ΔF/F; n = 4). The suppression of throughput may be attributable to a reduction in the temporoammonic EPSPs alone in the presence of the NMDA antagonist. To investigate this possibility, we assessed the effects of AP-5 on temporoammonic stimulation alone. We found that AP-5 did not significantly reduce the amplitude of the temporoammonic EPSPs in stratum lacunosum moleculare compared with control (control, 0.18 ± 0.015% ΔF/F; AP-5, 0.168 ± 0.015% ΔF/F; n = 3).
NMDA receptors specific to stratum radiatum mediate propagation of temporoammonic EPSPs
To more selectively examine the contribution of pathway-specific NMDA receptors to the gating of temporoammonic EPSPs, we selectively blocked the Schaffer-activated NMDA receptors by repetitively stimulating the Schaffer collaterals in the presence of the activity-dependent NMDA antagonist MK 801. After washout, with the Schaffer-specific NMDA receptors persistently blocked, repeating the temporoammonic-Schaffer collaterals integration experiment again showed that propagation of temporoammonic EPSPs to stratum radiatum and stratum oriens was suppressed (SR, 0.0088 ± 0.0074% ΔF/F; SO, -0.0013 ± 0.0032% ΔF/F; n = 3) (Fig. 6D, asterisk). This demonstrates that gating of temporoammonic EPSPs requires functional Schaffer-activated NMDA receptors. We hypothesize that, after the AMPA receptor-mediated EPSP, glutamate released by the preceding Schaffer stimulus may persist in stratum radiatum and in proximal sections of stratum lacunosum moleculare, bound to NMDA receptors. Such long occupancy of NMDA receptors by glutamate has been demonstrated previously (Lester and Jahr, 1992). Because of the voltage-dependent Mg2+ block of NMDA receptors, these ligand-bound receptors will not conduct effectively without membrane depolarization. Although we did not record directly from the dendrite in the distal sections of stratum radiatum bordering stratum lacunosum moleculare, our voltage-sensitive dye recordings show that dendritic compartments in these distal sections of stratum radiatum were substantially depolarized by temporoammonic inputs. Hence, temporoammonic activity may supply the requisite depolarization resulting in unblocking of NMDA receptors in these overlapping regions (Fig. 6E), leading to the NMDA-dependent increase in temporoammonic throughput to the pyramidal cell soma. It has been shown that stimulation of the Schaffer collaterals produces a large AMPA and a smaller and slower NMDA component (Davies and Collingridge, 1989). Blockage of the NMDA component with the NMDA antagonists AP-5 or MK 801 produces a faster EPSP, unveiling a larger IPSP (Fig. 6D).
To characterize temporoammonic throughput as a function of different intervals between the Schaffer collateral and temporoammonic stimulation, we varied the time between the Schaffer-temporoammonic stimulus within the theta cycle interval by up to 200 ms. We found that the greatest increase in temporoammonic throughput occurred when Schaffer stimulation leads temporoammonic pathway activation by 40-60 ms (Fig. 6F), although the throughput persists for delays up to 180 ms. To verify that ligand-bound NMDA channels were present during this time scale, we recorded the pharmacologically isolated Schaffer activated NMDA EPSC from the CA1 apical dendrite (n = 3) (Fig. 6F) and found that this EPSC showed a similar peak at ∼60 ms and a time course that closely matched the temporal profile of Schaffer and temporoammonic circuit interactions (Fig. 6F, red). These data support the hypothesis that NMDA receptors mediate propagation of temporoammonic EPSPs to the soma.
Hippocampal inhibitory synapses have frequently been shown to exhibit paired-pulse depression of evoked IPSCs (Pitler and Alger, 1994; Jensen et al., 1999). If the Schaffer collaterals and temporoammonic pathways activate an overlapping set of interneurons, then previous Schaffer activity would interact with subsequent temporoammonic stimulation and cause depression of inhibitory synapses originating from these cells, resulting in disinhibition of the CA1 circuitry and facilitating propagation of temporoammonic inputs to the soma. To test this hypothesis, we recorded the dendritic-evoked IPSCs in response to Schaffer collateral stimulation, temporoammonic stimulation, and the Schaffer-temporoammonic stimulation protocols (Schaffer, 720.5 ± 65.3 pA; temporoammonic, 402.3 ± 51.7 pA; Schaffer-temporoammonic, 519.8 ± 31.1 pA; n = 4; data not shown). Although the resultant IPSP (occurring during the time window when temporoammonic activity propagated to the soma) was in fact larger than the evoked IPSC attributable to temporoammonic stimulation alone, there was significant depression of the Schaffer-temporoammonic-evoked IPSC after the initial Schaffer stimulus. Because depression of inhibitory synapses may be attributable to activation of presynaptic GABAB autoreceptors, we assessed the potential role of GABAB inhibition on presynaptic GABAergic terminals by determining the effects of perfusion with GABAB antagonist on circuit integration.
Presynaptic GABAB inhibition mediates propagation of temporoammonic EPSPs
We found that the GABAB antagonist CGP 55845A (2 μm) blocked the propagation of temporoammonic EPSPs during the temporoammonic-Schaffer collateral integration experiments (SR, 0.014 ± 0.011% ΔF/F; SO, 0.015 ± 0.016% ΔF/F; n = 4) (Fig. 7F, double asterisks), reducing the circuit interaction between the Schaffer and temporoammonic pathways. This demonstrates that gating of temporoammonic EPSPs to the soma is mediated jointly by presynaptic disinhibition of GABAergic terminals within the CA1 local circuitry and activation of synaptic NMDA receptors.
Resegregation of afferent pathway integration by alvear-evoked feedback inhibition
The axons of subsets of stratum oriens/alveus (stratum lacunosum moleculare) interneurons innervate selected dendritic compartments of CA1 pyramidal cells and appear specialized to regulate specific afferent pathways (Freund and Buzsáki, 1996). To investigate how dendritically targeted inhibition may control the integration of afferent inputs, we used alvear stimulation to activate oriens/alveus interneurons and assessed the consequences of this manipulation on synergistic circuit interactions between the temporoammonic and Schaffer collateral pathways. Stimulating the alveus with a single stimulus may preferentially activate bistratified and basket cells that target the more proximal dendritic compartments of CA1 pyramidal cells (Pouille and Scanziani, 2004). As shown in Figure 8C, alvear stimulation produced strong dendritically targeted inhibition. Figure 8D (asterisk) shows the response to the Schaffer and temporoammonic stimulation protocol, resulting in significant temporoammonic throughput to stratum radiatum and stratum oriens. When an alvear stimulus was applied 30 ms after the Schaffer stimulus but 10 ms before the temporoammonic burst stimulus, the regenerative interaction between the temporoammonic and Schaffer pathways was abolished, and temporoammonic throughput to stratum radiatum and stratum oriens was blocked (SR, 0.0045 ± 0.0064% ΔF/F; SO, 0.013 ± 0.0056% ΔF/F; n = 9) (Fig. 8E, double asterisks).
To better understand the nature of the circuit integration of temporoammonic and Schaffer inputs, we compared the efficacy of temporoammonic throughput to stratum radiatum and stratum oriens when preceded by Schaffer stimulation to the activity of each pathway alone, in the presence of NMDA receptor blockade or a GABAB antagonist. We averaged the peak response of the local voltage-sensitive dye signal (ΔF/F) obtained from regions of interest in stratum radiatum and stratum oriens for an integration window corresponding to the peak of the temporoammonic response in control. This revealed a robust temporoammonic throughput when temporoammonic stimulation leads the theta-phase-shifted Schaffer activity, evident in both SR (525.1 ± 42.7% of temporoammonic alone values; ANOVA, p ≤ 0.05; n = 9) (Fig. 9B, asterisk) and SO (2384.1 ± 170.1% of temporoammonic alone values; ANOVA, p ≤ 0.05; n = 9) (Fig. 9A, asterisk). This demonstrates that the circuit integration of Schaffer activity with temporoammonic inputs allow the all-or-none propagation of temporoammonic EPSPs to the cell soma, supporting the concept that the CA1 circuit interaction confers on the cell a novel mechanism, which allows it to function as a temporally specific “AND” gate. This gating phenomenon can regulate CA1 output during the theta cycle. Using somatic recordings from CA1 pyramidal cells, under conditions of increased temporoammonic stimulation, we found that previous Schaffer input increased the efficacy of temporoammonic activity and resulted in the neurons firing action potentials (n = 3; data not shown).
To show that activation of NMDA receptors is necessary for the supralinear spatiotemporal summation of the Schaffer and temporoammonic inputs, we summed numerically the local voltage-sensitive dye responses to individual Schaffer and temporoammonic simulation and compared the result with the local voltage-sensitive dye response to the paired Schaffer and temporoammonic stimulation in the presence of AP-5. We found no significant difference between the responses to Schaffer-temporoammonic stimulation in AP-5 and the arithmetic sum of the individual Schaffer and temporoammonic responses in SR (Schaffer-temporoammonic in AP-5, 101.2 ± 15.7% of temporoammonic alone values; arithmetic sum of Schaffer and temporoammonic values, -56.8 ± 59.4% of temporoammonic alone values; n = 4). In the presence of CGP 55845A, gating of temporoammonic EPSPs to SR and SO was also significantly suppressed (28.8 ± 24% of Schaffer-temporoammonic values and 29 ± 30% of Schaffer-temporoammonic values; ANOVA, p ≤ 0.05; n = 4) (Fig. 9E,D, triple asterisks). This demonstrates that activation of NMDA receptors and presynaptic disinhibition of CA1 local circuitry were both critically and codependently involved in Schaffer gating of temporoammonic propagation. Alvear stimulation applied 20 ms before the temporoammonic burst but after Schaffer inputs significantly blocked temporoammonic throughput to SR and SO (12.9 ± 23.8% of Schaffer-temporoammonic values and 27.8 ± 19.2% of Schaffer-temporoammonic values; ANOVA, p ≤ 0.05; n = 9) (Fig. 9E,D, four asterisks). Although alvear stimulation reversed the interaction of temporoammonic EPSPs with Schaffer inputs, it did not appear to completely suppress the activity in stratum radiatum and stratum oriens; instead, it appeared to act in a linear manner to suppress propagation (Fig. 9E,D).
Discussion
Our results demonstrate that, under specific circumstances within a theta period, temporoammonic inputs targeting the distal apical tuft of CA1 pyramidal neurons can powerfully activate the cell soma. Under control conditions, feedforward GABAergic inhibition and intrinsic voltage-dependent conductances such as Ih are both necessary to maintain temporoammonic pathway segregation. Through a synergistic combination of an NMDA receptor-dependent mechanism and presynaptic disinhibition of GABAergic terminals within the CA1 local circuitry, an expansion of temporoammonic activity to stratum radiatum was generated when Schaffer collaterals were activated 40-200 ms before the temporoammonic pathway. These circuit interactions are further regulated by activity of feedback oriens/alveus interneurons that resegregate the temporoammonic inputs to the distal apical tuft of CA1 pyramidal cells.
The trisynaptic circuit from the entorhinal cortex through the dentate gyrus and CA3 to CA1 has long been assumed, often tacitly, to be the major route by which cortically processed information is channeled into the hippocampus. This contrasts with other studies, which have demonstrated that function of this trisynaptic circuit is not necessary for some kinds of spatial memory (Jarrard et al., 1984; Sybirska et al., 2000). Place fields of hippocampal place cells are not affected by moderate reduction of neuronal activity in CA3 (Mizumori et al., 1989), and lesions that disrupt the hippocampal trisynaptic circuit but maintain entorhinal cortical inputs to CA1 preserve the place selectivity of CA1 pyramidal cells as well as recognition memory (Brun et al., 2002). To consolidate long-term spatial memory, ongoing cortical input conveyed by the temporoammonic pathway is necessary (Remondes and Schuman, 2004). This is further emphasized by studies that demonstrate that the ensemble activity appeared earlier in CA1 than CA3 after exposure to a novel room, thus suggesting that new representations emerge via the direct projections from entorhinal cortex (Leutgeb et al., 2004).
In the intact rat, hippocampal theta activity in CA1 is characterized by a phase shift with depth from the pyramidal cell layer to the distal apical dendrite. The theta activity is thought to be generated by out-of-phase inputs from CA3 and entorhinal cortex. Current source density maps reveal that rhythmic excitation of the proximal dendrites in stratum radaitum is often followed by temporoammonic-associated excitation in the distal compartments of stratum lacunosum moleculare at approximately one-half theta intervals (Brankack et al., 1993; Kamondi et al., 1998). This alternate depolarization across dendritic compartments occurs during a time period that is coincident with the similarly constrained time window of 40-60 ms when Schaffer input leads temporoammonic activity to produce maximum temporoammonic throughput to the soma. The relative magnitude and phase relationship between the perforant path (temporoammonic) and CA3 inputs to CA1 pyramidal neurons may be responsible for the timing of action potentials of CA1 principal cells during the theta cycle (Kocsis et al., 1999). Our data suggests that the relative timing of the preceding Schaffer activation may increase the efficacy of temporoammonic inputs, allowing these synapses to influence CA1 pyramidal neuron firing during theta cycles.
We hypothesize that propagation of temporoammonic EPSPs to the soma is gated by the synergistic interaction of regenerative, NMDA receptor-dependent activity coincident with presynaptic GABAB-mediated disinhibition. In basal dendrites of neocortical neurons, the voltage-dependent properties of glutamate-bound NMDA receptors initiated local regenerative “NMDA spikes,” which lead to similar nonlinear integration of synaptic inputs, although consequences of this phenomenon on propagation of distal EPSPs was not examined. This phenomenon of regenerative NMDA spikes has been postulated as a mechanism to generate dynamic decision zones in cortical circuitry (Schiller et al., 2000). Indeed, activation of NMDA receptors has been shown to produce superlinear summation of excitatory inputs within the same dendritic branch of layer 5 pyramidal neurons in a similarly constrained temporal window to the one described in our studies (Polsky et al., 2004). Our studies demonstrate that presynaptic disinhibition together with activation of Schaffer-mediated NMDA receptors form a powerful circuit mechanism that confers on the CA1 cell the ability to function as a temporally specific “AND” gate. This novel mechanism may thus have functional implications in NMDA receptor 1-mediated spatial learning and place field specificity in the rodent hippocampal CA1 (McHugh et al., 1996). Concomitant with the lack of NMDA receptors, the observations of reduced specificity of CA1 place fields and navigational deficit allude to a broader failure of CA1 neurons to learn associations between entorhinal inputs and CA3 (Tsien et al., 1996).
Although the proposed mechanism may underlie the synergistic integration of temporoammonic inputs with other excitatory pathways, contributions from voltage-gated Na+ and Ca2+ conductances cannot be excluded (Gasparini et al., 2004). It is likely that these conductances are also activated in conjunction with pathway-specific differences in NMDA receptor voltage activation properties (Otmakhova et al., 2002) and may also influence temporoammonic input efficacy. In general, the number of likely targets that increase temporoammonic efficacy suggests that the present demonstration of sequence-dependent temporoammonic gating may only be one of a number of possible mechanisms that affect temporoammonic efficacy in vivo.
This output from CA1 pyramidal cells is subject to additional control mechanisms. Oriens/alveus interneurons, which project to the somata and proximal and distal apical dendrites of CA1 pyramidal cells, are innervated by local excitatory CA1 recurrent collaterals (Lacaille et al., 1987; Blasco-Ibáñez and Freund, 1995). Activation of oriens/alveus interneurons has been shown to suppress excitatory transmission to the apical dendrites of CA1 pyramidal neurons (Yanovsky et al., 1997), whereas modulation of these interneurons may regulate the strength of temporoammonic inputs to the distal apical tuft of CA1 principal cells (Maccaferri and McBain, 1995). Our stimulation paradigm of activating the alveus with a single stimulus may preferentially activate bistratified and basket cells. We found that oriens/alveus-mediated feedback inhibition had very little effect on the temporoammonic EPSPs in the apical tuft but blocked circuit interactions with Schaffer inputs, functionally segregating these excitatory inputs. One possible mechanism for this could be that the evoked oriens/alveus IPSPs inhibited the postsynaptic depolarization that was required for NMDA receptor activation in stratum radiatum. The IPSP efficacy may in turn be influenced by the site-dependent interactions of the IPSPs with voltage-activated ion channels present in the pyramidal cell dendrites (Williams and Stuart, 2003). By spatially segregating excitatory inputs and limiting their interactions, feedback inhibition in CA1 may function to preserve temporoammonic input specificity and regulate communication between the cell soma and dendrites, thereby determining how and when information is integrated and stored in hippocampal pyramidal neurons. Inhibition evoked by CA1 pyramidal cell output may permit CA1 pyramidal neurons to switch between two functional states. In the first case, Schaffer inputs from CA3 that are of sufficient magnitude to discharge CA1 pyramidal cells and thus evoke feedback inhibition, which would induce a state in which the CA1 principal cell acts as a “decoder,” mapping hippocampal representations derived from CA3 back to the cortex (Lisman, 1999), with oriens/alveus-mediated feedback inhibition protecting the information from interference. During exploration of novel behavior, whereas CA1 place cells display an increase in activity, CA1 interneurons in stratum oriens and pyramidale exhibit a decrease in discharge rates (Wilson and McNaughton, 1993; Nitz and McNaughton, 2004). When Schaffer inputs are permitted to integrate synergistically with sensory information from the temporoammonic pathway during theta cycles that occur with exploratory behavior, this would induce CA1 dynamics that favor match/mismatch computations for novelty detection (Vinogradova, 1984; Knight, 1996).
Footnotes
This work was supported by National Institutes of Health Grants R37 NS-32403 and R01 NS-41811 (D.A.C.) and by a National Science fellowship from the Agency for Science Technology and Research, Singapore (C.W.A.). We thank Drs. Brian Salzberg, Diego Contreras, Asaf Keller, John Huguenard, and Leif Finkel for critical review of this manuscript.
Correspondence should be addressed to Dr. Douglas A. Coulter, Abramson Pediatrics Research Center, Room 410, 3516 Civic Center Boulevard, Philadelphia, PA 19104-4318. E-mail: coulterd@email.chop.edu.
Copyright © 2005 Society for Neuroscience 0270-6474/05/259567-14$15.00/0
References
- Blanton MG, LoTurco JJ, Kriegstein AR (1989) Whole cell recording from neurons in slices of reptilian and mammalian cerebral cortex. J Neurosci Methods 30: 203-210. [DOI] [PubMed] [Google Scholar]
- Blasco-Ibáñez JM, Freund TF (1995) Synaptic input of horizontal interneurons in stratum oriens of the hippocampal CA1 subfield: structural basis of feed-back activation. Eur J Neurosci 7: 2170-2180. [DOI] [PubMed] [Google Scholar]
- Brankack J, Stewart M, Fox SE (1993) Current source density analysis of the hippocampal theta rhythm: associated sustained potentials and candidate synaptic generators. Brain Res 615: 310-327. [DOI] [PubMed] [Google Scholar]
- Brun VH, Otnæss MK, Molden S, Steffenach HA, Witter MP, Moser MB, Moser EI (2002) Place cells and place recognition maintained by direct entorhinal-hippocampal circuitry. Science 296: 2243-2246. [DOI] [PubMed] [Google Scholar]
- Buzsáki G (2002) Theta oscillations in the hippocampus. Neuron 33: 325-340. [DOI] [PubMed] [Google Scholar]
- Buzsáki G, Chrobak JJ (1995) Temporal structure in spatially organized neuronal ensembles: a role for interneuronal networks. Curr Opin Neurobiol 5: 504-510. [DOI] [PubMed] [Google Scholar]
- Buzsáki G, Czopf J, Kondakor I, Kellenyi L (1986) Laminar distribution of hippocampal rhythmic slow activity (RSA) in the behaving rat: current source density analysis, effects of urethane and atropine. Brain Res 365: 125-137. [DOI] [PubMed] [Google Scholar]
- Buzsáki G, Penttonen M, Bragin A, Nadasdy Z, Chrobak JJ (1995) Possible physiological role of the perforant path-CA1 projection. Hippocampus 5: 141-146. [DOI] [PubMed] [Google Scholar]
- Chrobak JJ, Buzsáki G (1998) Gamma oscillations in the entorhinal cortex of the freely behaving rat. J Neurosci 18: 388-398. [DOI] [PMC free article] [PubMed] [Google Scholar]
- Contreras D, Llinás R (2001) Voltage-sensitive dye imaging of neocortical spatiotemporal dynamics to afferent activation frequency. J Neurosci 21: 9403-9413. [DOI] [PMC free article] [PubMed] [Google Scholar]
- Csicsvari J, Hirase H, Czurkó A, Mamiya A, Buzsáki G (1999) Oscillatory coupling of hippocampal pyramidal cells and interneurons in the behaving rat. J Neurosci 19: 274-287. [DOI] [PMC free article] [PubMed] [Google Scholar]
- Davies SN, Collingridge GL (1989) Role of excitatory amino acid receptors in synaptic transmission in area CA1 of rat hippocampus. Proc R Soc Lond B Biol Sci 236: 373-384. [DOI] [PubMed] [Google Scholar]
- Djurisic M, Antic S, Chen WR, Zecevic D (2004) Voltage imaging from dendrites of mitral cells: EPSP attenuation and spike trigger zones. J Neurosci 24: 6703-6714. [DOI] [PMC free article] [PubMed] [Google Scholar]
- Empson RM, Heinemann U (1995) The perforant path projection to hippocampal area CA1 in the rat hippocampal-entorhinal cortex combined slice. J Physiol (Lond) 484: 707-720. [DOI] [PMC free article] [PubMed] [Google Scholar]
- Freund TF, Buzsáki G (1996) Interneurons of the hippocampus. Hippocampus 6: 345-470. [DOI] [PubMed] [Google Scholar]
- Gasparini S, Migliore M, Magee JC (2004) On the initiation and propagation of dendritic spikes in CA1 pyramidal neurons. J Neurosci 24: 11046-11056. [DOI] [PMC free article] [PubMed] [Google Scholar]
- Grinvald A, Lieke EE, Frostig RD, Hildesheim R (1994) Cortical point spread function and long-range lateral interactions revealed by real-time optical imaging of macaque monkey primary visual cortex. J Neurosci 14: 2545-2568. [DOI] [PMC free article] [PubMed] [Google Scholar]
- Hasselmo ME, Bodelón C, Wyble BP (2002) A proposed function for hippocampal theta rhythm: separate phases of encoding and retrieval enhance reversal of prior learning. Neural Comput 14: 793-817. [DOI] [PubMed] [Google Scholar]
- Huxter J, Burgess N, O'Keefe J (2003) Independent rate and temporal coding in hippocampal pyramidal cells. Nature 425: 828-832. [DOI] [PMC free article] [PubMed] [Google Scholar]
- Jarrard LE, Okaichi H, Steward O, Goldschmidt RB (1984) On the role of hippocampal connections in the performance of place and cue tasks: comparisons with damage to hippocampus. Behav Neurosci 98: 946-954. [DOI] [PubMed] [Google Scholar]
- Jensen O, Lisman JE (2000) Position reconstruction from an ensemble of hippocampal place cells: contribution of theta phase encoding. J Neurophysiol 83: 2602-2609. [DOI] [PubMed] [Google Scholar]
- Jensen K, Lambert JDC, Jensen MS (1999) Activity-dependent depression of GABAergic IPSCs in cultured hippocampal neurons. J Neurophysiol 82: 42-49. [DOI] [PubMed] [Google Scholar]
- Jones KA, Baughman R (1988) NMDA and non-NMDA receptor components of excitatory synaptic potentials recorded from cells in layer 5 of rat cortex. J Neurosci 8: 3522-3534. [DOI] [PMC free article] [PubMed] [Google Scholar]
- Kamondi A, Acsády L, Buzsáki G (1998) Theta oscillations in somata and dendrites of hippocampal pyramidal cells in vivo: activity dependent phase-precession of action potentials. Hippocampus 8: 244-261. [DOI] [PubMed] [Google Scholar]
- Kiss J, Buzsáki G, Morrow JS, Glantz SB, Leranth C (1996) Entorhinal cortical innervation of parvalbumin containing neurons (basket and chandelier cells) in the rat ammon's horn. Hippocampus 6: 239-246. [DOI] [PubMed] [Google Scholar]
- Knight R (1996) Contribution of human hippocampal region to novelty detection. Nature 383: 256-259. [DOI] [PubMed] [Google Scholar]
- Kocsis B, Bragin A, Buzsáki G (1999) Interdependence of multiple theta generators in the hippocampus: a partial coherence analysis. J Neurosci 19: 6200-6212. [DOI] [PMC free article] [PubMed] [Google Scholar]
- Lacaille JC, Mueller AL, Kunkel DD, Schwartzkroin PA (1987) Local circuit interactions between oriens/alveus interneurons and CA1 pyramidal cells in hippocampal slices: electrophysiology and morphology. J Neurosci 7: 1979-1993. [DOI] [PMC free article] [PubMed] [Google Scholar]
- Lester RA, Jahr CE (1992) NMDA channel behavior depends on agonist affinity. J Neurosci 12: 635-643. [DOI] [PMC free article] [PubMed] [Google Scholar]
- Leutgeb S, Leutgeb JK, Treves A, Moser MB, Moser EI (2004) Distinct ensemble codes in hippocampal areas CA3 and CA1. Science 305: 1295-1298. [DOI] [PubMed] [Google Scholar]
- Lisman JE (1999) Relating hippocampal circuitry to function: recall of memory sequences by reciprocal dentate-CA3 interactions. Neuron 22: 233-242. [DOI] [PubMed] [Google Scholar]
- Ma HT, Wu CH, Wu JY (2004) Initiation of spontaneous epileptic events in the rat neocortex in vivo. J Neurophysiol 91: 934-945. [DOI] [PMC free article] [PubMed] [Google Scholar]
- Maccaferri G, McBain CJ (1995) Passive propagation of LTD to the stratum oriens-alveus inhibitory neurons modulates the temporoammonic input to the hippocampal CA1 region. Neuron 15: 137-145. [DOI] [PubMed] [Google Scholar]
- Magee JC (2000) Dendritic integration of excitatory synaptic inputs. Nat Rev Neurosci 1: 181-190. [DOI] [PubMed] [Google Scholar]
- McHugh TJ, Blum KI, Tsien JZ, Tonegawa S, Wilson MA (1996) Impaired hippocampal representation of space in CA1-specific NMDAR1 knockout mice. Cell 87: 1339-1349. [DOI] [PubMed] [Google Scholar]
- Mel BW (1988) Synaptic integration in an excitable dendritic tree. J Neurophysiol 70: 1086-1101. [DOI] [PubMed] [Google Scholar]
- Mizumori SJ, McNaughton BL, Barnes CA, Fox KB (1989) Preserved spatial coding in hippocampal CA1 pyramidal cells during reversible suppression of CA3c output: evidence for pattern completion in hippocampus. J Neurosci 9: 3915-3928. [DOI] [PMC free article] [PubMed] [Google Scholar]
- Momose-Sato Y, Sato K, Sakai T, Hirota A, Matsutani K, Kamino K (1995) Evaluation of optimal voltage-sensitive dyes for optical monitoring of embryonic neural activity. J Membr Biol 144: 167-176. [DOI] [PubMed] [Google Scholar]
- Nitz D, McNaughton B (2004) Differential modulation of CA1 and dentate gyrus interneurons during exploration of novel environments. J Neurophysiol 91: 863-872. [DOI] [PubMed] [Google Scholar]
- Obaid AL, Loew LM, Wuskell JP, Salzberg BM (2004) Novel naphthylstyrylpyridinium potentiometric dyes offer advantages for neural network analysis. J Neurosci Methods 134: 179-190. [DOI] [PubMed] [Google Scholar]
- Otmakhova NA, Otmakhov N, Lisman JE (2002) Pathway-specific properties of AMPA and NMDA-mediated transmission in CA1 hippocampal pyramidal cells. J Neurosci 22: 1199-1207. [DOI] [PMC free article] [PubMed] [Google Scholar]
- Petersen CCH, Grinvald A, Sakmann B (2003) Spatiotemporal dynamics of sensory responses in layer 2/3 of rat barrel cortex measured in vivo by voltage-sensitive dye imaging combined with whole-cell voltage recordings and neuron reconstructions. J Neurosci 23: 1298-1309. [DOI] [PMC free article] [PubMed] [Google Scholar]
- Pitler TA, Alger BE (1994) Differences between presynaptic and postsynaptic GABAB mechanisms in rat hippocampal pyramidal cells. J Neurophysiol 72: 2317-2327. [DOI] [PubMed] [Google Scholar]
- Polsky A, Mel BW, Schiller J (2004) Computational subunits in thin dendrites of pyramidal cells. Nat Neurosci 7: 621-627. [DOI] [PubMed] [Google Scholar]
- Pouille F, Scanziani M (2004) Routing of spike series by dynamic circuits in the hippocampus. Nature 429: 717-723. [DOI] [PubMed] [Google Scholar]
- Rafiq A, DeLorenzo RJ, Coulter DA (1993) Generation and propagation of epilepticform discharges in a combined entorhinal cortex/hippocampal slice. J Neurophysiol 70: 1962-1974. [DOI] [PubMed] [Google Scholar]
- Remondes M, Schuman EM (2002) Direct cortical input modulates plasticity and spiking in CA1 pyramidal neurons. Nature 416: 736-740. [DOI] [PubMed] [Google Scholar]
- Remondes M, Schuman EM (2004) Role for a cortical input to hippocampal area CA1 in the consolidation of a long-term memory. Nature 431: 699-703. [DOI] [PubMed] [Google Scholar]
- Roxin A, Kath WL, Spruston N (2003) Propagation of distally generated dendritic spikes toward the soma is facilitated by Schaffer collateral inputs in CA1 pyramidal neurons of hippocampus: a simulation study. Soc Neurosci Abstr 43: 476.17. [Google Scholar]
- Salzberg BM (1983) Optical recording of electrical activity in neurons using molecular probes. In: Current methods in cellular neurobiology (Barker J, McKelvy J, eds), pp 139-185. New York: Wiley.
- Salzberg BM, Davila HV, Cohen LB (1973) Optical recording of impulses in individual neurons of an invertebrate central nervous system. Nature 246: 508-509. [DOI] [PubMed] [Google Scholar]
- Salzberg BM, Obaid AL, Senseman DM, Gainer H (1983) Optical recording of action potentials from vertebrate nerve terminals using potentiometric probes provides evidence for sodium and calcium components. Nature 306: 36-40. [DOI] [PubMed] [Google Scholar]
- Schiller J, Major G, Koester HJ, Schiller Y (2000) NMDA spikes in basal dendrites of cortical pyramidal neurons. Nature 404: 285-289. [DOI] [PubMed] [Google Scholar]
- Shah MM, Anderson AE, Leung V, Lin X, Johnston D (2004) Seizure-induced plasticity of h channels in entorhinal cortical layer III pyramidal neurons. Neuron 44: 495-508. [DOI] [PMC free article] [PubMed] [Google Scholar]
- Skaggs WE, McNaughton BL, Wilson MA, Barnes CA (1996) Theta precession in hippocampal neuronal populations and the compression of temporal sequences. Hippocampus 6: 149-173. [DOI] [PubMed] [Google Scholar]
- Soltesz I (1995) Brief history of cortico-hippocampal time with a special reference to the direct entorhinal input to CA1. Hippocampus 5: 120-124. [DOI] [PubMed] [Google Scholar]
- Steward O, Scoville SA (1976) Cells of origin of entorhinal cortical afferents to the hippocampus and fascia dentate of the rat. J Comp Neurol 169: 347-370. [DOI] [PubMed] [Google Scholar]
- Sybirska E, Davachi L, Goldman-Rakic P (2000) Prominence of direct entorhinal-CA1 pathway activation in sensorimotor and cognitive tasks revealed by 2-DG functional mapping in nonhuman primate. J Neurosci 20: 5827-5834. [DOI] [PMC free article] [PubMed] [Google Scholar]
- Tsien JZ, Huerta PT, Tonegawa S (1996) The essential role of hippocampal CA1 NMDA receptor-dependent synaptic plasticity in spatial learning. Cell 87: 1327-1338. [DOI] [PubMed] [Google Scholar]
- Vanderwolf CH (1969) Hippocampal electrical activity and voluntary movement in the rat. Electroencephalogr Clin Neurophysiol 26: 407-418. [DOI] [PubMed] [Google Scholar]
- Vinogradova OS (1984) Current concepts of general properties and plastic phenomena in hippocampal neurons. Usp Fiziol Nauk 15: 28-54. [PubMed] [Google Scholar]
- Williams SR, Stuart GJ (2003) Voltage- and site-dependent control of the somatic impact of dendritic IPSPs. J Neurosci 23: 7358-7367. [DOI] [PMC free article] [PubMed] [Google Scholar]
- Wilson MA, McNaughton BL (1993) Dynamics of the hippocampal ensemble code for space. Science 267: 1055-1058. [DOI] [PubMed] [Google Scholar]
- Winson J (1974) Patterns of hippocampal theta rhythm in freely moving rat. Electroencephalogr Clin Neurophysiol 36: 291-301. [DOI] [PubMed] [Google Scholar]
- Witter MP, Griffioen AW, Jorritsma-Byham B, Krijnen JLM (1988) Entorhinal projections to the hippocampal CA1 region in the rat: an underestimated pathway. Neurosci Lett 85: 193-198. [DOI] [PubMed] [Google Scholar]
- Witter MP, Groenewegen HJ, Silva FHLD, Lothman AH (1989) Functional organization of the extrinsic and intrinsic circuitry of the parahippocampal region. Prog Neurobiol 33: 161-253. [DOI] [PubMed] [Google Scholar]
- Yanovsky Y, Sergeeva OA, Freund TF, Hass HL (1997) Activation of interneurons at the stratum oriens/alveus border suppresses excitatory transmission to apical dendrites in the CA1 area of the mouse hippocampus. Neuroscience 77: 87-96. [DOI] [PubMed] [Google Scholar]