Abstract
Rice (Oryza sativa) is a highly silicon (Si)-accumulating species that shows genotypic differences in Si accumulation. We investigated the physiological and molecular mechanisms involved in the genotypic difference in Si uptake between the japonica var. Nipponbare and the indica var. Kasalath. Both the Si concentration in the shoot and the Si uptake per root dry weight were higher in Nipponbare than in Kasalath grown in either soil or nutrient solution. The Si uptake by a single root was also higher in Nipponbare than in Kasalath. A kinetics study showed that Nipponbare and Kasalath had a similar Km value, whereas the Vmax was higher in Nipponbare. The expression of two Si transporter genes (Low silicon rice 1 [Lsi1] and Lsi2) investigated using real-time reverse transcription polymerase chain reaction revealed higher expression of both genes in Nipponbare than in Kasalath. Immunostaining with Lsi1 and Lsi2 antibodies revealed a similar pattern of subcellular localization of these two Si transporters in both varieties; Lsi1 and Lsi2 were localized at the distal and proximal sides, respectively, of both exodermis and endodermis of the roots. These results revealed that the genotypic difference in the Si accumulation results from the difference in abundance of Si transporters in rice roots.
Silicon (Si) is a beneficial element for plant growth (Marschner, 1995). The beneficial effects of Si are characterized by helping plants to overcome various stresses including biotic and abiotic stresses (Epstein, 1999; Richmond and Sussman, 2003; Ma, 2004; Ma and Yamaji, 2006). For example, Si increases the resistance of plants to fungi, pests, lodging, and drought stresses. Si also alleviates mineral stresses such as manganese toxicity, aluminum toxicity, and phosphorus deficiency (Ma and Takahashi, 1990; Ma et al., 1997; Iwasaki et al., 2002). These beneficial effects of Si to plants are attributed to both Si deposited on various tissues and soluble Si. High deposition of Si in tissues forms a physical barrier that enhances the strength and rigidity of the tissues (Yoshida et al., 1962; Ma and Yamaji, 2006). Soluble Si plays an active role in enhancing host resistance to plant diseases by stimulating some defense reaction mechanism(s) (Fauteux et al., 2005).
Although all plants contain Si in their bodies, the Si concentration in the shoot greatly varies with the species, ranging from 0.1% to 10.0% in dry weight (Epstein, 1994; Ma and Takahashi, 2002; Hodson et al., 2005). Based on the Si concentration in the shoot and the Si to calcium ratio, plants are classified into Si accumulator, intermediate type, and Si excluder species (for review, see Takahashi et al., 1990). Species containing more than 1.0% Si are called Si accumulators, while those having less than 0.5% Si are called Si excluders. Plant species with a Si content between 0.5% and 1.0% are called intermediate type. In higher plants, only a few crop species of Gramineae and Cyperacea are Si accumulators and rice (Oryza sativa) shows the highest Si accumulation in Gramineae (Ma and Takahashi, 2002; Hodson et al., 2005). The difference in Si accumulation of different plant species has been ascribed to the ability of the roots to take up Si although the molecular mechanisms remain unknown (Mitani and Ma, 2005).
There is also a genotypic variation in the Si concentration in the shoot within a species, although the variation is usually not as large as the species variation. For example, in a survey of about 400 cultivars of barley (Hordeum vulgare), the Si concentration in barley grain showed a large variation, ranging from 1.24 to 3.80 mg g−1 in covered barley (Ma et al., 2003). In sugarcane (Saccharum officinarum) grown in the field, the Si concentration in the shoot varied with the variety, ranging from 6.4 to 10.2 mg g−1 (Deren, 2001). In rice, japonica rice varieties usually have a higher Si concentration than indica rice varieties (Deren et al., 1992; Winslow, 1992; Winslow et al., 1997). Yuan and Cheng (1977) grew indica and japonica rice varieties in nutrient solution containing 100 mg L−1 SiO2 and found that the Si concentration in the shoots ranged from 117 mg g−1 to 171 mg g−1. In a field experiment, 18 rice genotypes varied significantly in Si concentration, ranging from 41 to 60 mg g−1 (Deren, 2001). A genetic study showed that genotypic variation in Si concentration in the shoot was largely additive and some heterosis was observed (Majumder et al., 1985). Recently, two studies revealed various quantitative trait loci for Si concentration and uptake in rice (Dai et al., 2005; Wu et al., 2006). However, the mechanisms responsible for the genotypic difference in Si uptake are poorly understood. Recently, two genes (Low silicon rice 1 [Lsi1] and Lsi2) encoding Si transporters have been identified in japonica rice varieties using rice mutants defective in Si uptake (Ma et al., 2002, 2004, 2006, 2007). However, the responsible genes in the indica rice varieties have not been characterized. In this study, we compared the Si uptake and the expression of these two Si transporter genes in the japonica var. Nipponbare and the indica var. Kasalath. We also examined the localization of two Si transporters in the two varieties and found that the genotypic difference in the Si uptake results from different abundance of Si transporters in rice roots.
RESULTS
Genotypic Difference in Si Uptake
The Si concentration in rice roots and shoots and Si uptake were examined in the japonica var. Nipponbare and the indica var. Kasalath grown in both soil and solution culture for a relatively long term. When grown in soil, the Si concentration in the shoot was 17% higher in Nipponbare than in Kasalath (Table I). The Si uptake per root dry weight (uptake ability) was also about 22% higher in Nipponbare than in Kasalath. In solution-cultured rice, the Si concentration in the shoot was 25% higher in Nipponbare than in Kasalath (Table I). The Si uptake was 35% higher in Nipponbare than in Kasalath. The Si concentration in the roots was much lower than that in shoots and there was no marked difference in the root Si concentration between two varieties. More than 99% of total Si was localized in the shoot of both varieties.
Table I.
Si concentration in the root and shoot and Si uptake of two rice varieties
Nipponbare and Kasalath were cultivated in soil or nutrient solution containing 0.15 mm Si for 1 month. Data are means ± sd (n = 3). n.d., Not determined.
| Variety | Si Concentration
|
Si Uptake | |
|---|---|---|---|
| Shoot | Root | ||
| mg g−1 | mg g−1 root dry weight | ||
| Soil culture | |||
| Nipponbare | 30.3 ± 1.4 | n.d. | 64.9 ± 5.0 |
| Kasalath | 25.1 ± 1.2 | n.d. | 50.9 ± 5.6 |
| Solution culture | |||
| Nipponbare | 17.2 ± 1.0 | 1.5 ± 0.8 | 76.8 ± 7.6 |
| Kasalath | 13.0 ± 0.6 | 2.0 ± 1.8 | 49.8 ± 2.1 |
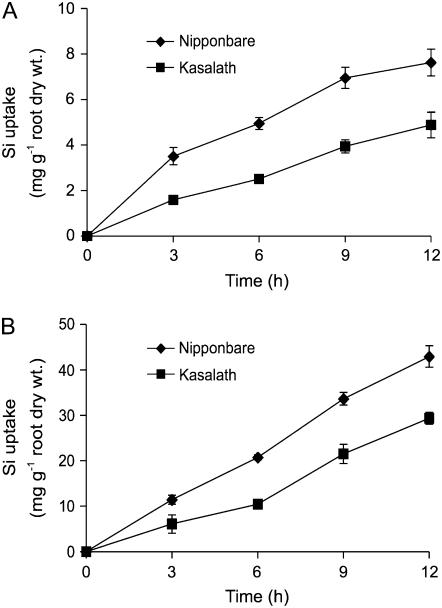
To further compare the genotypic difference in Si uptake ability, we examined the short-term uptake by using the whole root system. The Si uptake in Nipponbare was 1.5- to 2.0-fold than that in Kasalath at either low (0.15 mm) and high (1.5 mm) Si uptake solution (Fig. 1, A and B). The difference in the Si uptake between the two varieties was observed as early as 3 h after the roots were exposed to the nutrient solution containing Si.
Figure 1.
Uptake of Si by japonica rice variety Nipponbare and indica rice variety Kasalath. Twenty-day-old seedlings were placed in a nutrient solution containing 0.15 (A) and 1.5 mm (B) Si as silicic acid. Error bars represent ±sd (n = 3).
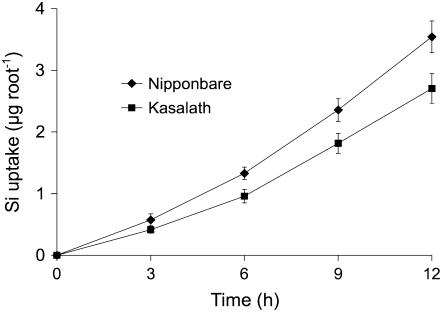
The Si uptake by individual roots was also examined using a multicompartment transport box. The Si taken up per excised root apex (0–3 cm) was 30% to 40% higher in Nipponbare than in Kasalath at each sampling time (Fig. 2).
Figure 2.
Uptake of Si by individual, excised roots. Ten excised roots (5.5 cm long) from japonica rice variety Nipponbare and indica rice variety Kasalath were placed in a multicompartment transport box. Twelve milliliters of treatment solution containing 0.75 mm Si as silicic acid was applied to compartment 1 (root apex, 0–3 cm) and 4 mL of treatment solution without Si was added to compartments 2 and 3. At times indicated in the figure, the Si exuded from the xylem in compartment 3 was measured. Error bars represent ±sd (n = 3).
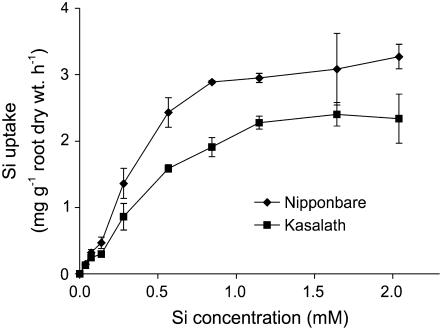
A kinetic study showed that in both varieties the Si uptake was increased with increasing external Si concentration when the Si concentration in the nutrient solution was low (Fig. 3). However, the Si uptake was saturated at higher Si concentrations. Based on these curves, the Vmax value was estimated to be 3.0 and 2.1 mg Si g−1 root dry weight for Nipponbare and Kasalath, respectively (Table II). The Km value was estimated to be 0.33 and 0.34 mm, respectively, for Nipponbare and Kasalath.
Figure 3.
Si uptake by rice roots from a solution with various Si concentrations. The seedlings were cultured for 12 h. Error bars represent ±sd (n = 3).
Table II.
Vmax and Km values for Si uptake by Nipponbare and Kasalath
Values are means of three replicates and estimated from uptake kinetics curves in Figure 3.
| Variety | Vmax | Km |
|---|---|---|
| mg Si g−1 root dry weight h−1 | mm | |
| Nipponbare | 3.0 | 0.33 |
| Kasalath | 2.1 | 0.34 |
Expression of Si Transporter Genes and Localization of Si Transporters
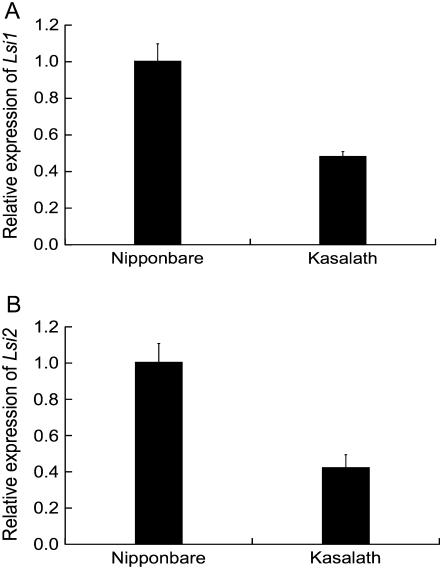
The expression of two Si transporter genes (Lsi1 and Lsi2) in the roots was investigated using quantitative reverse transcription (RT)-PCR. The sequence of both Lsi1 and Lsi2 cDNA was the same in Nipponbare and Kasalath (data not shown). The expression level of both Lsi1 and Lsi2 was lower in Kasalath than in Nipponbare (Fig. 4, A and B).
Figure 4.
Expression level of Si transporter genes in the roots of Nipponbare and Kasalath. The transcript levels of Lsi1 (A) and Lsi2 (B) were determined by quantitative RT-PCR. Error bars represent ±sd (n = 3).
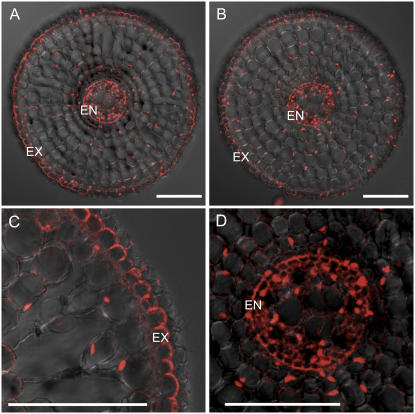
The localization of Lsi1 was examined using immunostaining in the roots grown under the same conditions. Similar to the localization of Lsi1 in Nipponbare (Fig. 5A), Lsi1 in Kasalath was also localized in the exodermis and endodermis (Fig. 5B). Furthermore, Lsi1 in Kasalath was also localized on the distal side of both exodermis and endodermis (Fig. 5, C and D).
Figure 5.
Localization of Si influx transporter Lsi1 in different rice varieties. The roots were stained with anti-Lsi1 polyclonal antibody. A, Nipponbare. B to D, Kasalath. A and B, 20 mm. C and D, 40 mm from the root apex. EX, Exodermis; ED, endodermis. Bar = 100 μm.
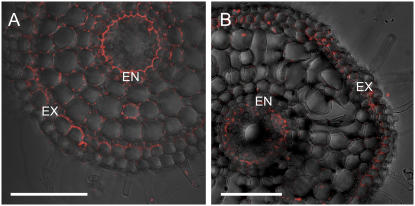
The localization of Lsi2 was also investigated in both varieties. Immunostaining with antibody of Lsi2 showed that Lsi2 was also localized at the exodermis and endodermis in both varieties (Fig. 6, A and B). In contrast to Lsi1, Lsi2 was localized in the proximal side of both exodermis and endodermis.
Figure 6.
Cellular localization of Si efflux transporter Lsi2 in different rice varieties. The roots were stained with anti-Lsi2 polyclonal antibody. A, Nipponbare. B, Kasalath. A and B, 20 mm from root apex. EX, Exodermis; ED, endodermis. Bar = 100 μm.
DISCUSSION
Both soil and nutrient culture showed that there is a genotypic difference in Si concentration in the rice shoot between japonica rice var. Nipponbare and indica rice var. Kasalath (Table I). This result is consistent with previous findings that indica rice appears to have a lower Si concentration than japonica (Deren, 2001; Wu et al., 2006), although different varieties were used in their studies. The shoot mineral concentration might be regulated by many factors such as uptake ability, root and shoot biomass, translocation ability from the root to the shoot, transpiration rate, and so on. The Si concentration in the roots was similar between Nipponbare and Kasalath and was much less than that in the shoot Si (Table I). The amount of Si in the root was only 1% of total Si in the plants in either variety, indicating that most of the Si taken up by the roots is translocated to the shoot and that there is no difference in the translocation ability between the two varieties. The transpiration rate was measured in both relatively long-term and short-term uptake experiments, but there were no differences between Nipponbare and Kasalath (data not shown). However, the uptake ability of Si was significantly higher in Nipponbare than Kasalath either based on the whole root system or individual roots (Figs. 1 and 2). These results indicate that the Si concentration in the shoot in rice is mainly determined by the ability of the roots to take up Si.
To examine the mechanism involved in genotypic difference in Si uptake, we first compared the kinetics of Si uptake in two varieties. Both varieties showed a similar Km value (Fig. 3; Table II), suggesting that similar transporters involved in the Si uptake are present in the roots of both varieties. However, the Vmax value was higher in Nipponbare than in Kasalath (Fig. 3; Table II), indicating that the transporters are more abundant in Nipponbare. Rice roots take up Si in the form of silicic acid, an uncharged molecule (Takahashi and Hino, 1978). So far, two transporters (Lsi1 and Lsi2) for silicic acid have been recently identified in japonica rice varieties (Ma et al., 2006, 2007). Lsi1 is an influx transporter responsible for Si transport from the external solution to the root cells (Ma et al., 2006). This transporter belongs to a Nod26-LIKE MAJOR INTRINSIC PROTEIN2 (NIP2) subgroup in the NIP subfamily of aquaporins (Ma et al., 2006). Lsi1 is mainly expressed in the roots and the expression is decreased by one-fourth by Si supply. Moreover, in the roots, Lsi1 is expressed more intensively in the mature regions than in the root tips (Yamaji and Ma, 2007). On the other hand, Lsi2 is an efflux transporter involved in Si transport from the root cells to the apoplast (Ma et al., 2007). Lsi2 is a putative anion transporter. Lsi2 was also constitutively expressed in the roots and the expression was decreased by Si supply as Lsi1. These two transporters play a crucial role in Si uptake because disruption of either of them resulted in a significant decrease of Si uptake in japonica rice varieties (Ma et al., 2006, 2007). We then compared the sequence and gene expression of the two Si transporters (Lsi1 and Lsi2) between Nipponbare and Kasalath. Sequence analysis showed that the open reading frame of these two genes was the same in Nipponbare and Kasalath (data not shown). However, the expression levels of Lsi1 and Lsi2 were higher in Nipponbare than in Kasalath (Fig. 4). This is consistent with the result of the kinetic study (Fig. 3; Table II), indicating that more Si transporters are expressed in the Nipponbare than in Kasalath. The expression level of genes may be controlled by a number of factors such as promoter sequence and transcription factor. The mechanism responsible for the difference in expression of Lsi1 and Lsi2 remains to be identified.
The cellular localization of Lsi1 and Lsi2 is characterized by polar localization; Lsi1 and Lsi2 are localized at the distal and proximal side, respectively, of both exodermis and endodermis of japonica rice variety roots (Ma et al., 2006, 2007). In Kasalath and Nipponbare grown under the same condition, the localization of both Lsi1 and Lsi2 in Kasalath roots was similar to that in Nipponbare (Figs. 5 and 6), indicating that different uptake capacity is not due to the localization of Si transporters. There are also two Casparian bands at the exodermis and endodermis in Kasalath like Nipponbare, which prevent the solutes across the cortex to the stele. Therefore, Lsi1 and Lsi2 are required to transport Si from the external solution to the stele in both Kasalath and Nipponbare.
Root biomass is also a very important factor determining mineral uptake. Kasalath had a larger root biomass than Nipponbare (data not shown), which helps to acquire more Si. That is why the difference in the shoot Si content between Nipponbare and Kasalath was smaller than the difference in the Si uptake per root dry weight (Table I) and the difference in the expression of Lsi1 and Lsi2 (Fig. 4). However, since the difference in uptake ability of Si per individual root is larger than the difference in the root biomass (Fig. 2), Nipponbare showed a higher accumulation of Si in the shoot (Table I).
In conclusion, the genotypic difference in the Si accumulation results from a difference in the ability of the roots to take up Si between the japonica rice variety and indica variety, which results from the difference in the expression level of Si transporter genes. The evolutionary reasons why the japonica rice ecotype has a higher Si uptake ability than indica ecotype are unknown. It is hypothesized that japonica evolved in Si-deficient uplands and developed a mechanism to attain more Si, whereas indica evolved in lowlands where Si was more available (Deren, 2001).
MATERIALS AND METHODS
Plant Materials and Growth Conditions
The japonica var. Nipponbare and the indica var. Kasalath were used in this study. Seeds were soaked in water overnight at 25°C in the dark. The seeds were then transferred to a net floated on 0.5 mm CaCl2 solution in a plastic container. On day 5, the seedlings were transferred to a 3-L plastic pot containing one-half-strength Kimura B solution (pH 5.6). The composition of the nutrient solution is as reported previously (Ma et al., 2001). The solution was renewed every 2 d. All experiments were conducted with three replicates in a glasshouse at 25°C with natural light.
Soil and Solution Culture
Soil culture was performed for Nipponbare and Kasalath under flooded condition. The soil used was as previously described (Ma et al., 2001). Two seedlings each (5 d old) were planted in a 3-L pot filled with soil previously amended with coating fertilizer (14-12-14 for nitrogen-phosphorus-potassium) at a rate of 1 g kg−1 soil. Tap water was supplied daily. One month later, the shoots were harvested.
For solution culture, 2-week-old seedlings of each variety were transplanted to a 1.2-L plastic pot (two seedlings per pot) containing one-half-strength Kimura B solution (pH 5.6) with 0.15 mm Si as silicic acid. Silicic acid was prepared by passing potassium silicate through a cation-exchange resin (Amberlite IR-120B, H+ form). The solution was renewed every 2 d. After 1 month, the plants were harvested.
Short-Term Si Uptake Experiment
Si uptake by Nipponbare and Kasalath was examined during short-term (up to 12 h) experiments. Two seedlings each (20 d old) were placed in a 50-mL black bottle containing one-half-strength Kimura B solution (pH 5.6) with 0.15 mm and 1.5 mm Si as silicic acid. At various time points, a 1-mL aliquot of uptake solution was taken for determination of Si concentration. The Si concentration in the solution was determined by the colorimetric molybdenum blue method at 600 nm. Transpiration (water loss) was also recorded at each sampling time. At the conclusion of the experiment, the roots and shoots were harvested separately and their fresh and dry weights were recorded.
Multicompartment Transport Box Experiment
To compare the Si uptake by individual roots of Nipponbare and Kasalath, we used a multicompartment transport box (Kawasaki et al., 1984; Ma et al., 2001). Ten excised roots (5.5 cm long) from 7-d-old seedlings were placed in the box. The box was divided into three compartments. Root apices (0–3 cm) in the first compartment were exposed to one-half-strength Kimura B solution (12 mL) with 0.75 mm Si, while the root portions in the second and third compartments were exposed to the same nutrient solution (4 mL for each) without Si. The solution in the third compartment was replaced with fresh solution at various time points and the Si concentration in this compartment (containing the cut end) as well as the other compartments, was determined.
Kinetics of Si Uptake
Seedlings (2 weeks old) of Nipponbare and Kasalath were allowed to take up Si in the nutrient solution (one-half Kimura B, pH 5.6) containing silicic acid at various concentrations in a 50-mL plastic bottle as described above. The uptake period was 12 h. The amount of Si uptake was measured as described above.
Digestion and Determination of Plant Si Concentration
Plant samples harvested were dried at 70°C in an oven for at least 2 d and then ground to a powder. The sample was then microwave digested in a mixture of 3 mL of HNO3 (62%), 3 mL of hydrogen peroxide (30%), and 2 mL of hydrofluoric acid (46%) and the digested sample was diluted to 100 mL with 4% boric acid. The Si concentration in the digest solution was determined by the colorimetric molybdenum blue method at 600 nm.
Quantitative RT-PCR
Transcript level of Lsi1 and Lsi2 was measured by quantitative RT-PCR as described previously (Yamaji and Ma, 2007). Total RNA was extracted from the roots of 5-week-old seedlings using an RNeasy Plant Extraction minikit (Qiagen) according to the manufacturer's instructions. First-strand cDNA was synthesized from 1 μg of total RNA using oligo dT(18) primer and SuperScript First-Strand Synthesis system for RT-PCR (Invitrogen). Relative transcript levels of Lsi1, Lsi2, and Actin (internal control) were measured as described previously (Ma et al., 2006, 2007). Quantitative real-time PCR was performed in 20 μL reaction volume containing 2 μL of 1:5 diluted cDNA, 200 nm each gene-specific primers, and SYBR Premix Ex Taq (Takara Bio) using Applied Biosystems 7500. Primer sequences used are: Lsi1, 5′-CGGTGGATGTGATCGGAACCA-3′ (forward) and 5′-CGTCGAACTTGTTGCTCGCCA-3′ (reverse); Lsi2, 5′-ATCTGGGACTTCATGGCCC-3′ (forward) and 5′-ACGTTTGATGCGAGGTTGG-3′ (reverse); Actin, 5′-GACTCTGGTGATGGTGTCAGC-3′ (forward) and 5′-GGCTGGAAGAGGACCTCAGG-3′ (reverse).
Immunohistological Staining
Lsi1 and Lsi2 immunostaining was performed according to the method previously described (Yamaji and Ma, 2007). The synthetic peptide C-ADDVDEMEN (positions 287–295 of Lsi1) and C-GAELSVDGK (positions 211–219 of of Lsi2) were used to immunize rabbits to obtain antibodies against Lsi1 and Lsi2, respectively. Rice (Oryza sativa) roots were fixed in 4% (w/v) paraformaldehyde and 60 mm Suc buffered with 50 mm cacodylic acid (pH 7.4) for 2 h at room temperature with occasional degassing. After three washes with 60 mm Suc and 50 mm cacodylic acid (pH 7.4), the fixed samples were embedded in 5% agar and sectioned 80-μm thick with a microslicer (ZERO 1; Dosaka EM). The sections were placed on microscope slides, incubated with phosphate-buffered saline (PBS; 10 mm PBS, pH 7.4, 138 mm NaCl, 2.7 mm KCl) containing 0.1% (w/v) pectolyase Y-23 (Seishin) at 30°C for 2 h, and then reincubated in PBS containing 0.3% (v/v) Triton X-100 at 30°C for 2 h, washed three times with PBS and blocked with 5% (w/v) bovine serum albumin in PBS. The slides were incubated in a 37°C chamber with the purified rabbit anti-Lsi1 or anti-Lsi2 polyclonal antibodies (1:100 dilution in PBS). After three washes in PBS and blocking with 5% (w/v) BSA in PBS, the slides were exposed to secondary antibodies (Alexa Fluor 555 goat anti-rabbit IgG; Molecular Probes) for 2 h at room temperature, washed five times in PBS, and mounted with 50% (v/v) glycerol in PBS. Samples were examined with a laser-scanning confocal microscope (LSM510; Carl Zeiss).
Sequence data from this article can be found in the GenBank/EMBL data libraries under accession numbers AB222272 (Lsi1) and AB222273 (Lsi2).
This work was supported by a Grant-in-Aid for Scientific Research on Priority Areas from the Ministry of Education, Culture, Sports, Science and Technology of Japan (grant nos. 15380053 and 17078008 to J.F.M.) and a grant from the Ministry of Agriculture, Forestry and Fisheries of Japan (Rice Genome Project IP–5003 to J.F.M.).
The author responsible for distribution of materials integral to the findings presented in this article in accordance with the policy described in the Instructions for Authors (www.plantphysiol.org) is: Jian Feng Ma (maj@rib.okayama-u.ac.jp).
References
- Dai WM, Zhang KQ, Duan BW, Zheng KL, Zhuang JY, Cai R (2005) Genetic dissection of silicon content in different organs of rice. Crop Sci 45 1345–1352 [Google Scholar]
- Deren CW (2001) Plant genotype, silicon concentration, and silicon-related responses. In LE Datnoff, GH Snyder, GH Korndorfer, eds, Silicon in Agriculture. Elsevier Science, Amsterdam, pp 149–158
- Deren CW, Datnoff LE, Snyder GN (1992) Variable silicon content of rice cultivars grown on Everglades histosols. J Plant Nutr 15 2363–2368 [Google Scholar]
- Epstein E (1994) The anomaly of silicon in plant biology. Proc Natl Acad Sci USA 91 11–17 [DOI] [PMC free article] [PubMed] [Google Scholar]
- Epstein E (1999) Silicon. Annu Rev Plant Physiol Plant Mol Biol 50 641–664 [DOI] [PubMed] [Google Scholar]
- Fauteux F, Remus-Borel W, Menzies JG, Belanger RR (2005) Silicon and plant disease resistance against pathogenic fungi. FEMS Microbiol Lett 249 1–6 [DOI] [PubMed] [Google Scholar]
- Hodson MJ, White PJ, Mead A, Broadley MR (2005) Phylogenetic variation in the silicon composition of plants. Ann Bot (Lond) 96 1027–1046 [DOI] [PMC free article] [PubMed] [Google Scholar]
- Iwasaki K, Maier P, Fecht M, Horst WJ (2002) Leaf apoplastic silicon enhances manganese tolerance of cowpea (Vigna unguiculata). J Plant Physiol 159 167–173 [Google Scholar]
- Kawasaki T, Moritsugu M, Shimizu G (1984) The absorption and translocation of ions in excised barley roots: a multi-compartment transport box experiment. Soil Sci Plant Nutr 30 417–425 [Google Scholar]
- Ma JF (2004) Role of silicon in enhancing the resistance of plants to biotic and abiotic stresses. Soil Sci Plant Nutr 50 11–18 [Google Scholar]
- Ma JF, Goto S, Tamai K, Ichii M (2001) Role of root hairs and lateral roots in silicon uptake by rice. Plant Physiol 127 1773–1780 [PMC free article] [PubMed] [Google Scholar]
- Ma JF, Higashitani A, Sato K, Tateda K (2003) Genotypic variation in Si content of barley grain. Plant Soil 249 383–387 [Google Scholar]
- Ma JF, Mitani N, Nagao S, Konishi S, Tamai K, Iwashita T, Yano M (2004) Characterization of Si uptake system and molecular mapping of Si transporter gene in rice. Plant Physiol 136 3284–3289 [DOI] [PMC free article] [PubMed] [Google Scholar]
- Ma JF, Sasaki S, Matsumoto H (1997) Al-induced inhibition of root elongation in corn, Zea mays L. is overcome by Si addition. Plant Soil 188 171–176 [Google Scholar]
- Ma JF, Takahashi E (1990) Effect of silicon on the growth and phosphorus uptake of rice. Plant Soil 126 115–119 [Google Scholar]
- Ma JF, Takahashi E (2002) Soil, Fertilizer, and Plant Silicon Research in Japan. Elsevier Science, Amsterdam
- Ma JF, Tamai K, Ichii M, Wu K (2002) A rice mutant defective in active Si uptake. Plant Physiol 130 2111–2117 [DOI] [PMC free article] [PubMed] [Google Scholar]
- Ma JF, Tamai K, Yamaji N, Mitani N, Konishi S, Katsuhara M, Ishiguro M, Murata Y, Yano M (2006) A silicon transporter in rice. Nature 440 688–691 [DOI] [PubMed] [Google Scholar]
- Ma JF, Yamaji N (2006) Silicon uptake and accumulation in higher plants. Trends Plant Sci 11 392–397 [DOI] [PubMed] [Google Scholar]
- Ma JF, Yamaji N, Mitani N, Tamai K, Konishi S, Fujiwara T, Katsuhara M, Yano M (2007) An efflux transporter of silicon in rice. Nature 448 209–211 [DOI] [PubMed] [Google Scholar]
- Majumder ND, Rakahit SC, Borthankur DN (1985) Genetics of silica uptake in selected genotypes of rice. Plant Soil 88 449–453 [Google Scholar]
- Marschner H (1995) Nutritional physiology. In H Marschner, ed, Mineral Nutrition of Higher Plants. Academic Press Limited, London, pp 417–426
- Mitani N, Ma JF (2005) Uptake system of silicon in different plant species. J Exp Bot 56 1255–1261 [DOI] [PubMed] [Google Scholar]
- Richmond KE, Sussman M (2003) Got silicon? The non-essential beneficial plant nutrient. Curr Opin Plant Biol 6 268–272 [DOI] [PubMed] [Google Scholar]
- Takahashi E, Hino K (1978) Silica uptake by plant with special reference to the forms of dissolved silica. Jpn J Soil Sci Manure 49 357–360 [Google Scholar]
- Takahashi E, Ma JF, Miyake Y (1990) The possibility of silicon as an essential element for higher plants. Comments Agric Food Chem 2 99–122 [Google Scholar]
- Winslow MD (1992) Silicon, disease resistance, and yield of rice genotypes under upland cultural conditions. Crop Sci 32 1208–1213 [Google Scholar]
- Winslow MD, Okada K, CorreaVictoria F (1997) Silicon deficiency and the adaptation of tropical rice ecotypes. Plant Soil 188 239–248 [Google Scholar]
- Wu QS, Wan XY, Su N, Cheng ZJ, Wang JK, Lei CL, Zhang X, Jiang L, Ma JF, Wan JM (2006) Genetic dissection of silicon uptake ability in rice (Oryza sativa L.). Plant Sci 171 441–448 [DOI] [PubMed] [Google Scholar]
- Yamaji N, Ma JF (2007) Spatial distribution and temporal variation of the rice silicon transporter Lsi1. Plant Physiol 143 1306–1313 [DOI] [PMC free article] [PubMed] [Google Scholar]
- Yoshida S, Ohnishi Y, Kitagishi K (1962) Histochemistry of Si in rice tissues. III. The presence of cuticle-silica double layer in the epidermal tissue. Soil Sci Plant Nutr 8 1–5 [Google Scholar]
- Yuan HF, Cheng YS (1977) The physiological significance in rice plants: the influence of pH on silicon uptake of rice plants and the presence of silica in the cell wall. Proc Nat Sci Council (Taiwan) 10 2–13 [Google Scholar]


